![Motivation: Why data mining?
Data explosion problem:
Automated data collection tools and mature database
technology lead to tremendous amounts of data stored in
databases, data warehouses and other information repositories.
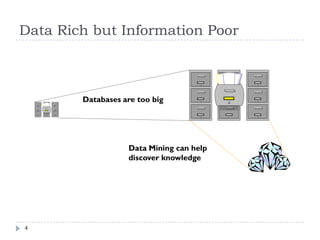
We are drowning in data, but starving for knowledge!
Data Mining:
Extraction of interesting knowledge (rules, regularities, patterns,
constraints) from data in large databases [JH].
Analysis of the large quantities of data that are stored in
computers [DO],
Alternative names
KDD, knowledge extraction, data archeology, information
harvesting, business intelligence, etc.
3](https://image.slidesharecdn.com/01-lect1introtodmbi-091221192954-phpapp02/85/01-Introduction-to-Data-Mining-and-BI-3-320.jpg)


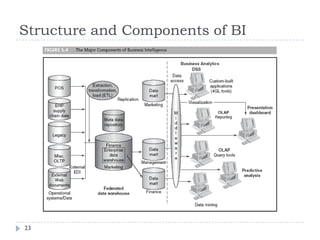
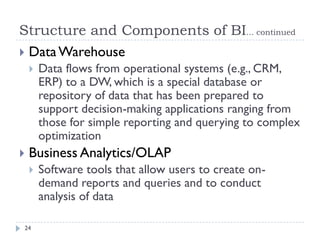

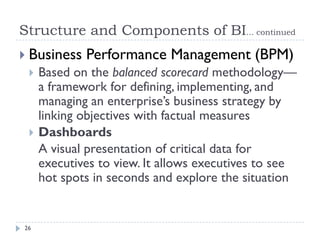


This document provides an introduction to data mining and business intelligence (BI). It discusses the motivation for data mining due to data explosion problems and how data mining can help extract knowledge from large databases. The document outlines some common data mining techniques and explains the overall process. It also describes the typical components of a BI system including the data warehouse, analytics tools, data mining, and business performance management. Finally, it discusses how BI is continuing to evolve with more users and by leveraging existing IT investments.