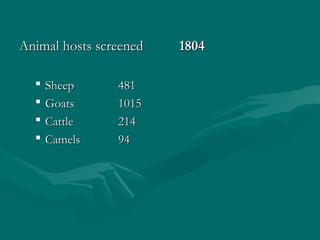
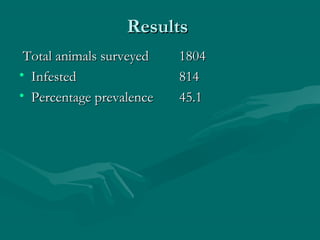
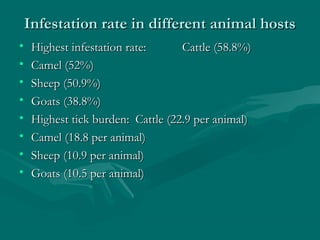
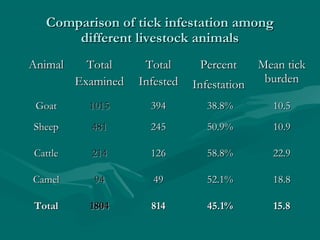
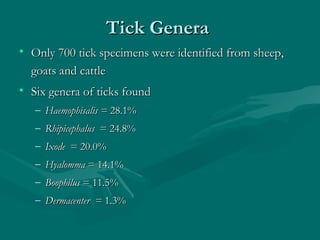
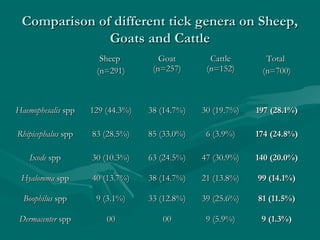
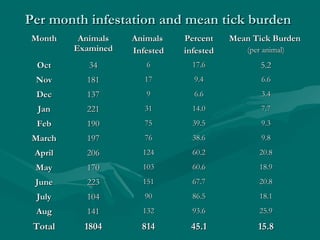
Prevalence of tick infestation onPrevalence of tick infestation on
livestock animals in Pothwar,livestock animals in Pothwar,
PakistanPakistan
Majid MahmoodMajid Mahmood MajidMajid and Mazhar Qayyumand Mazhar Qayyum
Department of Zoology, PMAS Arid AgricultureDepartment of Zoology, PMAS Arid Agriculture
University Rawalpindi, PakistanUniversity Rawalpindi, Pakistan
IntroductionIntroduction
Ticks:Ticks:
• Ectoparasites: blood suckingEctoparasites: blood sucking
• Affect the productive potential of livestockAffect the productive potential of livestock
• Transmit protozoan parasites viz.,Transmit protozoan parasites viz., BabesiaBabesia spp. andspp. and
TheileriaTheileria sppspp..
• The information on ticks prevalence is scanty inThe information on ticks prevalence is scanty in
PakistanPakistan
• No previous study in Pothwar regionNo previous study in Pothwar region
Objective:Objective:
• To find out the prevalence of ticks infestationTo find out the prevalence of ticks infestation
pattern among different livestock animals ofpattern among different livestock animals of
Pothwar regionPothwar region
Materials and MethodsMaterials and Methods
Study PeriodStudy Period
• October 2008 to August 2009October 2008 to August 2009
Study AreaStudy Area
• The main study site: Barani LivestockThe main study site: Barani Livestock
Production Research Institute KherimuratProduction Research Institute Kherimurat
(BLPRI), District Attock(BLPRI), District Attock
• Other livestock farms surveyedOther livestock farms surveyed
– ChakwalChakwal
– Kallar KahaarKallar Kahaar
– Tala GangTala Gang
– ChakriChakri
– RawaatRawaat
– Chak Baili KhanChak Baili Khan
– Kallar SayyadanKallar Sayyadan
– National Agriculture Research Center (NARC)National Agriculture Research Center (NARC)
IslamabadIslamabad
Animal hosts screenedAnimal hosts screened 18041804
 SheepSheep 481481
 GoatsGoats 10151015
 CattleCattle 214214
 CamelsCamels 9494
TicksTicks collectioncollection
• All body parts of the animals were thoroughlyAll body parts of the animals were thoroughly
inspectedinspected
• Picked with the help of rubber coated forcepsPicked with the help of rubber coated forceps
• Stored in 70% ethyl alcoholStored in 70% ethyl alcohol
• Properly labeledProperly labeled
Ticks processing for identificationTicks processing for identification
• Washed with distilled waterWashed with distilled water
• Boiled in 10% KOH for 30 minutesBoiled in 10% KOH for 30 minutes
• 10% glacial acetic acid for 5 minutes10% glacial acetic acid for 5 minutes
• Washed with distilled waterWashed with distilled water
• Stained with 10% acid fuchsin for 2 minutesStained with 10% acid fuchsin for 2 minutes
• Washed with distilled waterWashed with distilled water
• Dehydrated through 30%, 50%, 70%, 80%, 90% andDehydrated through 30%, 50%, 70%, 80%, 90% and
absolute alcoholabsolute alcohol
• Cleared in clove oilCleared in clove oil
• Mounted in Canada balsam on glass slideMounted in Canada balsam on glass slide
IdentificationIdentification
• Morphological examination underMorphological examination under
stereomicroscopestereomicroscope
• Identified according to the keys andIdentified according to the keys and
descriptions given by Hoogstraal (1979) anddescriptions given by Hoogstraal (1979) and
WalkerWalker et alet al. (2003). (2003)
ResultsResults
Total animals surveyedTotal animals surveyed 18041804
• InfestedInfested 814814
• Percentage prevalencePercentage prevalence 45.145.1
Infestation rate in different animal hostsInfestation rate in different animal hosts
• Highest infestation rate:Highest infestation rate: Cattle (58.8%)Cattle (58.8%)
• Camel (52%)Camel (52%)
• Sheep (50.9%)Sheep (50.9%)
• Goats (38.8%)Goats (38.8%)
• Highest tick burden: Cattle (22.9 per animal)Highest tick burden: Cattle (22.9 per animal)
• Camel (18.8 per animal)Camel (18.8 per animal)
• Sheep (10.9 per animal)Sheep (10.9 per animal)
• Goats (10.5 per animal)Goats (10.5 per animal)
Comparison of tick infestation amongComparison of tick infestation among
different livestock animalsdifferent livestock animals
AnimalAnimal TotalTotal
ExaminedExamined
TotalTotal
InfestedInfested
PercentPercent
InfestationInfestation
Mean tickMean tick
burdenburden
GoatGoat 10151015 394394 38.8%38.8% 10.510.5
SheepSheep 481481 245245 50.9%50.9% 10.910.9
CattleCattle 214214 126126 58.8%58.8% 22.922.9
CamelCamel 9494 4949 52.1%52.1% 18.818.8
TotalTotal 18041804 814814 45.1%45.1% 15.815.8
Tick GeneraTick Genera
• Only 700 tick specimens were identified from sheep,Only 700 tick specimens were identified from sheep,
goats and cattlegoats and cattle
• Six genera of ticks foundSix genera of ticks found
– Haemophisalis =Haemophisalis = 28.1%28.1%
– RhipicephalusRhipicephalus = 24.8%= 24.8%
– IxodeIxode = 20.0%= 20.0%
– HyalommaHyalomma = 14.1%= 14.1%
– BoophilusBoophilus = 11.5%= 11.5%
– Dermacenter =Dermacenter = 1.3%1.3%
• Haemophesalis:Haemophesalis: Most abundant on sheepMost abundant on sheep
• Rhipicephalis:Rhipicephalis: Most abundant on goatsMost abundant on goats
• Ixode:Ixode: Most abundant on cattleMost abundant on cattle
Comparison of different tick genera on Sheep,Comparison of different tick genera on Sheep,
Goats and CattleGoats and Cattle
SheepSheep
(n=291)(n=291)
GoatGoat
(n=257)(n=257)
CattleCattle
(n=152)(n=152)
TotalTotal
(n=700)(n=700)
HaemophesalisHaemophesalis sppspp 129 (44.3%)129 (44.3%) 38 (14.7%)38 (14.7%) 30 (19.7%)30 (19.7%) 197 (28.1%)197 (28.1%)
RhipicephalusRhipicephalus sppspp 83 (28.5%)83 (28.5%) 85 (33.0%)85 (33.0%) 6 (3.9%)6 (3.9%) 174 (24.8%)174 (24.8%)
IxodeIxode sppspp 30 (10.3%)30 (10.3%) 63 (24.5%)63 (24.5%) 47 (30.9%)47 (30.9%) 140 (20.0%)140 (20.0%)
HyalommaHyalomma sppspp 40 (13.7%)40 (13.7%) 38 (14.7%)38 (14.7%) 21 (13.8%)21 (13.8%) 99 (14.1%)99 (14.1%)
BoophilusBoophilus sppspp 9 (3.1%)9 (3.1%) 33 (12.8%)33 (12.8%) 39 (25.6%)39 (25.6%) 81 (11.5%)81 (11.5%)
DermacenterDermacenter sppspp 0000 0000 9 (5.9%)9 (5.9%) 9 (1.3%)9 (1.3%)
Per month infestation and mean tick burdenPer month infestation and mean tick burden
MonthMonth AnimalsAnimals
ExaminedExamined
AnimalsAnimals
InfestedInfested
PercentPercent
infestedinfested
Mean Tick BurdenMean Tick Burden
(per animal)(per animal)
OctOct 3434 66 17.617.6 5.25.2
NovNov 181181 1717 9.49.4 6.66.6
DecDec 137137 99 6.66.6 3.43.4
JanJan 221221 3131 14.014.0 7.77.7
FebFeb 190190 7575 39.539.5 9.39.3
MarchMarch 197197 7676 38.638.6 9.89.8
AprilApril 206206 124124 60.260.2 20.820.8
MayMay 170170 103103 60.660.6 18.918.9
JuneJune 223223 151151 67.767.7 20.820.8
JulyJuly 104104 9090 86.586.5 18.118.1
AugAug 141141 132132 93.693.6 25.925.9
TotalTotal 18041804 814814 45.145.1 15.815.8
Seasonal AbundanceSeasonal Abundance
Infestation rateInfestation rate was:was:
• Very high in August and JulyVery high in August and July
• High in February, March, April, May and JuneHigh in February, March, April, May and June
• Low in October, November, December andLow in October, November, December and
JanuaryJanuary
ConclusionsConclusions
• Both infestation rate and average tick burden were veryBoth infestation rate and average tick burden were very
high in summer (rainy) as compared to winterhigh in summer (rainy) as compared to winter
• Both were highest in AugustBoth were highest in August
• Lower in may and June as compared to July and AugustLower in may and June as compared to July and August
• Ticks seem to prefer high humidity and temperatureTicks seem to prefer high humidity and temperature
but not dry-hot conditionsbut not dry-hot conditions
Tick infestation majid m. m.

Tick infestation majid m. m.

  • 1.
    Prevalence of tickinfestation onPrevalence of tick infestation on livestock animals in Pothwar,livestock animals in Pothwar, PakistanPakistan Majid MahmoodMajid Mahmood MajidMajid and Mazhar Qayyumand Mazhar Qayyum Department of Zoology, PMAS Arid AgricultureDepartment of Zoology, PMAS Arid Agriculture University Rawalpindi, PakistanUniversity Rawalpindi, Pakistan
  • 2.
    IntroductionIntroduction Ticks:Ticks: • Ectoparasites: bloodsuckingEctoparasites: blood sucking • Affect the productive potential of livestockAffect the productive potential of livestock • Transmit protozoan parasites viz.,Transmit protozoan parasites viz., BabesiaBabesia spp. andspp. and TheileriaTheileria sppspp..
  • 3.
    • The informationon ticks prevalence is scanty inThe information on ticks prevalence is scanty in PakistanPakistan • No previous study in Pothwar regionNo previous study in Pothwar region Objective:Objective: • To find out the prevalence of ticks infestationTo find out the prevalence of ticks infestation pattern among different livestock animals ofpattern among different livestock animals of Pothwar regionPothwar region
  • 4.
    Materials and MethodsMaterialsand Methods Study PeriodStudy Period • October 2008 to August 2009October 2008 to August 2009 Study AreaStudy Area • The main study site: Barani LivestockThe main study site: Barani Livestock Production Research Institute KherimuratProduction Research Institute Kherimurat (BLPRI), District Attock(BLPRI), District Attock
  • 5.
    • Other livestockfarms surveyedOther livestock farms surveyed – ChakwalChakwal – Kallar KahaarKallar Kahaar – Tala GangTala Gang – ChakriChakri – RawaatRawaat – Chak Baili KhanChak Baili Khan – Kallar SayyadanKallar Sayyadan – National Agriculture Research Center (NARC)National Agriculture Research Center (NARC) IslamabadIslamabad
  • 6.
    Animal hosts screenedAnimalhosts screened 18041804  SheepSheep 481481  GoatsGoats 10151015  CattleCattle 214214  CamelsCamels 9494
  • 7.
    TicksTicks collectioncollection • Allbody parts of the animals were thoroughlyAll body parts of the animals were thoroughly inspectedinspected • Picked with the help of rubber coated forcepsPicked with the help of rubber coated forceps • Stored in 70% ethyl alcoholStored in 70% ethyl alcohol • Properly labeledProperly labeled
  • 8.
    Ticks processing foridentificationTicks processing for identification • Washed with distilled waterWashed with distilled water • Boiled in 10% KOH for 30 minutesBoiled in 10% KOH for 30 minutes • 10% glacial acetic acid for 5 minutes10% glacial acetic acid for 5 minutes • Washed with distilled waterWashed with distilled water • Stained with 10% acid fuchsin for 2 minutesStained with 10% acid fuchsin for 2 minutes • Washed with distilled waterWashed with distilled water • Dehydrated through 30%, 50%, 70%, 80%, 90% andDehydrated through 30%, 50%, 70%, 80%, 90% and absolute alcoholabsolute alcohol • Cleared in clove oilCleared in clove oil • Mounted in Canada balsam on glass slideMounted in Canada balsam on glass slide
  • 9.
    IdentificationIdentification • Morphological examinationunderMorphological examination under stereomicroscopestereomicroscope • Identified according to the keys andIdentified according to the keys and descriptions given by Hoogstraal (1979) anddescriptions given by Hoogstraal (1979) and WalkerWalker et alet al. (2003). (2003)
  • 10.
    ResultsResults Total animals surveyedTotalanimals surveyed 18041804 • InfestedInfested 814814 • Percentage prevalencePercentage prevalence 45.145.1
  • 11.
    Infestation rate indifferent animal hostsInfestation rate in different animal hosts • Highest infestation rate:Highest infestation rate: Cattle (58.8%)Cattle (58.8%) • Camel (52%)Camel (52%) • Sheep (50.9%)Sheep (50.9%) • Goats (38.8%)Goats (38.8%) • Highest tick burden: Cattle (22.9 per animal)Highest tick burden: Cattle (22.9 per animal) • Camel (18.8 per animal)Camel (18.8 per animal) • Sheep (10.9 per animal)Sheep (10.9 per animal) • Goats (10.5 per animal)Goats (10.5 per animal)
  • 12.
    Comparison of tickinfestation amongComparison of tick infestation among different livestock animalsdifferent livestock animals AnimalAnimal TotalTotal ExaminedExamined TotalTotal InfestedInfested PercentPercent InfestationInfestation Mean tickMean tick burdenburden GoatGoat 10151015 394394 38.8%38.8% 10.510.5 SheepSheep 481481 245245 50.9%50.9% 10.910.9 CattleCattle 214214 126126 58.8%58.8% 22.922.9 CamelCamel 9494 4949 52.1%52.1% 18.818.8 TotalTotal 18041804 814814 45.1%45.1% 15.815.8
  • 13.
    Tick GeneraTick Genera •Only 700 tick specimens were identified from sheep,Only 700 tick specimens were identified from sheep, goats and cattlegoats and cattle • Six genera of ticks foundSix genera of ticks found – Haemophisalis =Haemophisalis = 28.1%28.1% – RhipicephalusRhipicephalus = 24.8%= 24.8% – IxodeIxode = 20.0%= 20.0% – HyalommaHyalomma = 14.1%= 14.1% – BoophilusBoophilus = 11.5%= 11.5% – Dermacenter =Dermacenter = 1.3%1.3%
  • 14.
    • Haemophesalis:Haemophesalis: Mostabundant on sheepMost abundant on sheep • Rhipicephalis:Rhipicephalis: Most abundant on goatsMost abundant on goats • Ixode:Ixode: Most abundant on cattleMost abundant on cattle
  • 15.
    Comparison of differenttick genera on Sheep,Comparison of different tick genera on Sheep, Goats and CattleGoats and Cattle SheepSheep (n=291)(n=291) GoatGoat (n=257)(n=257) CattleCattle (n=152)(n=152) TotalTotal (n=700)(n=700) HaemophesalisHaemophesalis sppspp 129 (44.3%)129 (44.3%) 38 (14.7%)38 (14.7%) 30 (19.7%)30 (19.7%) 197 (28.1%)197 (28.1%) RhipicephalusRhipicephalus sppspp 83 (28.5%)83 (28.5%) 85 (33.0%)85 (33.0%) 6 (3.9%)6 (3.9%) 174 (24.8%)174 (24.8%) IxodeIxode sppspp 30 (10.3%)30 (10.3%) 63 (24.5%)63 (24.5%) 47 (30.9%)47 (30.9%) 140 (20.0%)140 (20.0%) HyalommaHyalomma sppspp 40 (13.7%)40 (13.7%) 38 (14.7%)38 (14.7%) 21 (13.8%)21 (13.8%) 99 (14.1%)99 (14.1%) BoophilusBoophilus sppspp 9 (3.1%)9 (3.1%) 33 (12.8%)33 (12.8%) 39 (25.6%)39 (25.6%) 81 (11.5%)81 (11.5%) DermacenterDermacenter sppspp 0000 0000 9 (5.9%)9 (5.9%) 9 (1.3%)9 (1.3%)
  • 16.
    Per month infestationand mean tick burdenPer month infestation and mean tick burden MonthMonth AnimalsAnimals ExaminedExamined AnimalsAnimals InfestedInfested PercentPercent infestedinfested Mean Tick BurdenMean Tick Burden (per animal)(per animal) OctOct 3434 66 17.617.6 5.25.2 NovNov 181181 1717 9.49.4 6.66.6 DecDec 137137 99 6.66.6 3.43.4 JanJan 221221 3131 14.014.0 7.77.7 FebFeb 190190 7575 39.539.5 9.39.3 MarchMarch 197197 7676 38.638.6 9.89.8 AprilApril 206206 124124 60.260.2 20.820.8 MayMay 170170 103103 60.660.6 18.918.9 JuneJune 223223 151151 67.767.7 20.820.8 JulyJuly 104104 9090 86.586.5 18.118.1 AugAug 141141 132132 93.693.6 25.925.9 TotalTotal 18041804 814814 45.145.1 15.815.8
  • 17.
    Seasonal AbundanceSeasonal Abundance InfestationrateInfestation rate was:was: • Very high in August and JulyVery high in August and July • High in February, March, April, May and JuneHigh in February, March, April, May and June • Low in October, November, December andLow in October, November, December and JanuaryJanuary
  • 18.
    ConclusionsConclusions • Both infestationrate and average tick burden were veryBoth infestation rate and average tick burden were very high in summer (rainy) as compared to winterhigh in summer (rainy) as compared to winter • Both were highest in AugustBoth were highest in August • Lower in may and June as compared to July and AugustLower in may and June as compared to July and August • Ticks seem to prefer high humidity and temperatureTicks seem to prefer high humidity and temperature but not dry-hot conditionsbut not dry-hot conditions