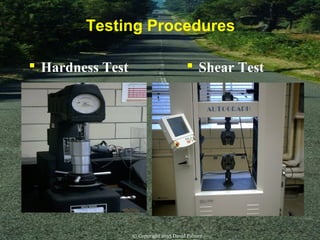
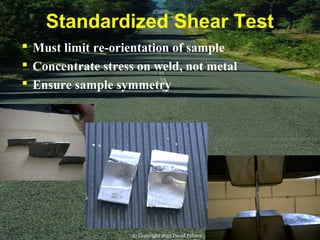
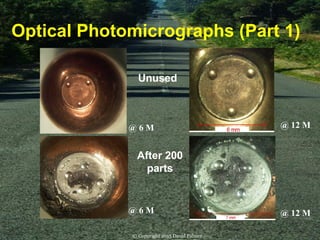
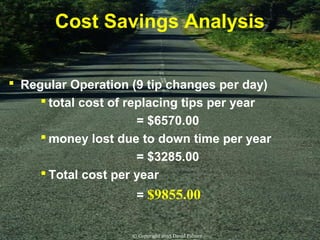
© Copyright 2015 David Palmer
Industrial Partner: SKD Automotive
Liaison: Ian Cross
Supervisor: Prof. T. North
By: Tom Broumas and David Palmer
University of Toronto
Faculty of Applied Science and Engineering
SPOT WELD TIP DRESSING
© Copyright 2015 David Palmer
Resistance Welding at SKD
 High production in stamping and welding
 Canadian, American and Mexican based plants
 Largest clients are:
Ford
General Motors
Daimler Chrysler
Honda
Mitsubishi
© Copyright 2015 David Palmer
Inefficient Comparison
 Robotic Mig Welder
 Arc Welder
 Spot Welding Cell
 Some cells can produce
5,000 to 10,000 welds per
pair of electrode tips
 Resistance Spot Welding
Cell can only produce
1200 welds per pair
© Copyright 2015 David Palmer
Improving Tip Life
 Interest in investment
of Spot Weld Tip
Dressing Equipment
 Retails for $3000
 Must be profitable and
economical
 Return on investment
in one year
© Copyright 2015 David Palmer
Jeep Liberty
© Copyright 2015 David Palmer
Tail Light Assembly
© Copyright 2015 David Palmer
Objectives
Test and compare:
 Hardness strength of the copper tips
 Shear strength of the welded joints
 The performance of the cells with and
without the tip dressing equipment
 Cost saving analysis
 Improve the tip life
© Copyright 2015 David Palmer
Resistance Spot Welding
Advantages of
Spot Welding
 Quick and Efficient
 Cost and Energy
 Pressure Instead of
Flux
 Easy Automation
 Adequate in Welding
Thin Sheets
© Copyright 2015 David Palmer
Copper Tips
SKD currently uses Copper as their tip electrode because they are:
Relatively cheap
Good welding quality
Good electrical conductivity
It will not easily stick to the metal panels being welded
© Copyright 2015 David Palmer
The Welding Process
 Preweld Interval
 Clamping
 Pressure = 900lbs
 Preheat
 Weld Interval
 Upslope
 Heat Time
(Impulse)
 Cool Time
 Post weld Interval
 Down slope
 Quench/Temper
 Hold
© Copyright 2015 David Palmer
Possible Benefits of Tip Dressing
 Maintain Original Geometry
 Reduce Downtime
 Reduce/Eliminate Steppers
 Less Overall Wear and Tear
 Extend Tip Life
© Copyright 2015 David Palmer
 Hardness Test  Shear Test
Testing Procedures
© Copyright 2015 David Palmer
Standardized Shear Test
 Must limit re-orientation of sample
 Concentrate stress on weld, not metal
 Ensure sample symmetry
© Copyright 2015 David Palmer
Teardown Test
 Performed by operators at SKD using a
jackhammer
 The nugget diameter > 4.1mm
© Copyright 2015 David Palmer
Results and Discussion
© Copyright 2015 David Palmer
First Test – Regular Operation
 To develop a method and procedure for
testing weld samples
 To identify any trends that might exist
 To observe the extent of degradation of the
copper tips
 To establish a standard which can be used
as reference for future
© Copyright 2015 David Palmer
Stepper Chart (Part 1)
Stepper Current Plot for Different Welding Experiments
50
55
60
65
70
75
0 200 400 600 800 1000 1200
Number of Welds
%AppliedCurrent(A)
Running to 200 Parts
© Copyright 2015 David Palmer
Max Load in Shear vs. Part
Number Graphs
(for regular operation)
© Copyright 2015 David Palmer
Normal Operation
Weld #6 Shear Strength vs. Production Number
2.0
2.5
3.0
3.5
4.0
4.5
1 2 52 53 100 150 200
Tail Light Assembly Production Number
WeldMaxLoad(kN)
Normal Operation
Weld #5 Shear Strength vs. Production Number
2.0
2.5
3.0
3.5
4.0
4.5
5.0
1 2 52 53 100 150 200
Tail Light Assembly Production Number
WeldMaxLoad(kN)
Normal Operation
Weld #1 Shear Strength vs. Production Number
2.0
2.5
3.0
3.5
4.0
4.5
1 2 52 53 100 150 200
Tail Light Assembly Production Number
WeldMaxLoad(kN)
Normal Operation
Weld #4 Shear Strength vs. Production Number
2.0
2.5
3.0
3.5
4.0
4.5
5.0
1 2 52 53 100 150 200
Tail Light Assembly Production Number
WeldMaxLoad(kN)
Normal Operation
Weld #3 Shear Strength vs. Production Number
2.0
2.5
3.0
3.5
4.0
4.5
1 2 52 53 100 150 200
Tail Light Assembly Production Number
WeldMaxLoad(kN)
Normal Operation
Weld #2 Shear Strength vs. Production Number
2.0
2.5
3.0
3.5
4.0
4.5
1 2 52 53 100 150 200
Tail Light Assembly Production Number
WeldMaxLoad(kN)
Weld
#3
Weld
#4
Weld
#5
Weld
#2
Weld
#6
Weld
#1
© Copyright 2015 David Palmer
Weld Designations
© Copyright 2015 David Palmer
Hardness Graph (Part 1)
Hardness Chart for Copper Tips Under Different Testing
Conditions
0.0
10.0
20.0
30.0
40.0
50.0
60.0
70.0
80.0
90.0
100.0
RockwellBHardness
Average Values 80.1 60.3
Unused 200 parts produced
© Copyright 2015 David Palmer
Optical Photomicrographs (Part 1)
Unused
After 200
parts
@ 12 M@ 6 M
@ 6 M @ 12 M
© Copyright 2015 David Palmer
Second Test – Extending Tip Life
 To examine whether the operation can
produced more than 200 parts per pair of
copper tips
 To observe the behavior of the copper tips
with this additional stress
 To study if weld quality will diminish
significantly
 (Note): After production of part #213, weld
quality was discovered to decrease. To
compensate, current was increase by 1%
manually (160 amps)© Copyright 2015 David Palmer
Stepper Chart (Part 2)
Stepper Current Plot for Different Welding Experiments
50
55
60
65
70
75
0 200 400 600 800 1000 1200 1400 1600 1800
Number of Welds
%AppliedCurrent(A)
Running to 200 Parts
Running to 300 Parts
© Copyright 2015 David Palmer
Max Load in Shear vs. Part
Number Graphs
(for extending tip life)
© Copyright 2015 David Palmer
Production Past 200 Tail Light Assemblies
Without Copper Tip Dressing
Weld #1 Shear Strength vs. Production Number
2.0
2.5
3.0
3.5
4.0
4.5
5.0
215 221 225 254 275 299
Tail Light Assembly Production Number
WeldMaxLoad(kN)
Production Past 200 Tail Light Assemblies
Without Copper Tip Dressing
Weld #2 Shear Strength vs. Production Number
2.0
2.5
3.0
3.5
4.0
4.5
215 221 225 254 275 299
Tail Light Assembly Production Number
WeldMaxLoad(kN)
Production Past 200 Tail Light Assemblies
Without Copper Tip Dressing
Weld #3 Shear Strength vs. Production Number
2.0
2.5
3.0
3.5
4.0
4.5
215 221 225 254 275 299
Tail Light Assembly Production Number
WeldMaxLoad(kN)
Production Past 200 Tail Light Assemblies
Without Copper Tip Dressing
Weld #4 Shear Strength vs. Production Number
2.0
2.5
3.0
3.5
4.0
4.5
215 221 225 254 275 299
Tail Light Assembly Production Number
WeldMaxLoad(kN)
Production Past 200 Tail Light Assemblies
Without Copper Tip Dressing
Weld #5 Shear Strength vs. Production Number
2.0
2.5
3.0
3.5
4.0
4.5
5.0
215 221 225 254 275 299
Tail Light Assembly Production Number
WeldMaxLoad(kN)
Production Past 200 Tail Light Assemblies
Without Copper Tip Dressing
Weld #6 Shear Strength vs. Production Number
2.0
2.5
3.0
3.5
4.0
4.5
215 221 225 254 275 299
Tail Light Assembly Production Number
WeldMaxLoad(kN)
Weld
#1
Weld
#2
Weld
#3
Weld
#6
Weld
#5
Weld
#4
© Copyright 2015 David Palmer
Hardness Graph (Part 2)
Hardness Chart for Copper Tips Under Different Testing
Conditions
0.0
10.0
20.0
30.0
40.0
50.0
60.0
70.0
80.0
90.0
100.0
RockwellBHardness
Average Values 80.1 60.3 50.0
Unused 200 parts produced 300 parts produced
© Copyright 2015 David Palmer
Optical Photomicrographs (Part 2)
8 mm
After 300 Parts
@ 12 X M @ 25 X M
© Copyright 2015 David Palmer
Optical Photomicrographs (Part 2)
After 300 Parts
Side-view of Copper Tip @ 12 X M
© Copyright 2015 David Palmer
Final Test – Application of Tip
Dressing
 To observe how tip dressing alters the
surface properties of the copper tips
 To compare the difference in down time of
changing tips vs. tip dressing
 To study if tip dressing improves the quality
of the welds
 (Note): Due to the difficult demand in setting
up a tip dresser on an operational robot, SKD
preferred to use on-site equipment for this
experiment (a manual tip dresser was applied
to the copper tips).
© Copyright 2015 David Palmer
Stepper Chart (Part 3)
Stepper Current Plot for Different Welding Experiments
50
55
60
65
70
75
0 200 400 600 800 1000 1200 1400 1600 1800
Number of Welds
%AppliedCurrent(A)
Running to 200 Parts
Running to 300 Parts
Running to 200 Parts,
Apply Tip Dressing, Run
Addtional 100 Parts
© Copyright 2015 David Palmer
Max Load in Shear vs. Part
Number Graphs
(for application of tip dressing)
Production Past 200 Tail Light Assemblies
With Copper Tip Dressing
Weld #1 Shear Strength vs. Production Number
2.0
2.5
3.0
3.5
4.0
4.5
206 225 250 275 299
Tail Light Assembly Production Number
WeldMaxLoad(kN)
Production Past 200 Tail Light Assemblies
With Copper Tip Dressing
Weld #2 Shear Strength vs. Production Number
2.0
2.5
3.0
3.5
4.0
4.5
206 225 250 275 299
Tail Light Assembly Production Number
WeldMaxLoad(kN)
Production Past 200 Tail Light Assemblies
With Copper Tip Dressing
Weld #3 Shear Strength vs. Production Number
2.0
2.5
3.0
3.5
4.0
4.5
206 225 250 275 299
Tail Light Assembly Production Number
WeldMaxLoad(kN)
Production Past 200 Tail Light Assemblies
With Copper Tip Dressing
Weld #4 Shear Strength vs. Production Number
2.0
2.5
3.0
3.5
4.0
4.5
206 225 250 275 299
Tail Light Assembly Production Number
WeldMaxLoad(kN)
Production Past 200 Tail Light Assemblies
With Copper Tip Dressing
Weld #5 Shear Strength vs. Production Number
2.0
2.5
3.0
3.5
4.0
4.5
206 225 250 275 299
Tail Light Assembly Production Number
WeldMaxLoad(kN)
Production Past 200 Tail Light Assemblies
With Copper Tip Dressing
Weld #6 Shear Strength vs. Production Number
2.0
2.5
3.0
3.5
4.0
4.5
206 225 250 275 299
Tail Light Assembly Production Number
WeldMaxLoad(kN)
Weld
#1
Weld
#2
Weld
#3
Weld
#4
Weld
#6
Weld
#5
© Copyright 2015 David Palmer
Hardness Graph (Part 3)
Hardness Chart for Copper Tips Under Different Testing
Conditions
0.0
10.0
20.0
30.0
40.0
50.0
60.0
70.0
80.0
90.0
100.0
RockwellBHardness
Average Values 80.1 60.3 50.0 73.0 69.9
Unused
200 parts
produced
300 parts
produced
200 parts
produced, with
300 parts
produced, with
© Copyright 2015 David Palmer
Optical Photomicrographs (Part 3)
Dressed
6.5 mm
7 mm
@ 12 X M
@ 12 X M
@ 25 X M
@ 25 X M
After 100
additional
parts
© Copyright 2015 David Palmer
Optical Photomicrographs (Part 3)
 Left side appears
similar to tip that
produced 200 parts
 Right side
appears similar to
tip thatproduced 300 parts
© Copyright 2015 David Palmer
$$
$
$$
$
© Copyright 2015 David Palmer
Cost Savings Analysis
 Regular Operation (9 tip changes per day)
 total cost of replacing tips per year
= $6570.00
 money lost due to down time per year
= $3285.00
 Total cost per year
= $9855.00
© Copyright 2015 David Palmer
Cost Savings Analysis (cont’d)
 Minimal Tip Dressing (3 tip changes per day)
 total cost of replacing tips per year = $2190.00
 money lost due to down time per year = $1168.00
 Total cost per year = $3358.00
 Maximum Tip Dressing (2 tip changes per day)
 total cost of replacing tips per year = $1490.00
 money lost due to down time per year = $ 815.17
 Total cost per year = $2305.17
© Copyright 2015 David Palmer
Conclusion
 Tip dressing is a viable way of improving the
spot welding process
 More cost-effective and efficient, without the
need of extra energy
 Automated processes are preferred over
manual dressers (eliminates human error)
 SKD can save an estimated $6500 to $7500 per
year
© Copyright 2015 David Palmer
Acknowledgements
Ian Cross
Prof. W. Curlook
John Callaway
Farnoush Heidarzahoh
John Di Bello
Prof. Tom North
Mike King
© Copyright 2015 David Palmer

THESIS - Spot Weld Tip Dressing, Presentation

  • 1.
    © Copyright 2015David Palmer Industrial Partner: SKD Automotive Liaison: Ian Cross Supervisor: Prof. T. North By: Tom Broumas and David Palmer University of Toronto Faculty of Applied Science and Engineering SPOT WELD TIP DRESSING © Copyright 2015 David Palmer
  • 2.
    Resistance Welding atSKD  High production in stamping and welding  Canadian, American and Mexican based plants  Largest clients are: Ford General Motors Daimler Chrysler Honda Mitsubishi © Copyright 2015 David Palmer
  • 3.
    Inefficient Comparison  RoboticMig Welder  Arc Welder  Spot Welding Cell  Some cells can produce 5,000 to 10,000 welds per pair of electrode tips  Resistance Spot Welding Cell can only produce 1200 welds per pair © Copyright 2015 David Palmer
  • 4.
    Improving Tip Life Interest in investment of Spot Weld Tip Dressing Equipment  Retails for $3000  Must be profitable and economical  Return on investment in one year © Copyright 2015 David Palmer
  • 5.
    Jeep Liberty © Copyright2015 David Palmer
  • 6.
    Tail Light Assembly ©Copyright 2015 David Palmer
  • 7.
    Objectives Test and compare: Hardness strength of the copper tips  Shear strength of the welded joints  The performance of the cells with and without the tip dressing equipment  Cost saving analysis  Improve the tip life © Copyright 2015 David Palmer
  • 8.
    Resistance Spot Welding Advantagesof Spot Welding  Quick and Efficient  Cost and Energy  Pressure Instead of Flux  Easy Automation  Adequate in Welding Thin Sheets © Copyright 2015 David Palmer
  • 9.
    Copper Tips SKD currentlyuses Copper as their tip electrode because they are: Relatively cheap Good welding quality Good electrical conductivity It will not easily stick to the metal panels being welded © Copyright 2015 David Palmer
  • 10.
    The Welding Process Preweld Interval  Clamping  Pressure = 900lbs  Preheat  Weld Interval  Upslope  Heat Time (Impulse)  Cool Time  Post weld Interval  Down slope  Quench/Temper  Hold © Copyright 2015 David Palmer
  • 11.
    Possible Benefits ofTip Dressing  Maintain Original Geometry  Reduce Downtime  Reduce/Eliminate Steppers  Less Overall Wear and Tear  Extend Tip Life © Copyright 2015 David Palmer
  • 12.
     Hardness Test Shear Test Testing Procedures © Copyright 2015 David Palmer
  • 13.
    Standardized Shear Test Must limit re-orientation of sample  Concentrate stress on weld, not metal  Ensure sample symmetry © Copyright 2015 David Palmer
  • 14.
    Teardown Test  Performedby operators at SKD using a jackhammer  The nugget diameter > 4.1mm © Copyright 2015 David Palmer
  • 15.
    © Copyright 2015David Palmer Results and Discussion © Copyright 2015 David Palmer
  • 16.
    First Test –Regular Operation  To develop a method and procedure for testing weld samples  To identify any trends that might exist  To observe the extent of degradation of the copper tips  To establish a standard which can be used as reference for future © Copyright 2015 David Palmer
  • 17.
    Stepper Chart (Part1) Stepper Current Plot for Different Welding Experiments 50 55 60 65 70 75 0 200 400 600 800 1000 1200 Number of Welds %AppliedCurrent(A) Running to 200 Parts © Copyright 2015 David Palmer
  • 18.
    © Copyright 2015David Palmer Max Load in Shear vs. Part Number Graphs (for regular operation) © Copyright 2015 David Palmer
  • 19.
    Normal Operation Weld #6Shear Strength vs. Production Number 2.0 2.5 3.0 3.5 4.0 4.5 1 2 52 53 100 150 200 Tail Light Assembly Production Number WeldMaxLoad(kN) Normal Operation Weld #5 Shear Strength vs. Production Number 2.0 2.5 3.0 3.5 4.0 4.5 5.0 1 2 52 53 100 150 200 Tail Light Assembly Production Number WeldMaxLoad(kN) Normal Operation Weld #1 Shear Strength vs. Production Number 2.0 2.5 3.0 3.5 4.0 4.5 1 2 52 53 100 150 200 Tail Light Assembly Production Number WeldMaxLoad(kN) Normal Operation Weld #4 Shear Strength vs. Production Number 2.0 2.5 3.0 3.5 4.0 4.5 5.0 1 2 52 53 100 150 200 Tail Light Assembly Production Number WeldMaxLoad(kN) Normal Operation Weld #3 Shear Strength vs. Production Number 2.0 2.5 3.0 3.5 4.0 4.5 1 2 52 53 100 150 200 Tail Light Assembly Production Number WeldMaxLoad(kN) Normal Operation Weld #2 Shear Strength vs. Production Number 2.0 2.5 3.0 3.5 4.0 4.5 1 2 52 53 100 150 200 Tail Light Assembly Production Number WeldMaxLoad(kN) Weld #3 Weld #4 Weld #5 Weld #2 Weld #6 Weld #1 © Copyright 2015 David Palmer
  • 20.
  • 21.
    Hardness Graph (Part1) Hardness Chart for Copper Tips Under Different Testing Conditions 0.0 10.0 20.0 30.0 40.0 50.0 60.0 70.0 80.0 90.0 100.0 RockwellBHardness Average Values 80.1 60.3 Unused 200 parts produced © Copyright 2015 David Palmer
  • 22.
    Optical Photomicrographs (Part1) Unused After 200 parts @ 12 M@ 6 M @ 6 M @ 12 M © Copyright 2015 David Palmer
  • 23.
    Second Test –Extending Tip Life  To examine whether the operation can produced more than 200 parts per pair of copper tips  To observe the behavior of the copper tips with this additional stress  To study if weld quality will diminish significantly  (Note): After production of part #213, weld quality was discovered to decrease. To compensate, current was increase by 1% manually (160 amps)© Copyright 2015 David Palmer
  • 24.
    Stepper Chart (Part2) Stepper Current Plot for Different Welding Experiments 50 55 60 65 70 75 0 200 400 600 800 1000 1200 1400 1600 1800 Number of Welds %AppliedCurrent(A) Running to 200 Parts Running to 300 Parts © Copyright 2015 David Palmer
  • 25.
    © Copyright 2015David Palmer Max Load in Shear vs. Part Number Graphs (for extending tip life) © Copyright 2015 David Palmer
  • 26.
    Production Past 200Tail Light Assemblies Without Copper Tip Dressing Weld #1 Shear Strength vs. Production Number 2.0 2.5 3.0 3.5 4.0 4.5 5.0 215 221 225 254 275 299 Tail Light Assembly Production Number WeldMaxLoad(kN) Production Past 200 Tail Light Assemblies Without Copper Tip Dressing Weld #2 Shear Strength vs. Production Number 2.0 2.5 3.0 3.5 4.0 4.5 215 221 225 254 275 299 Tail Light Assembly Production Number WeldMaxLoad(kN) Production Past 200 Tail Light Assemblies Without Copper Tip Dressing Weld #3 Shear Strength vs. Production Number 2.0 2.5 3.0 3.5 4.0 4.5 215 221 225 254 275 299 Tail Light Assembly Production Number WeldMaxLoad(kN) Production Past 200 Tail Light Assemblies Without Copper Tip Dressing Weld #4 Shear Strength vs. Production Number 2.0 2.5 3.0 3.5 4.0 4.5 215 221 225 254 275 299 Tail Light Assembly Production Number WeldMaxLoad(kN) Production Past 200 Tail Light Assemblies Without Copper Tip Dressing Weld #5 Shear Strength vs. Production Number 2.0 2.5 3.0 3.5 4.0 4.5 5.0 215 221 225 254 275 299 Tail Light Assembly Production Number WeldMaxLoad(kN) Production Past 200 Tail Light Assemblies Without Copper Tip Dressing Weld #6 Shear Strength vs. Production Number 2.0 2.5 3.0 3.5 4.0 4.5 215 221 225 254 275 299 Tail Light Assembly Production Number WeldMaxLoad(kN) Weld #1 Weld #2 Weld #3 Weld #6 Weld #5 Weld #4 © Copyright 2015 David Palmer
  • 27.
    Hardness Graph (Part2) Hardness Chart for Copper Tips Under Different Testing Conditions 0.0 10.0 20.0 30.0 40.0 50.0 60.0 70.0 80.0 90.0 100.0 RockwellBHardness Average Values 80.1 60.3 50.0 Unused 200 parts produced 300 parts produced © Copyright 2015 David Palmer
  • 28.
    Optical Photomicrographs (Part2) 8 mm After 300 Parts @ 12 X M @ 25 X M © Copyright 2015 David Palmer
  • 29.
    Optical Photomicrographs (Part2) After 300 Parts Side-view of Copper Tip @ 12 X M © Copyright 2015 David Palmer
  • 30.
    Final Test –Application of Tip Dressing  To observe how tip dressing alters the surface properties of the copper tips  To compare the difference in down time of changing tips vs. tip dressing  To study if tip dressing improves the quality of the welds  (Note): Due to the difficult demand in setting up a tip dresser on an operational robot, SKD preferred to use on-site equipment for this experiment (a manual tip dresser was applied to the copper tips). © Copyright 2015 David Palmer
  • 31.
    Stepper Chart (Part3) Stepper Current Plot for Different Welding Experiments 50 55 60 65 70 75 0 200 400 600 800 1000 1200 1400 1600 1800 Number of Welds %AppliedCurrent(A) Running to 200 Parts Running to 300 Parts Running to 200 Parts, Apply Tip Dressing, Run Addtional 100 Parts © Copyright 2015 David Palmer
  • 32.
    © Copyright 2015David Palmer Max Load in Shear vs. Part Number Graphs (for application of tip dressing)
  • 33.
    Production Past 200Tail Light Assemblies With Copper Tip Dressing Weld #1 Shear Strength vs. Production Number 2.0 2.5 3.0 3.5 4.0 4.5 206 225 250 275 299 Tail Light Assembly Production Number WeldMaxLoad(kN) Production Past 200 Tail Light Assemblies With Copper Tip Dressing Weld #2 Shear Strength vs. Production Number 2.0 2.5 3.0 3.5 4.0 4.5 206 225 250 275 299 Tail Light Assembly Production Number WeldMaxLoad(kN) Production Past 200 Tail Light Assemblies With Copper Tip Dressing Weld #3 Shear Strength vs. Production Number 2.0 2.5 3.0 3.5 4.0 4.5 206 225 250 275 299 Tail Light Assembly Production Number WeldMaxLoad(kN) Production Past 200 Tail Light Assemblies With Copper Tip Dressing Weld #4 Shear Strength vs. Production Number 2.0 2.5 3.0 3.5 4.0 4.5 206 225 250 275 299 Tail Light Assembly Production Number WeldMaxLoad(kN) Production Past 200 Tail Light Assemblies With Copper Tip Dressing Weld #5 Shear Strength vs. Production Number 2.0 2.5 3.0 3.5 4.0 4.5 206 225 250 275 299 Tail Light Assembly Production Number WeldMaxLoad(kN) Production Past 200 Tail Light Assemblies With Copper Tip Dressing Weld #6 Shear Strength vs. Production Number 2.0 2.5 3.0 3.5 4.0 4.5 206 225 250 275 299 Tail Light Assembly Production Number WeldMaxLoad(kN) Weld #1 Weld #2 Weld #3 Weld #4 Weld #6 Weld #5 © Copyright 2015 David Palmer
  • 34.
    Hardness Graph (Part3) Hardness Chart for Copper Tips Under Different Testing Conditions 0.0 10.0 20.0 30.0 40.0 50.0 60.0 70.0 80.0 90.0 100.0 RockwellBHardness Average Values 80.1 60.3 50.0 73.0 69.9 Unused 200 parts produced 300 parts produced 200 parts produced, with 300 parts produced, with © Copyright 2015 David Palmer
  • 35.
    Optical Photomicrographs (Part3) Dressed 6.5 mm 7 mm @ 12 X M @ 12 X M @ 25 X M @ 25 X M After 100 additional parts © Copyright 2015 David Palmer
  • 36.
    Optical Photomicrographs (Part3)  Left side appears similar to tip that produced 200 parts  Right side appears similar to tip thatproduced 300 parts © Copyright 2015 David Palmer
  • 37.
  • 38.
    Cost Savings Analysis Regular Operation (9 tip changes per day)  total cost of replacing tips per year = $6570.00  money lost due to down time per year = $3285.00  Total cost per year = $9855.00 © Copyright 2015 David Palmer
  • 39.
    Cost Savings Analysis(cont’d)  Minimal Tip Dressing (3 tip changes per day)  total cost of replacing tips per year = $2190.00  money lost due to down time per year = $1168.00  Total cost per year = $3358.00  Maximum Tip Dressing (2 tip changes per day)  total cost of replacing tips per year = $1490.00  money lost due to down time per year = $ 815.17  Total cost per year = $2305.17 © Copyright 2015 David Palmer
  • 40.
    Conclusion  Tip dressingis a viable way of improving the spot welding process  More cost-effective and efficient, without the need of extra energy  Automated processes are preferred over manual dressers (eliminates human error)  SKD can save an estimated $6500 to $7500 per year © Copyright 2015 David Palmer
  • 41.
    Acknowledgements Ian Cross Prof. W.Curlook John Callaway Farnoush Heidarzahoh John Di Bello Prof. Tom North Mike King © Copyright 2015 David Palmer