Downloaded 1,637 times


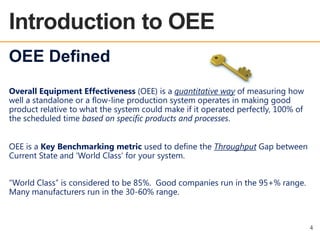


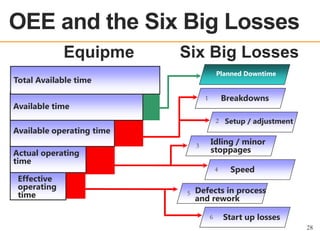
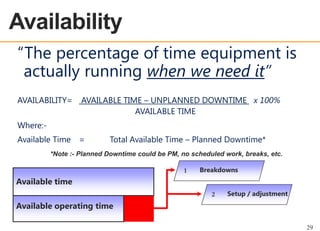
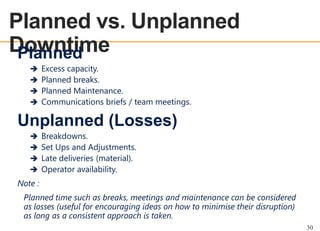
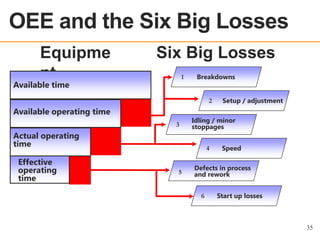
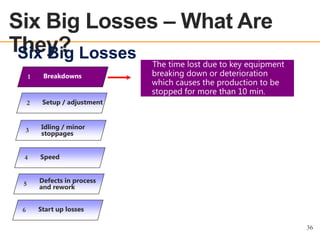
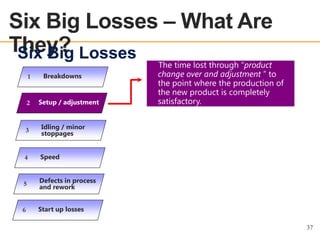
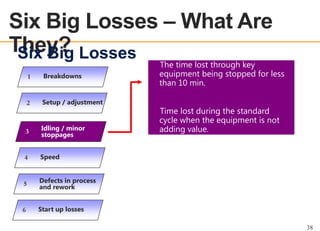
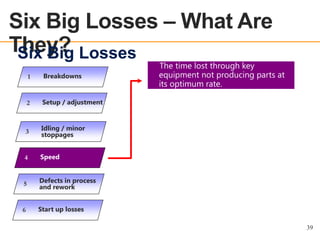
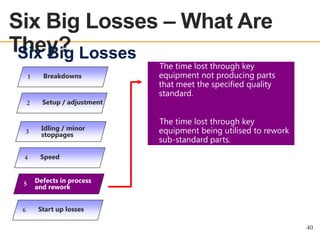
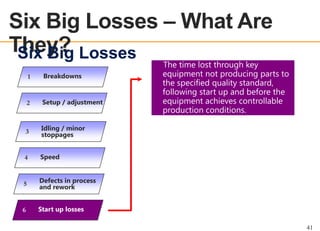

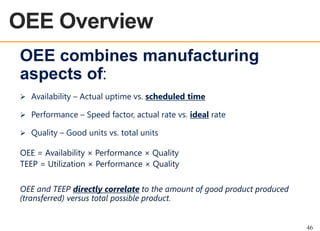
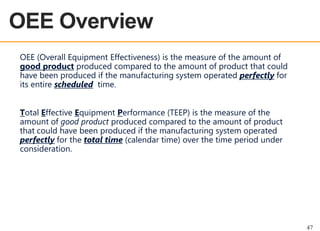
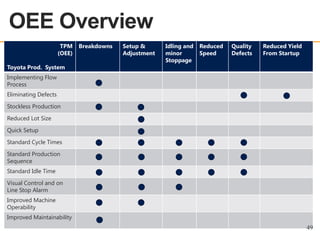
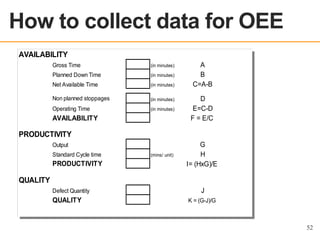
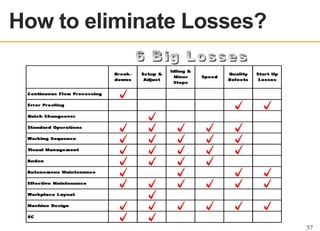


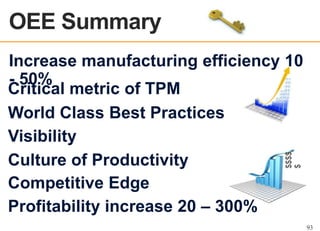


This document provides an overview of Overall Equipment Effectiveness (OEE). OEE is a metric used to measure manufacturing system performance by calculating availability, performance, and quality rates. It identifies the gap between actual and maximum potential output. The document discusses the "six big losses" that reduce OEE - breakdowns, setups, minor stoppages, speed losses, defects, and start-up waste. Tracking OEE can help companies increase productivity 10-50% and profits 20-300% by prioritizing issues and driving continuous improvement.


