Download as PDF, PPTX

![Energy Generating Devices
a- Stack lifetime only, balance of plant ~ 20 yr.
After, http://energy.annualreviews.org/cgi/content/full/24/1/281
Energy Conversion
Method
Efficiency
[%]
Power
Range
[MW]
Lifetime
[Yrs]
Capital
Cost
[$/kW]
Gas Turbines 35-40 10-1000 >20 250-700
Molten-carbonate FC 50-55 1-100 5 a 1000
Thermal (Coal, oil, gas) 25-35 ~1000 >20 1500
Phosphoric Acid FC 40-45 0.2-10 5 a 1500
Hydroelectric 65 0.1-1000 >20 1500
Wind 75 0.1-1 >10 1500
Nuclear 35 ~1000 >20 2000
Magneto Hydrodynamic 40 0.1-100 >10 2000
Solid Oxide FC 50-70 1-100 5 a 1500- 3000
Photovoltaic 10 0.1-1 >10 5000
Least
Expensive
Most
Expensive](https://image.slidesharecdn.com/thesisdefenseschumacherdec2002-180904233817/85/Thesis-Defense-Presentation-ONE-STEP-PROCESS-FOR-SOLID-OXIDE-FUEL-CELL-FABRICATION-4-320.jpg)
![Capital Cost Cutting Required
• Order of magnitude reduction in cost will not be met by optimization
• Will need new processing techniques to meet these goals
http://energy.annualreviews.org/cgi/content/full/24/1/281
Comparison of System Expense
0
1000
2000
3000
4000
5000
Diesel Gas
Turbine
Power Generating Systems
Capital Cost
[$/kW]
United
Technology
Alkaline Fuel Cell
Siemens-
Westinghouse
Tubular
Fuel Cell](https://image.slidesharecdn.com/thesisdefenseschumacherdec2002-180904233817/85/Thesis-Defense-Presentation-ONE-STEP-PROCESS-FOR-SOLID-OXIDE-FUEL-CELL-FABRICATION-6-320.jpg)

![Equipment Limits
0
500
1000
1500
2000
2500
3000
0 2000 4000 6000 8000 10 000 12 000
Pressure [psi]
Temperature[C]
High Pressure RegimeModerate Pressure Regime
Maximum HP Temperature
Maximum
Graphite
Compressive
Stress](https://image.slidesharecdn.com/thesisdefenseschumacherdec2002-180904233817/85/Thesis-Defense-Presentation-ONE-STEP-PROCESS-FOR-SOLID-OXIDE-FUEL-CELL-FABRICATION-17-320.jpg)
![Chemical Interaction Limits
MP: 1880 C
500
1000
1500
2000
2500
3000
Temperature[C]
ElectrolyteCathode Anode Interconnect
La
2
Zr
2
O
7
Formation
Mn
+2
Diffusion NiCrO
4
Formation
MP: 2660 C
MP: 1453 C
MP: 2510 C
MP: 1990 C](https://image.slidesharecdn.com/thesisdefenseschumacherdec2002-180904233817/85/Thesis-Defense-Presentation-ONE-STEP-PROCESS-FOR-SOLID-OXIDE-FUEL-CELL-FABRICATION-18-320.jpg)
![Established Sintering Cycles
500
700
900
1100
1300
1500
Temperature[C]
YSZ Air Sintered
Monolithic Fabrication Temperature
Interconnect
Nano YSZ Air Sintered
Ni 98% Density
NiO 57% Density
LSM 80% Density
500
700
900
1100
1300
1500
Temperature[C]
ElectrolyteCathode Anode
YSZ Air Sintered
Monolithic Fabrication Temperature
Nano YSZ Air Sintered
Ni 98% Density
NiO 57% Density
LSM 80% Density](https://image.slidesharecdn.com/thesisdefenseschumacherdec2002-180904233817/85/Thesis-Defense-Presentation-ONE-STEP-PROCESS-FOR-SOLID-OXIDE-FUEL-CELL-FABRICATION-19-320.jpg)

![1
10
100
1000
10000
100000
1000000
10000000
0.01 0.1 1 10 100 1000
Particle Radius [um]
Pressure[psi]
90% of Densification due to Applied Pressure 90% of Densification due to Particle Size
Pressure Dominated
Densification
Particle Size Dominated
Densification
Unity Line
RP
C
C a
rgySurfaceEne
essureApplied
Pr
RP
kT
DF
dt
dV A
**](https://image.slidesharecdn.com/thesisdefenseschumacherdec2002-180904233817/85/Thesis-Defense-Presentation-ONE-STEP-PROCESS-FOR-SOLID-OXIDE-FUEL-CELL-FABRICATION-25-320.jpg)
![Particle Size / Pressure Regime
RP
CCF
a
essureAppliedessureAppliedceDrivingForEquivalent
PrPr
Applied
Pressure
[psi]
Particle Size Radius [m]
0.01 0.1 1 10 100 1000
10 000
55 596 14 560 10 456 10 046 10 005 10 000
5000
50 596 9560 5456 5046 5005 5000
2500
48 096 7060 2956 2546 2505 2500
1000
46 596 5560 1456 1046 1005 1000
100
45 696 4660 556 145.6 104.6 100.5](https://image.slidesharecdn.com/thesisdefenseschumacherdec2002-180904233817/85/Thesis-Defense-Presentation-ONE-STEP-PROCESS-FOR-SOLID-OXIDE-FUEL-CELL-FABRICATION-26-320.jpg)
![Equilibrium Oxygen Partial Pressures
1E-30
1E-24
1E-18
1E-12
1E-06
1
500 600 700 800 900 1000 1100 1200 1300 1400 1500
Temperature [C]
PartialPressureofOxygen
2Ni + O2(g) = 2NiO 2CO(g) + O2(g) = 2CO2(g) 2H2(g) + O2(g) = 2H2O(g)
NiO Stable
Ni Stable
P O2 = 1.17 x10 -9 (1100 C) P O2 = 3.55 x10 -13 (1100 C) P O2 = 8.70 x10 -17 (1100 C)](https://image.slidesharecdn.com/thesisdefenseschumacherdec2002-180904233817/85/Thesis-Defense-Presentation-ONE-STEP-PROCESS-FOR-SOLID-OXIDE-FUEL-CELL-FABRICATION-31-320.jpg)
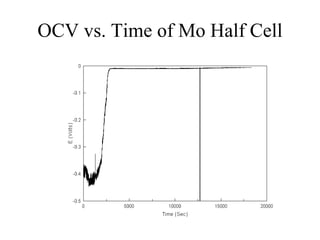
![Anode 2 [Mo-YSZ] / Electrolyte
Interface
YSZ Electrolyte
Mo/ YSZ Anode
Poor Adherence
_____
50 m
•Excessive Porosity
•Poor Adherence](https://image.slidesharecdn.com/thesisdefenseschumacherdec2002-180904233817/85/Thesis-Defense-Presentation-ONE-STEP-PROCESS-FOR-SOLID-OXIDE-FUEL-CELL-FABRICATION-38-320.jpg)
![Anode 3 [Mo-3wt% Ni] / Electrolyte
Interface
_______
50 m
YSZ Electrolyte
Mo/ YSZ Anode
Adequate Adherence](https://image.slidesharecdn.com/thesisdefenseschumacherdec2002-180904233817/85/Thesis-Defense-Presentation-ONE-STEP-PROCESS-FOR-SOLID-OXIDE-FUEL-CELL-FABRICATION-42-320.jpg)


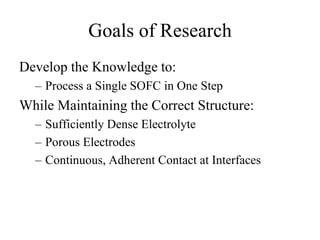
The document presents a thesis defense on a one-step process for solid oxide fuel cell (SOFC) fabrication, outlining the motivation, experimental background, results, and future work. SOFCs are highlighted as efficient and pollution-free power sources with various advantages, including flexible fuel options and scalability. The research successfully developed a method to achieve dense electrolytes and porous electrodes while maintaining structural integrity, paving the way for further testing and potential production scaling.