Download to read offline
![3
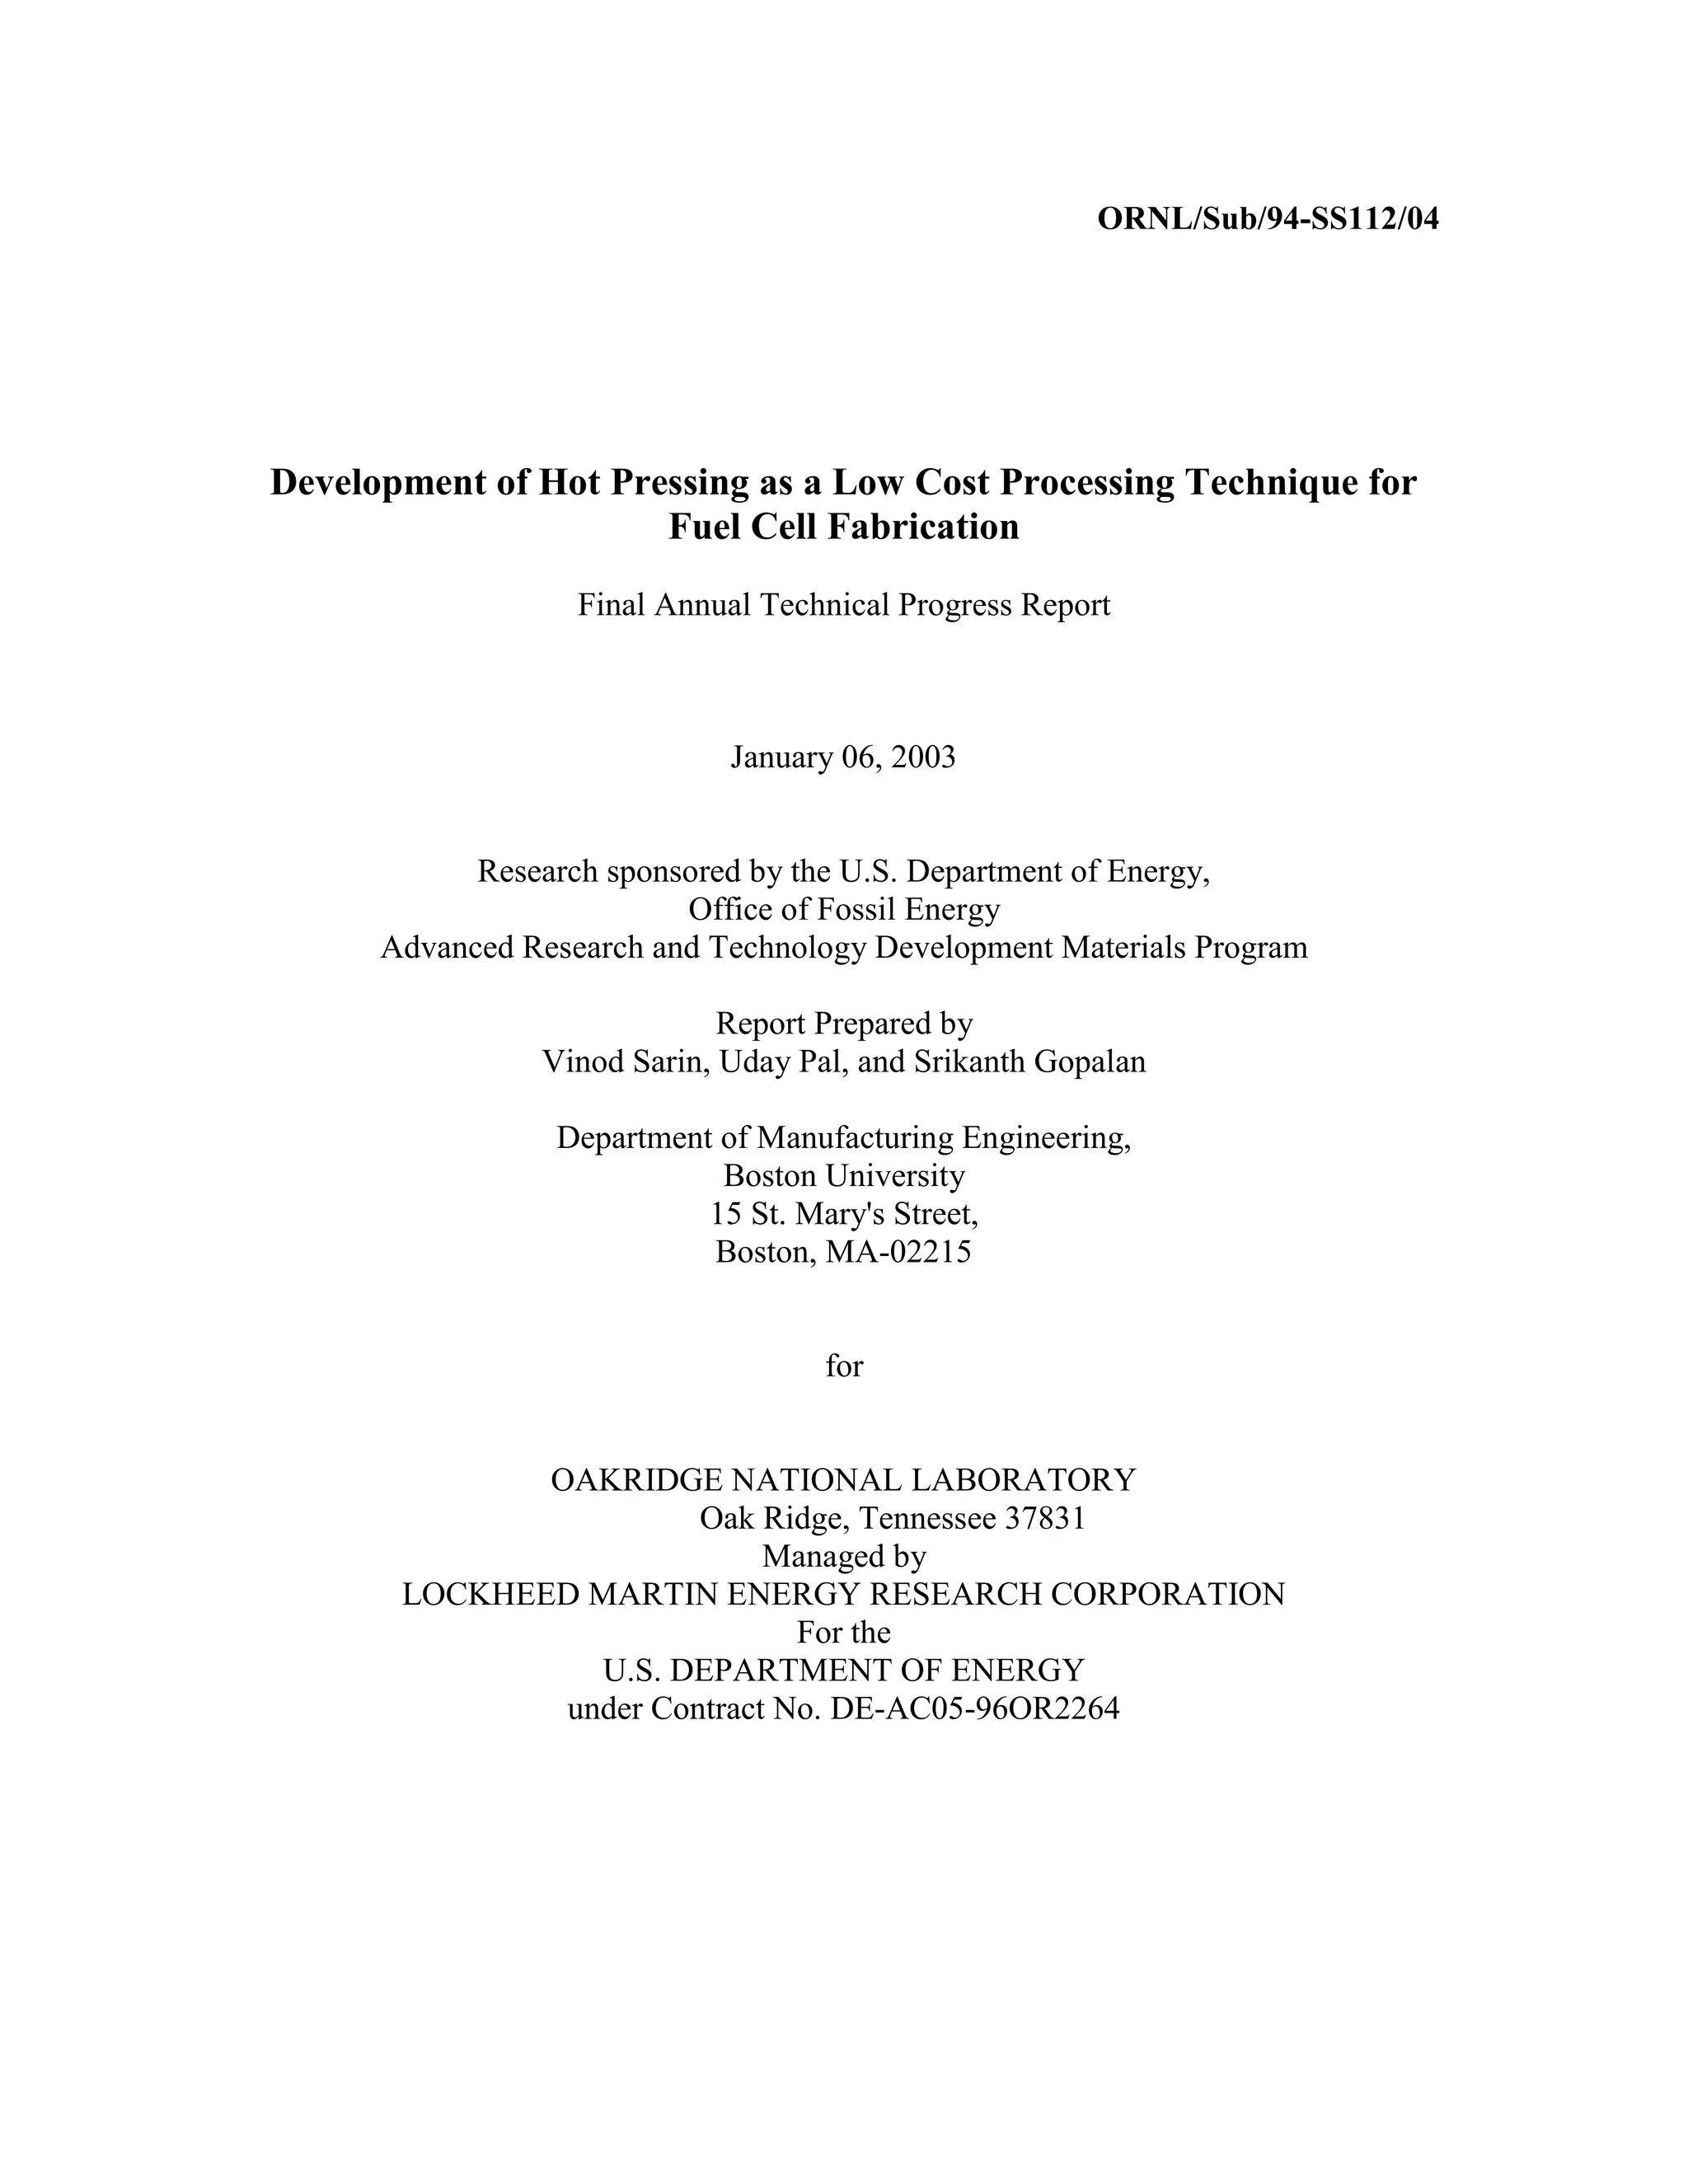
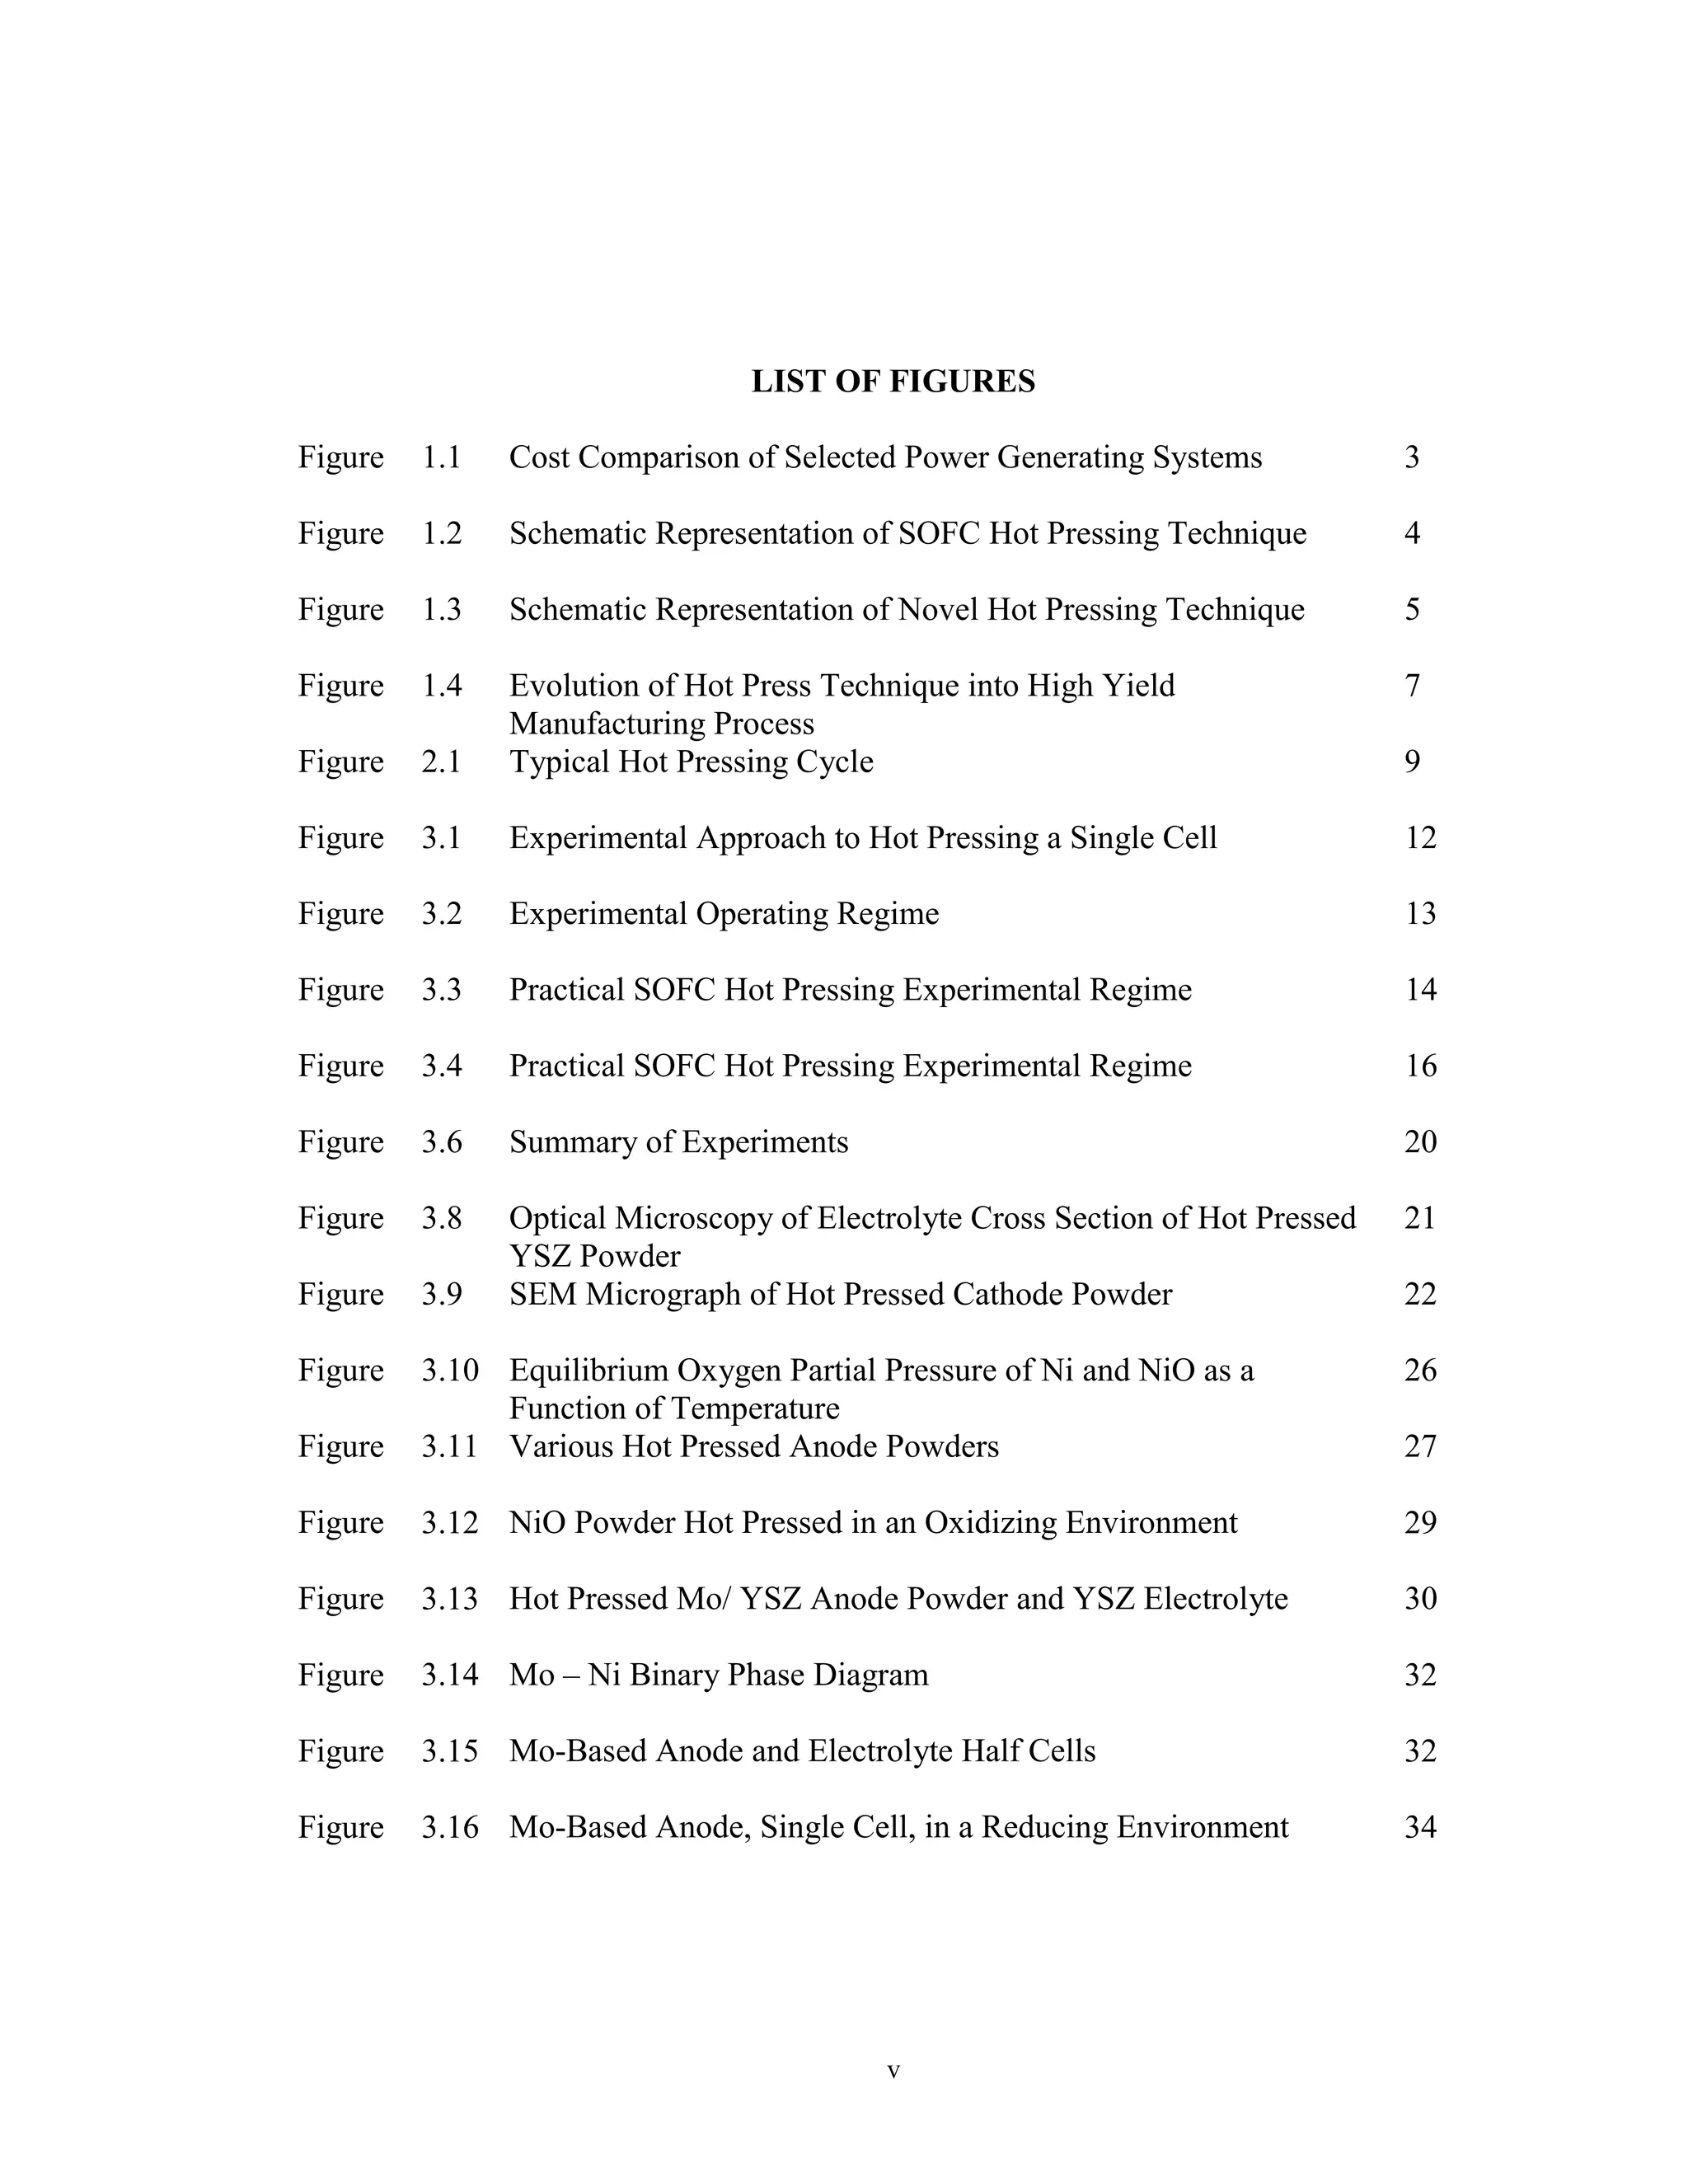
Figure 1.1: Cost Comparison of Selected Power Generating Systems [13].
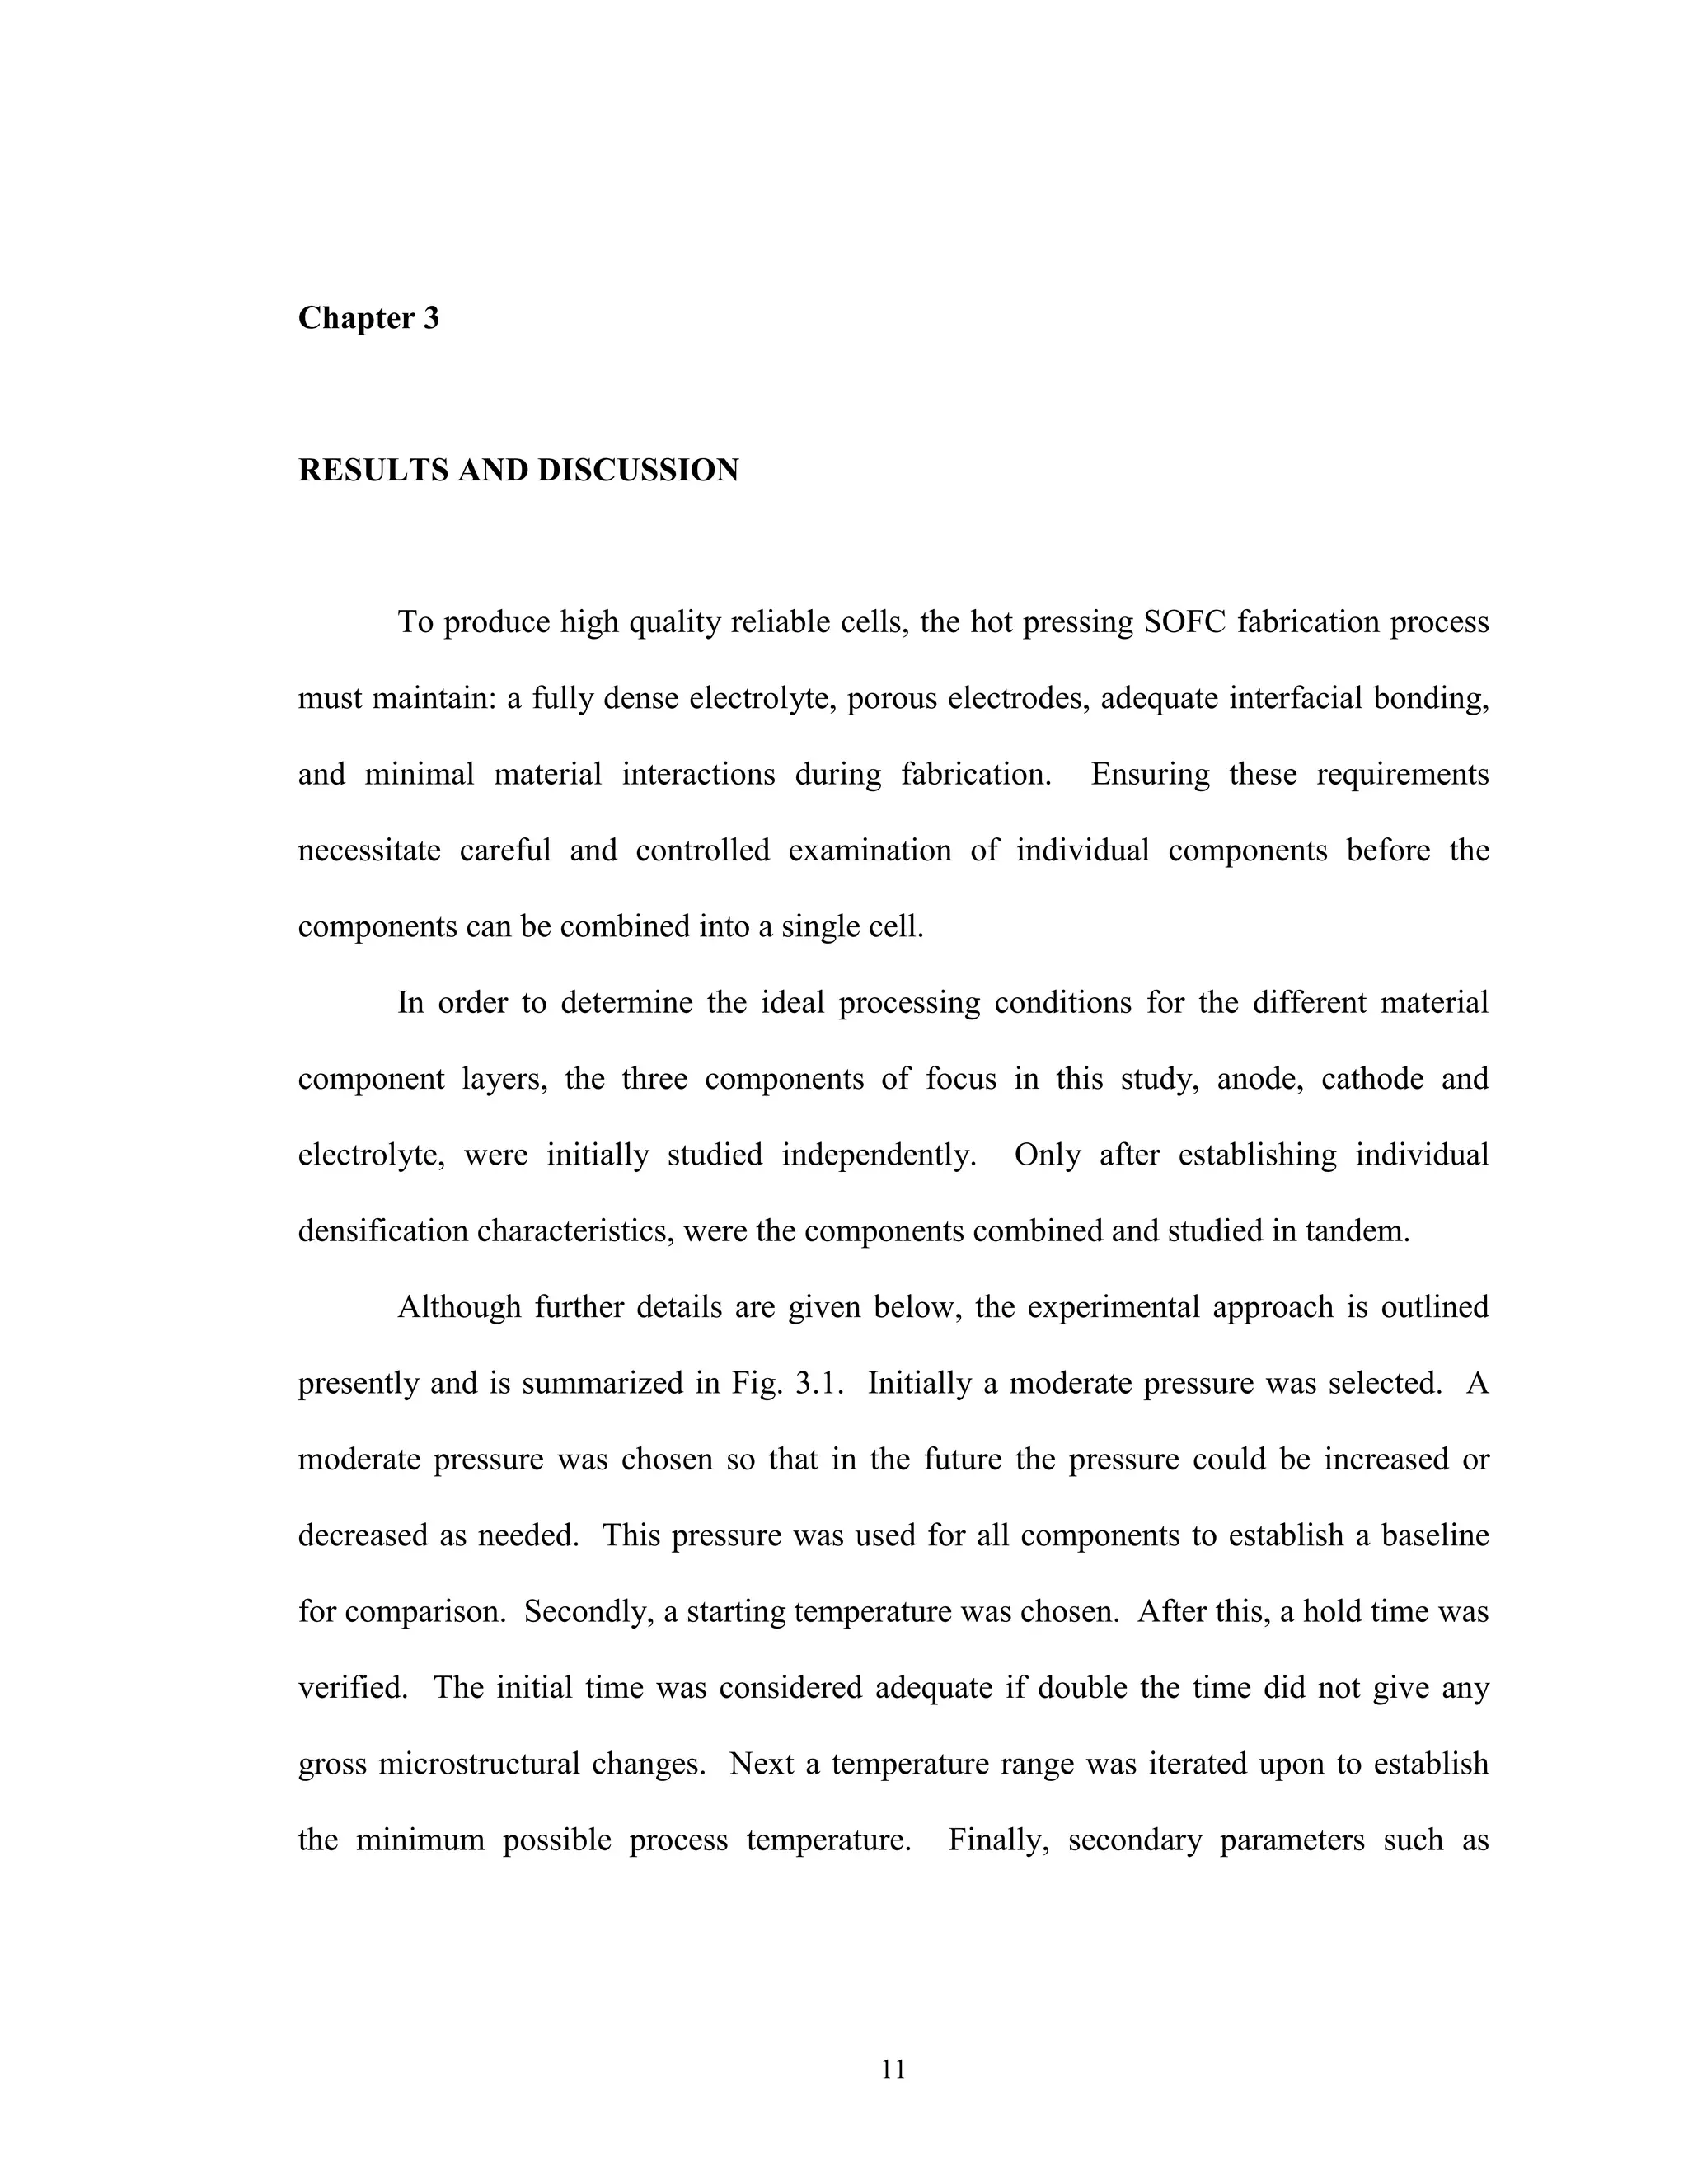
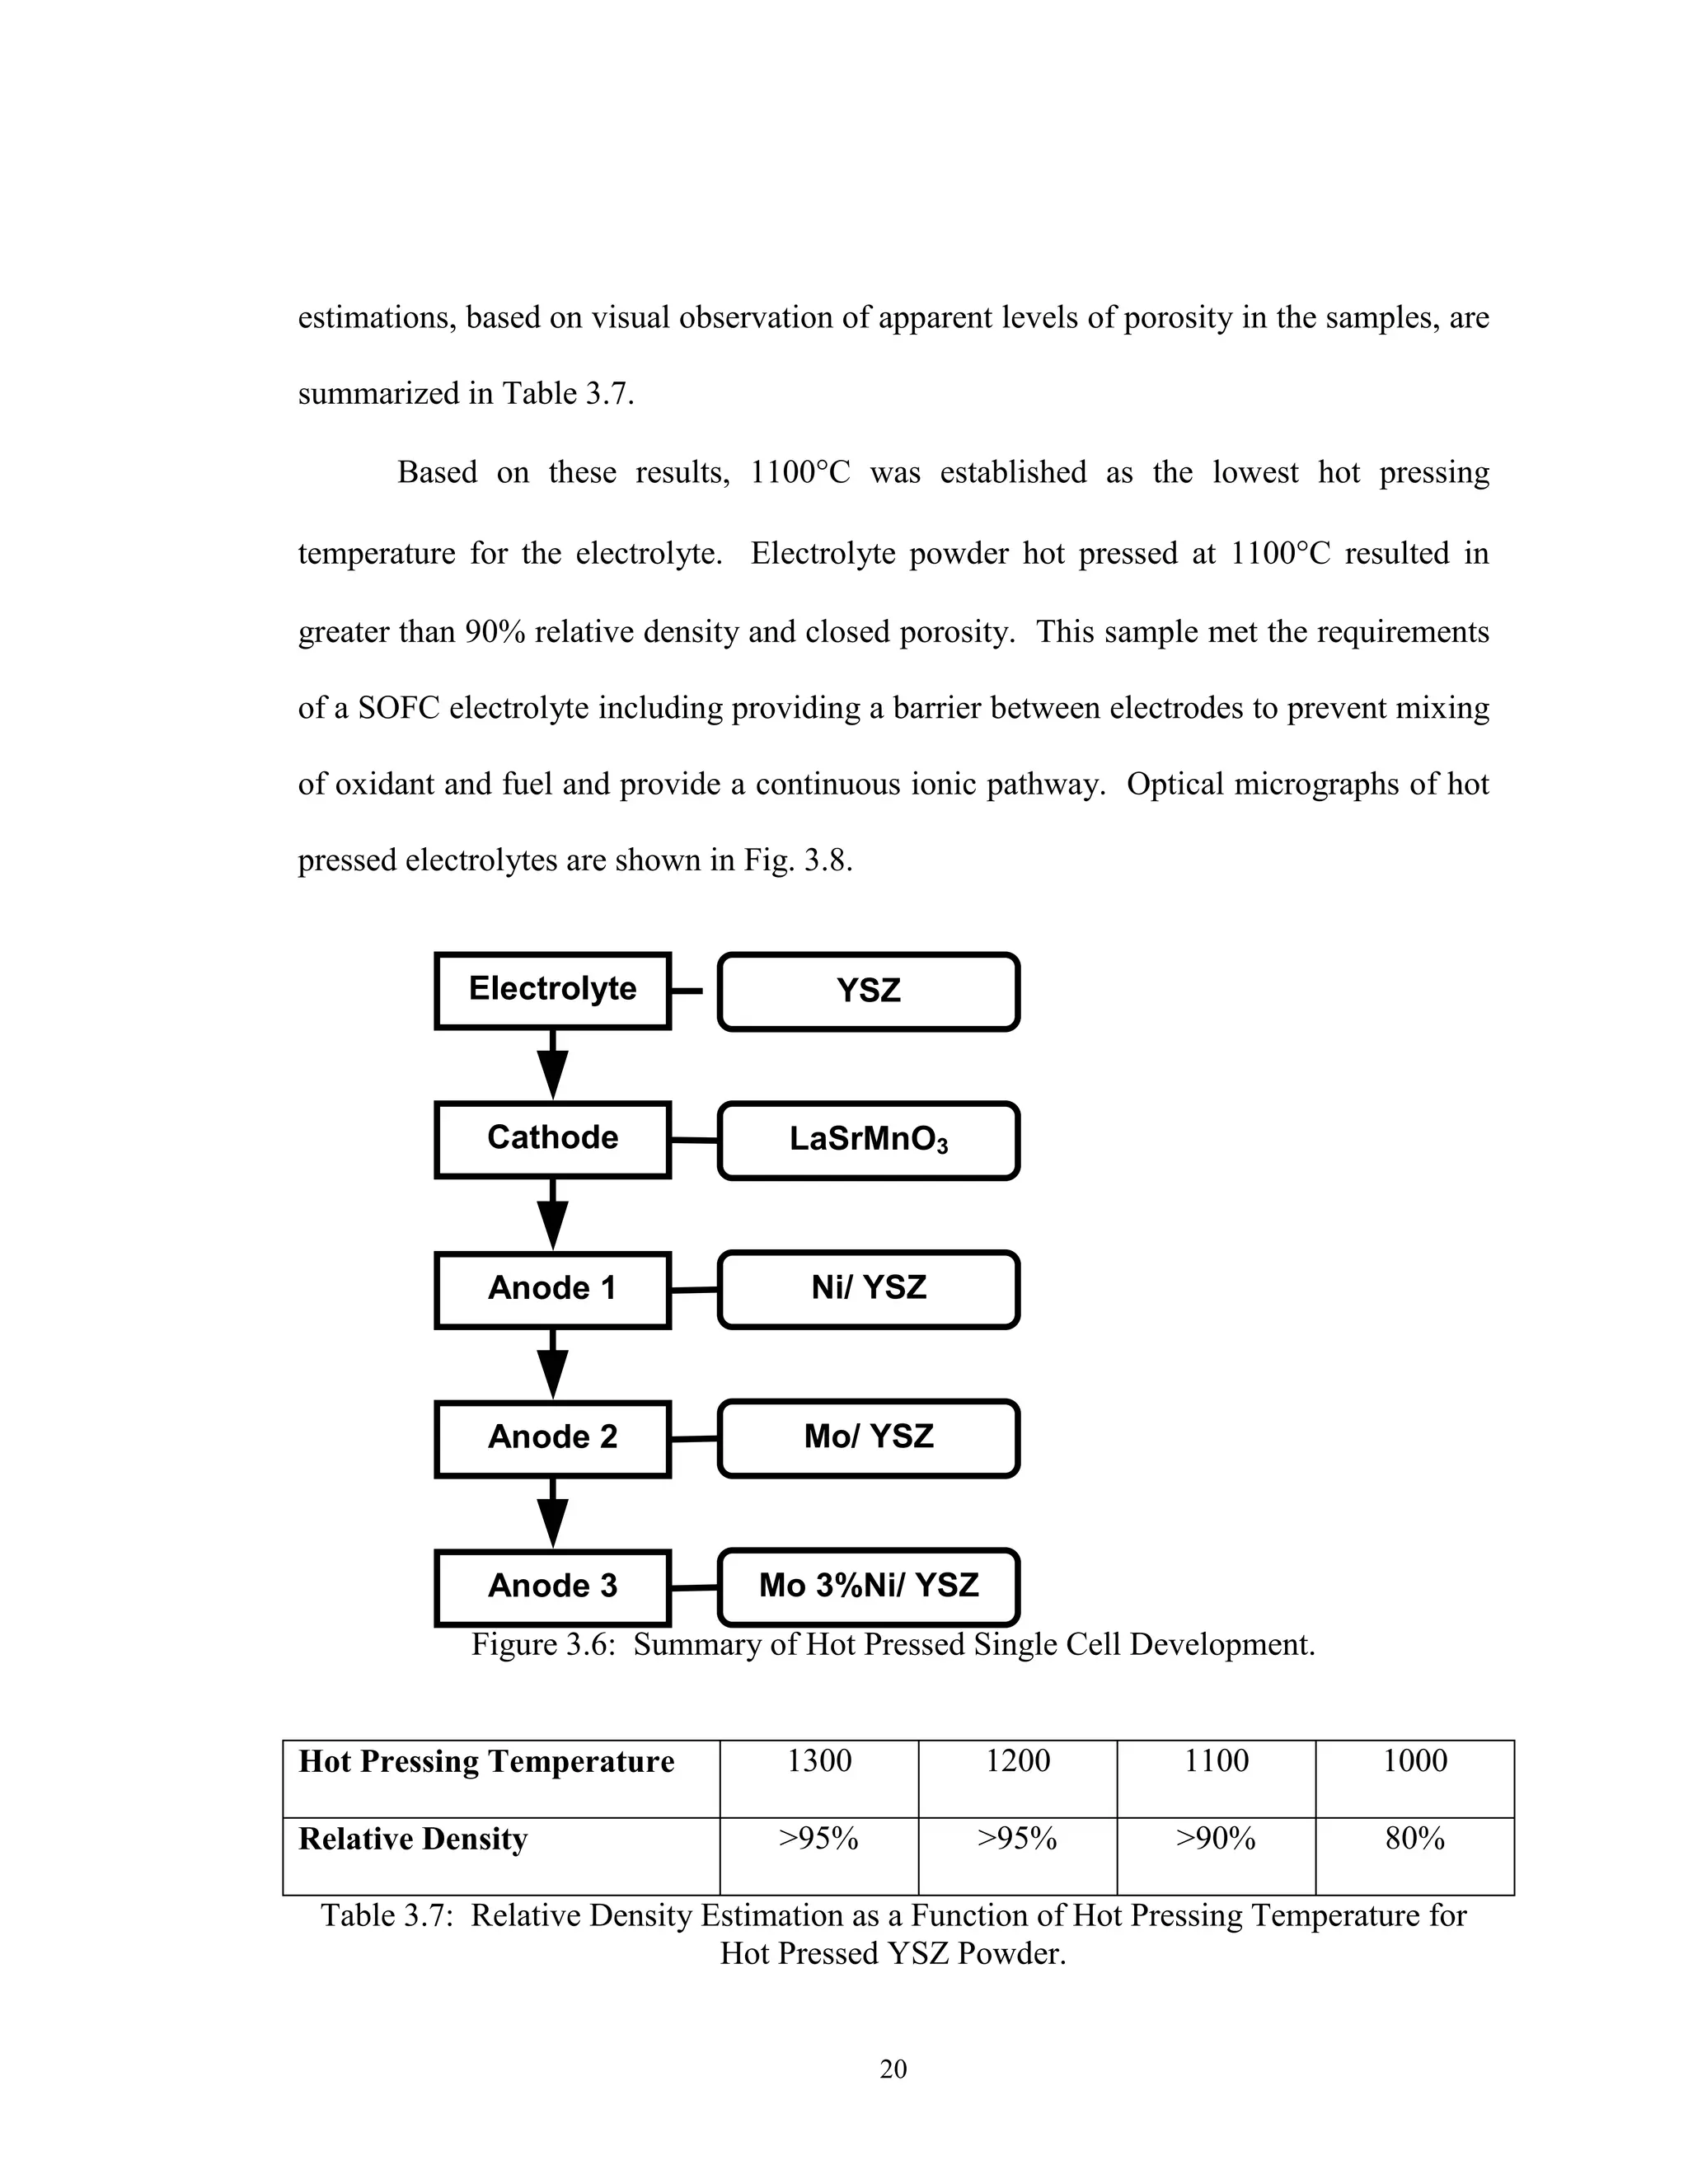
Some of the most energy intensive and expensive fabrication processes, for any
SOFC stack design, are the high temperature sintering steps. Batch processes, in the
tubular and planar designs, use repeated thermal cycling steps to sinter successive layers
upon previous ones. The monolithic design improves upon this approach by co-firing all
layers in a cell in one step, thereby eliminating the batch processing. However, the
monolithic design incorporates extensive post process non-destructive testing and
evaluation due to the complex geometries and multiple shrinkage rates encountered
during processing. This extraneous post testing substantially increases the overall
fabrication cost.
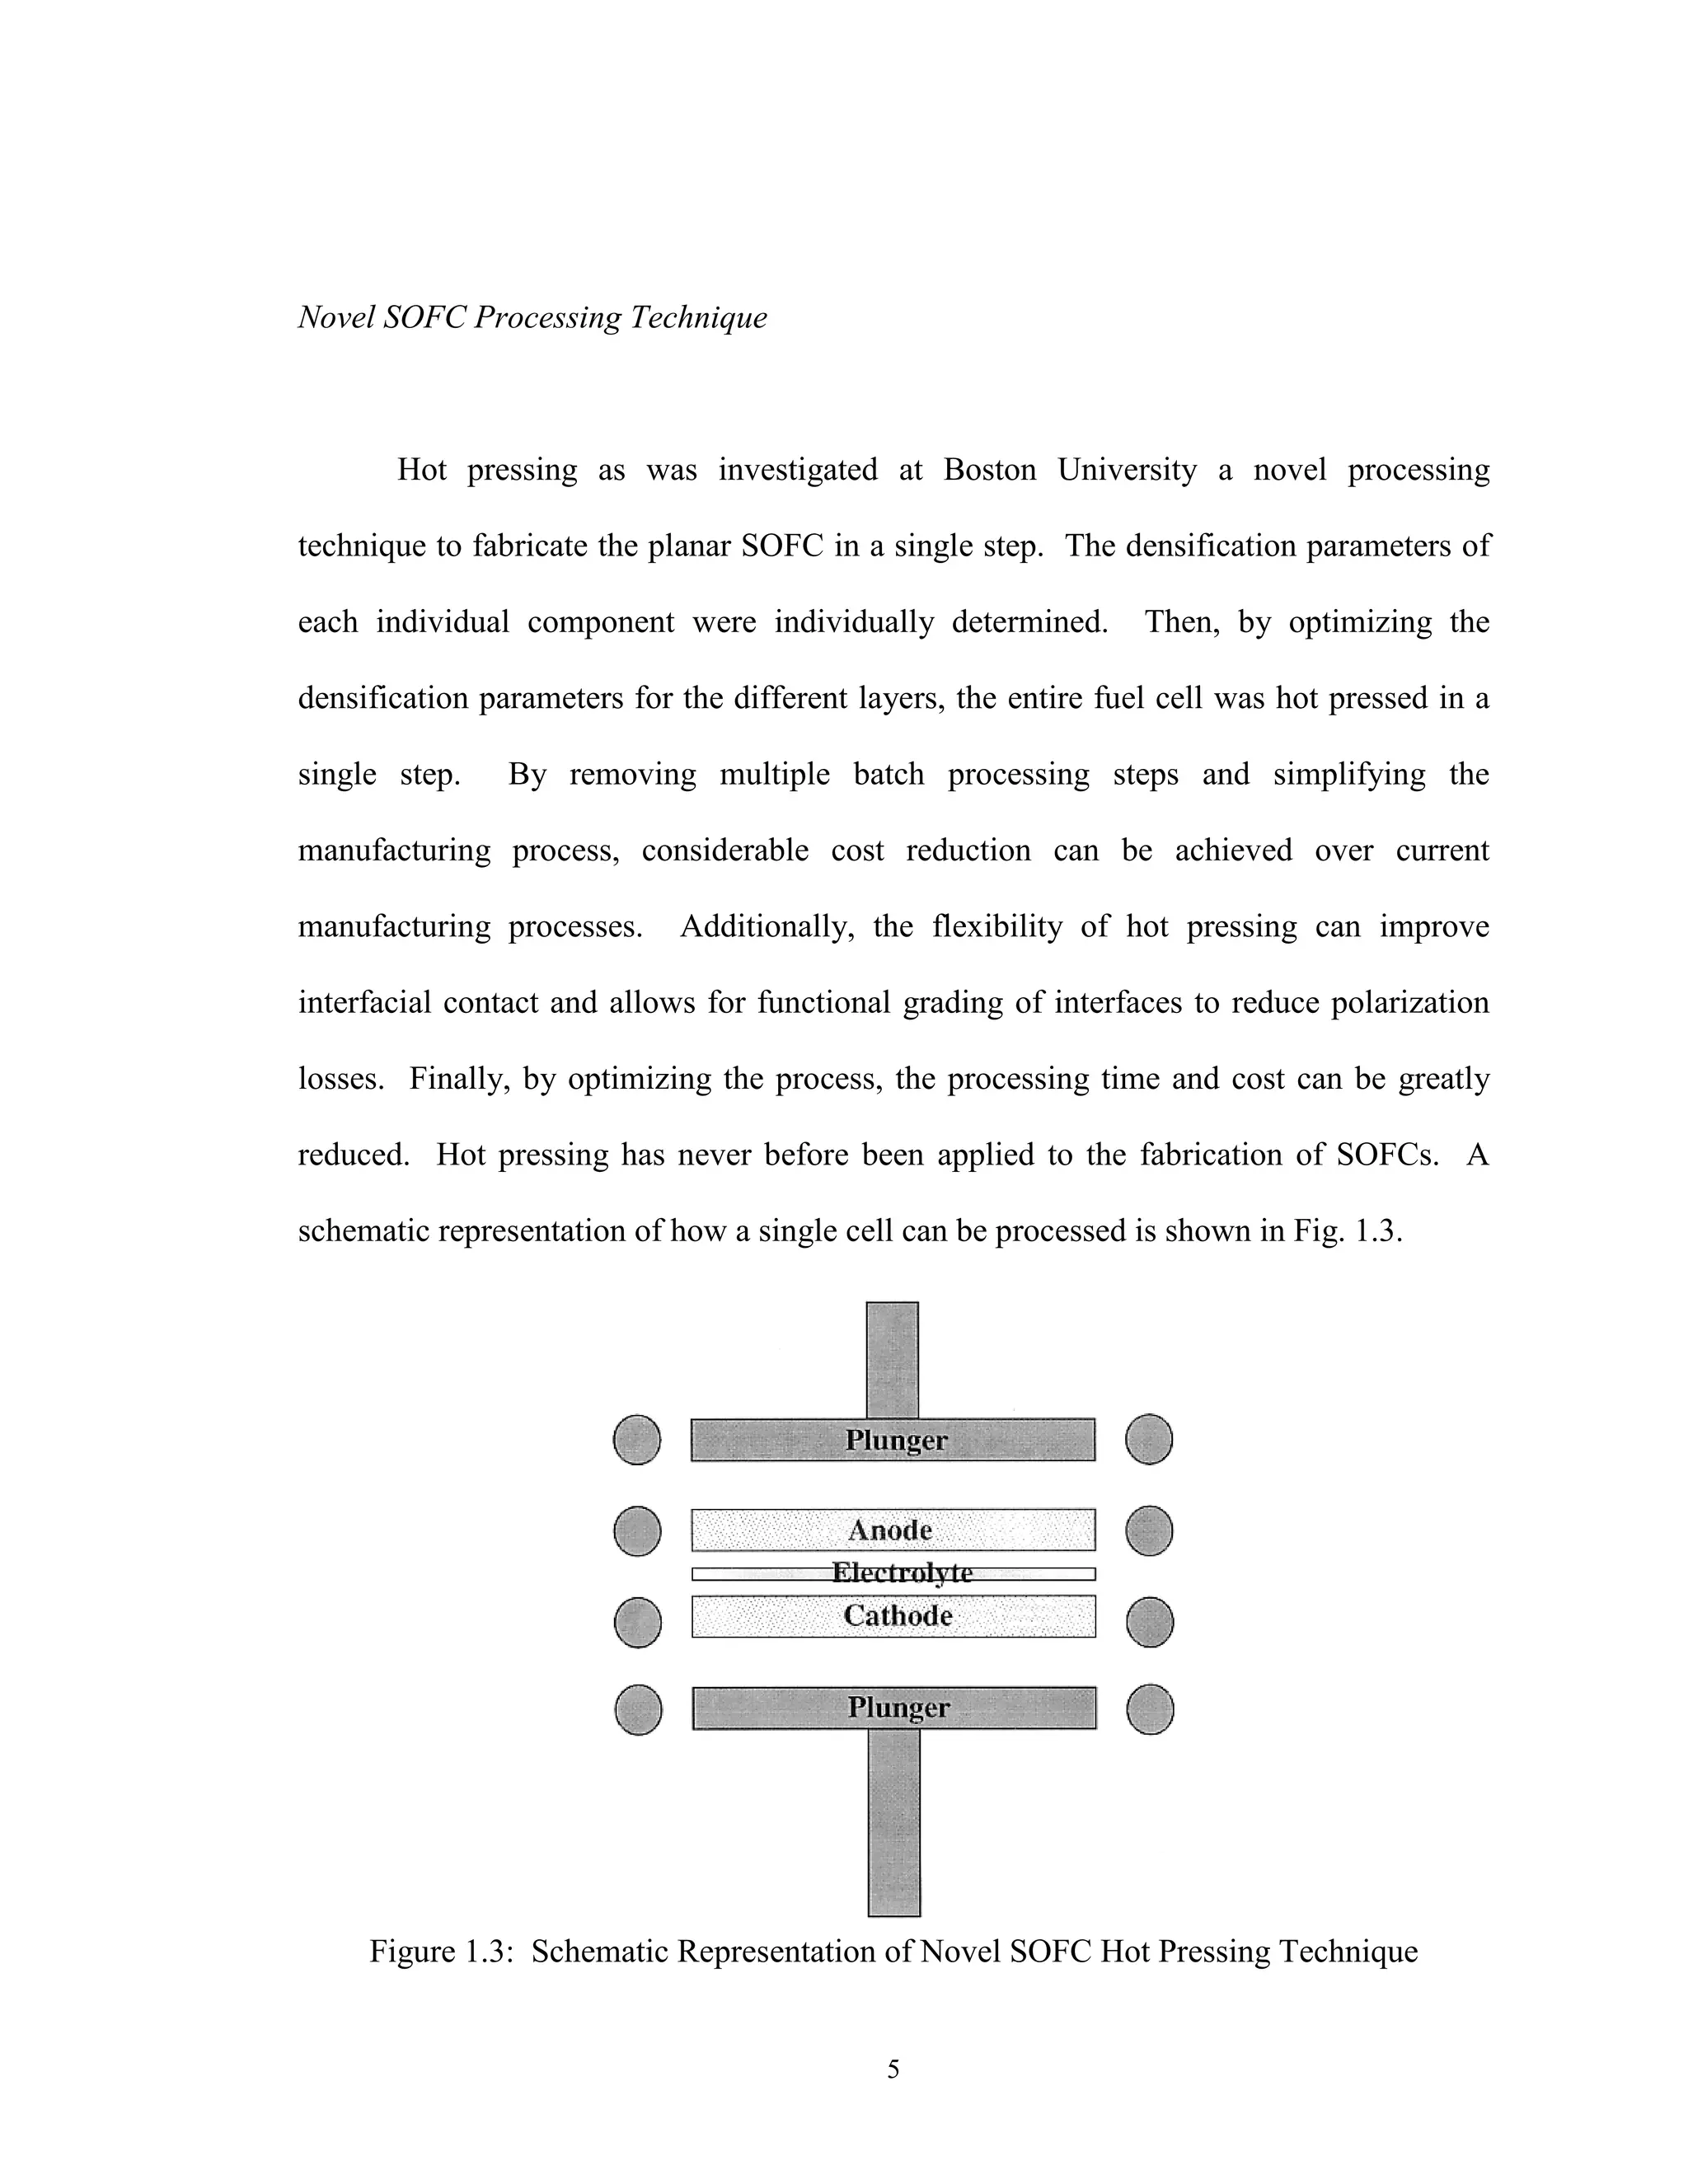
Therefore an improved fabrication process is desired, which would reduce or
remove the number of separate batch processes required to produce a SOFC without
adding extreme post process testing.
This is the approach currently being undertaken at Boston University (BU).
Researchers at BU have shown preliminary results using an alternative ceramic](https://image.slidesharecdn.com/sofcsingle-stepjan062003-180904234325/75/ORNL-Sub-94-SS112-04-Development-of-Hot-Pressing-as-a-Low-Cost-Processing-Technique-for-Fuel-Cell-Fabrication-8-2048.jpg)
![4
processing technique to eliminate batch, without the added geometrical complexity of the
monolithic design.
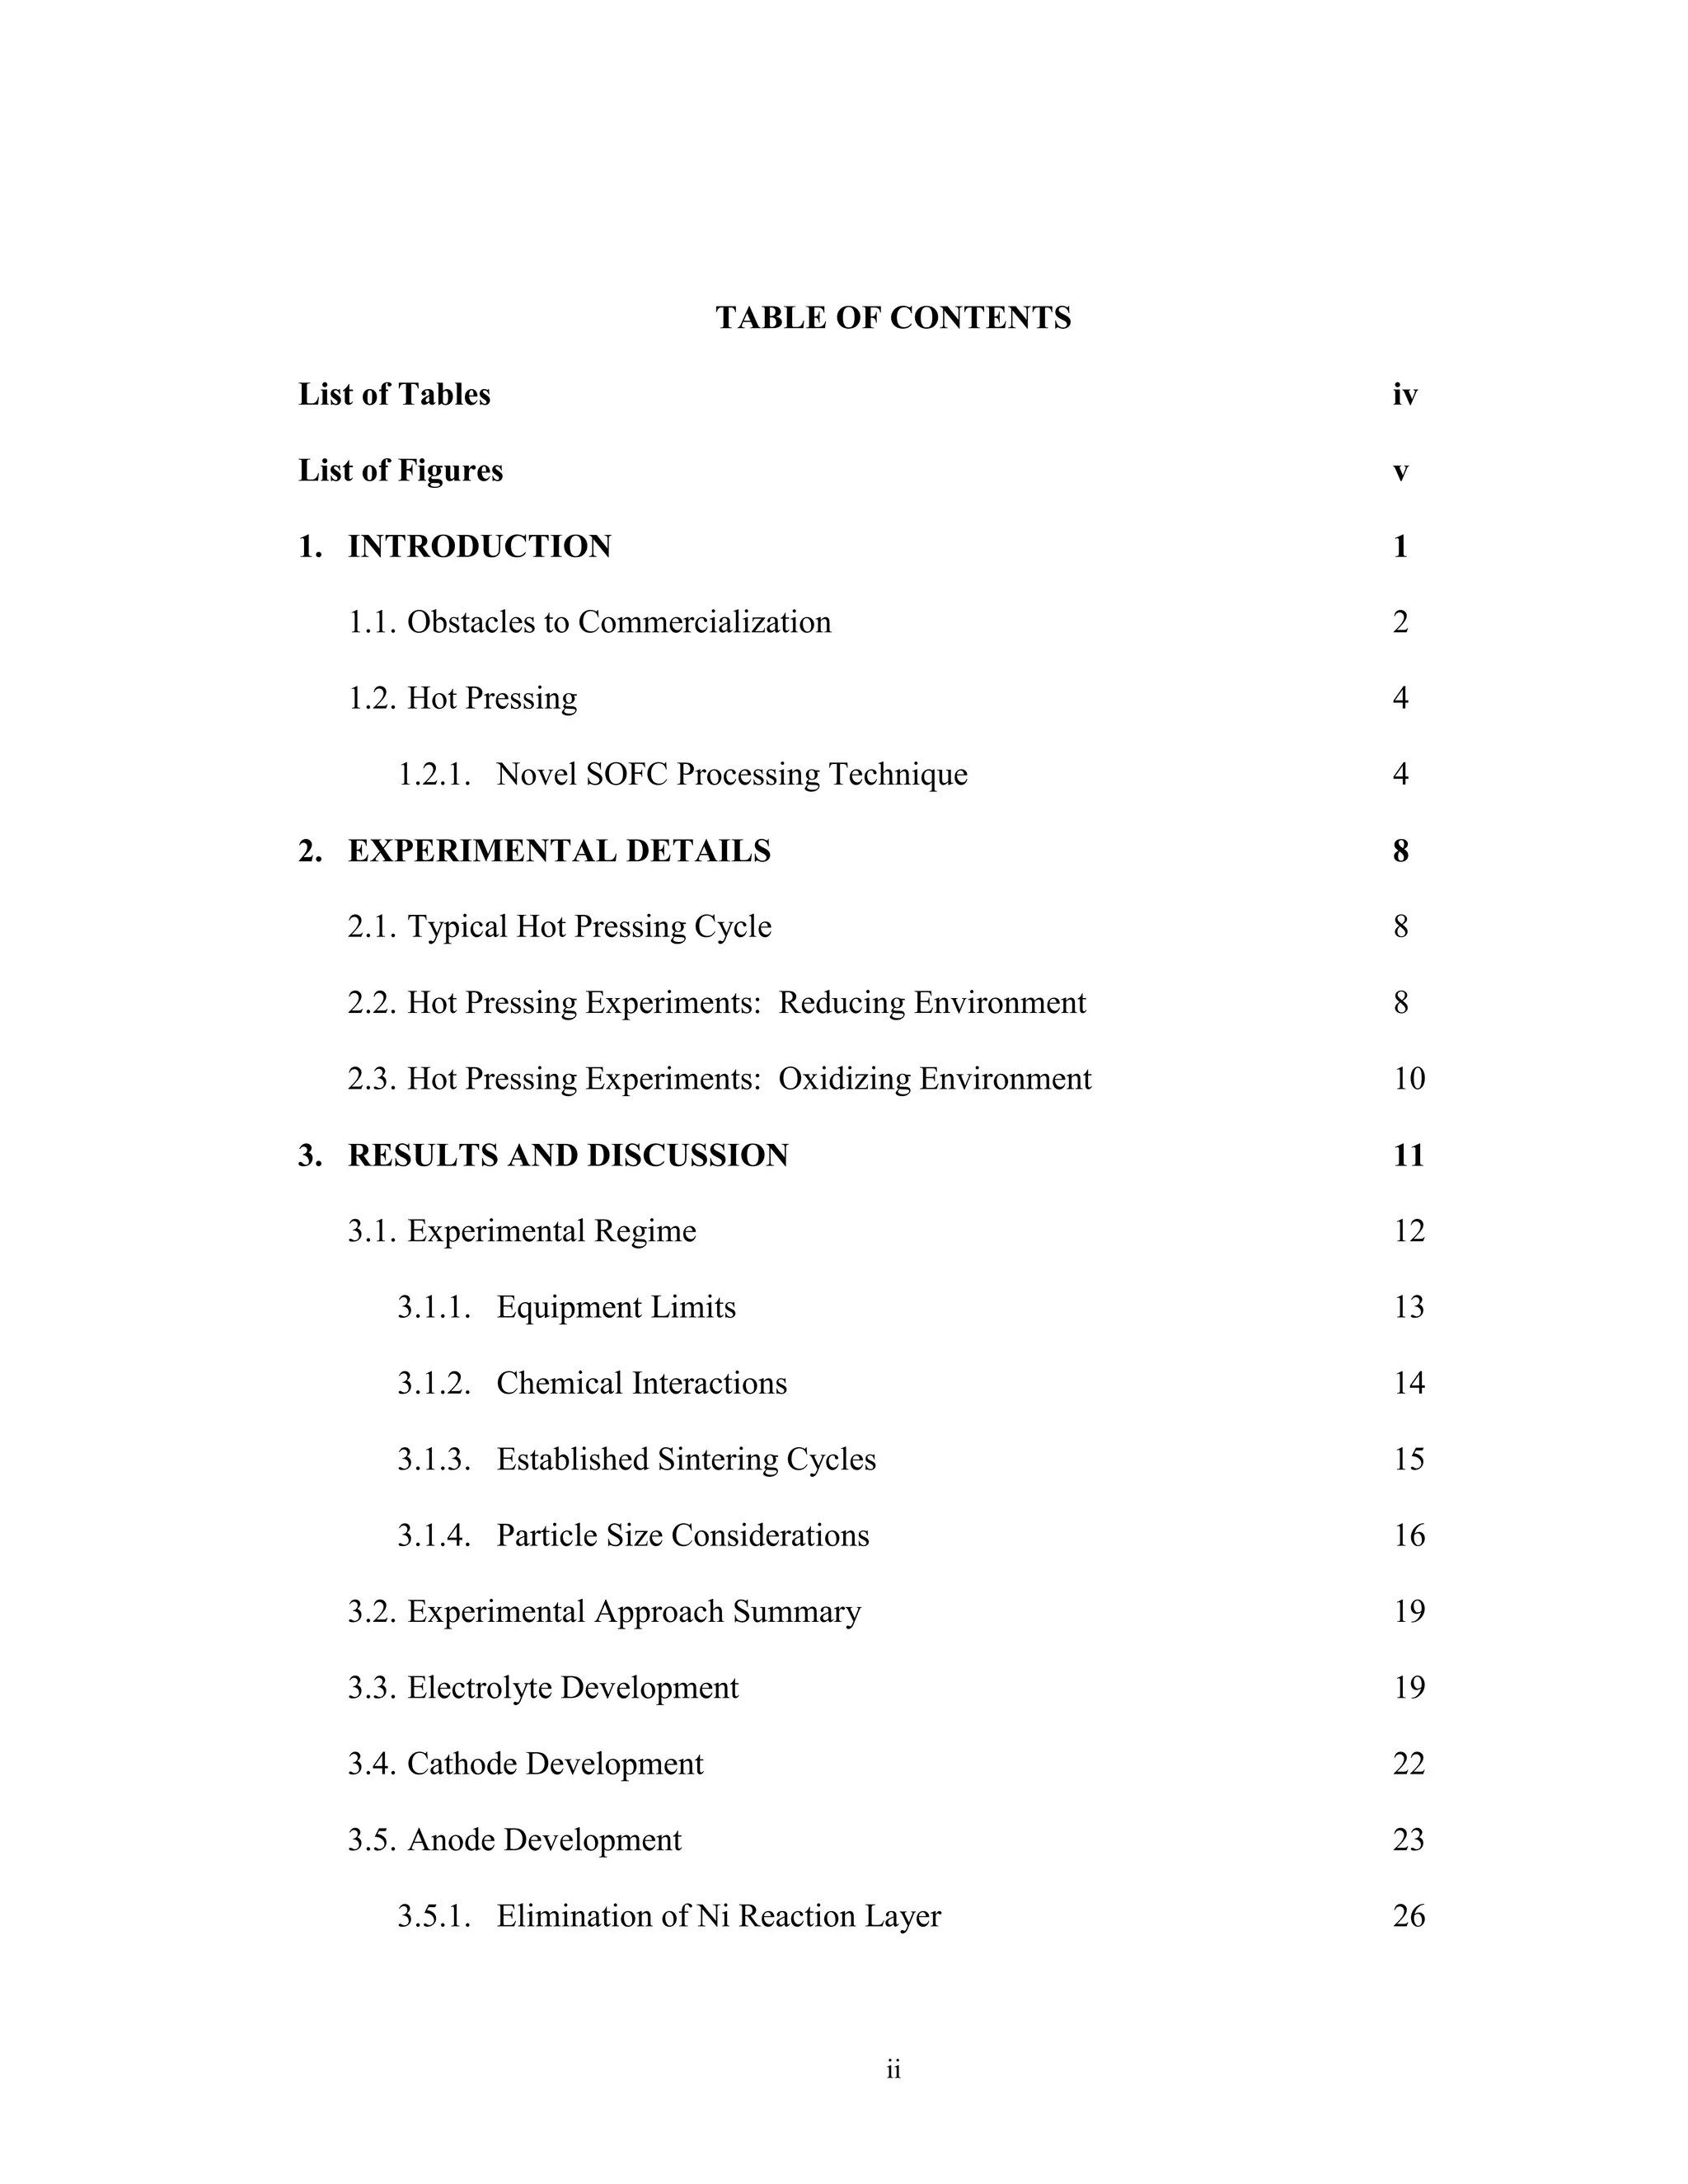
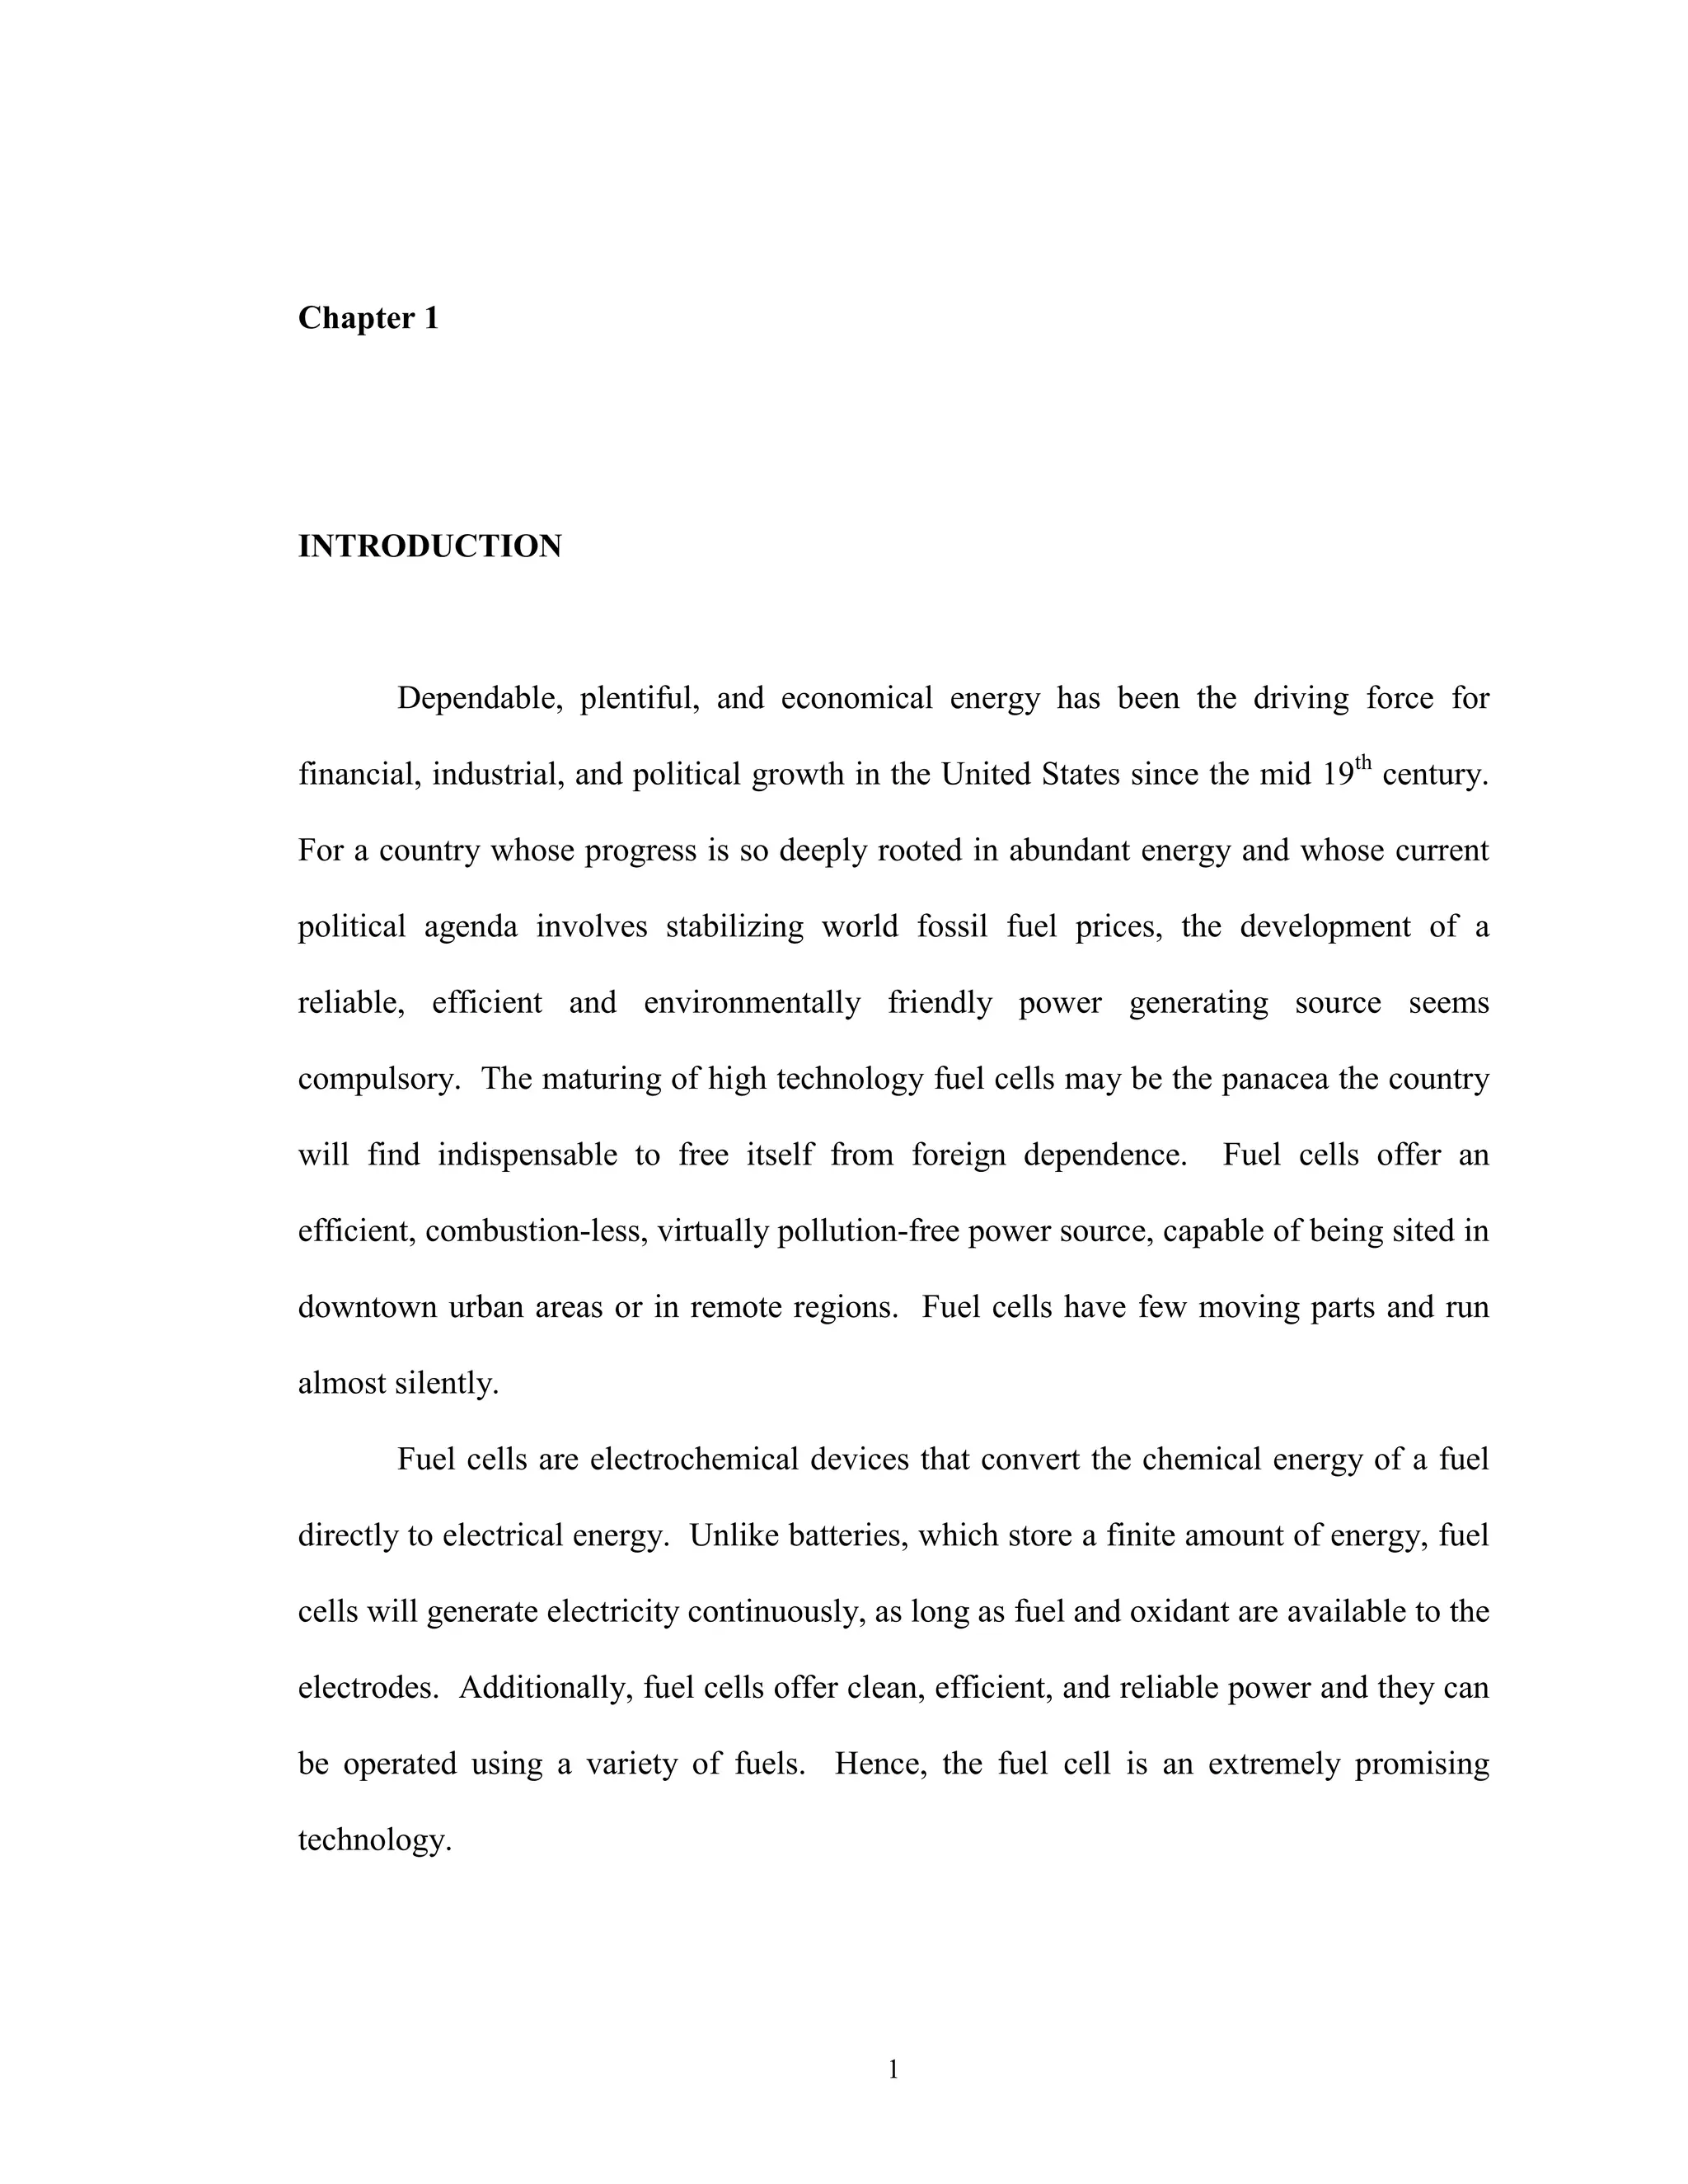
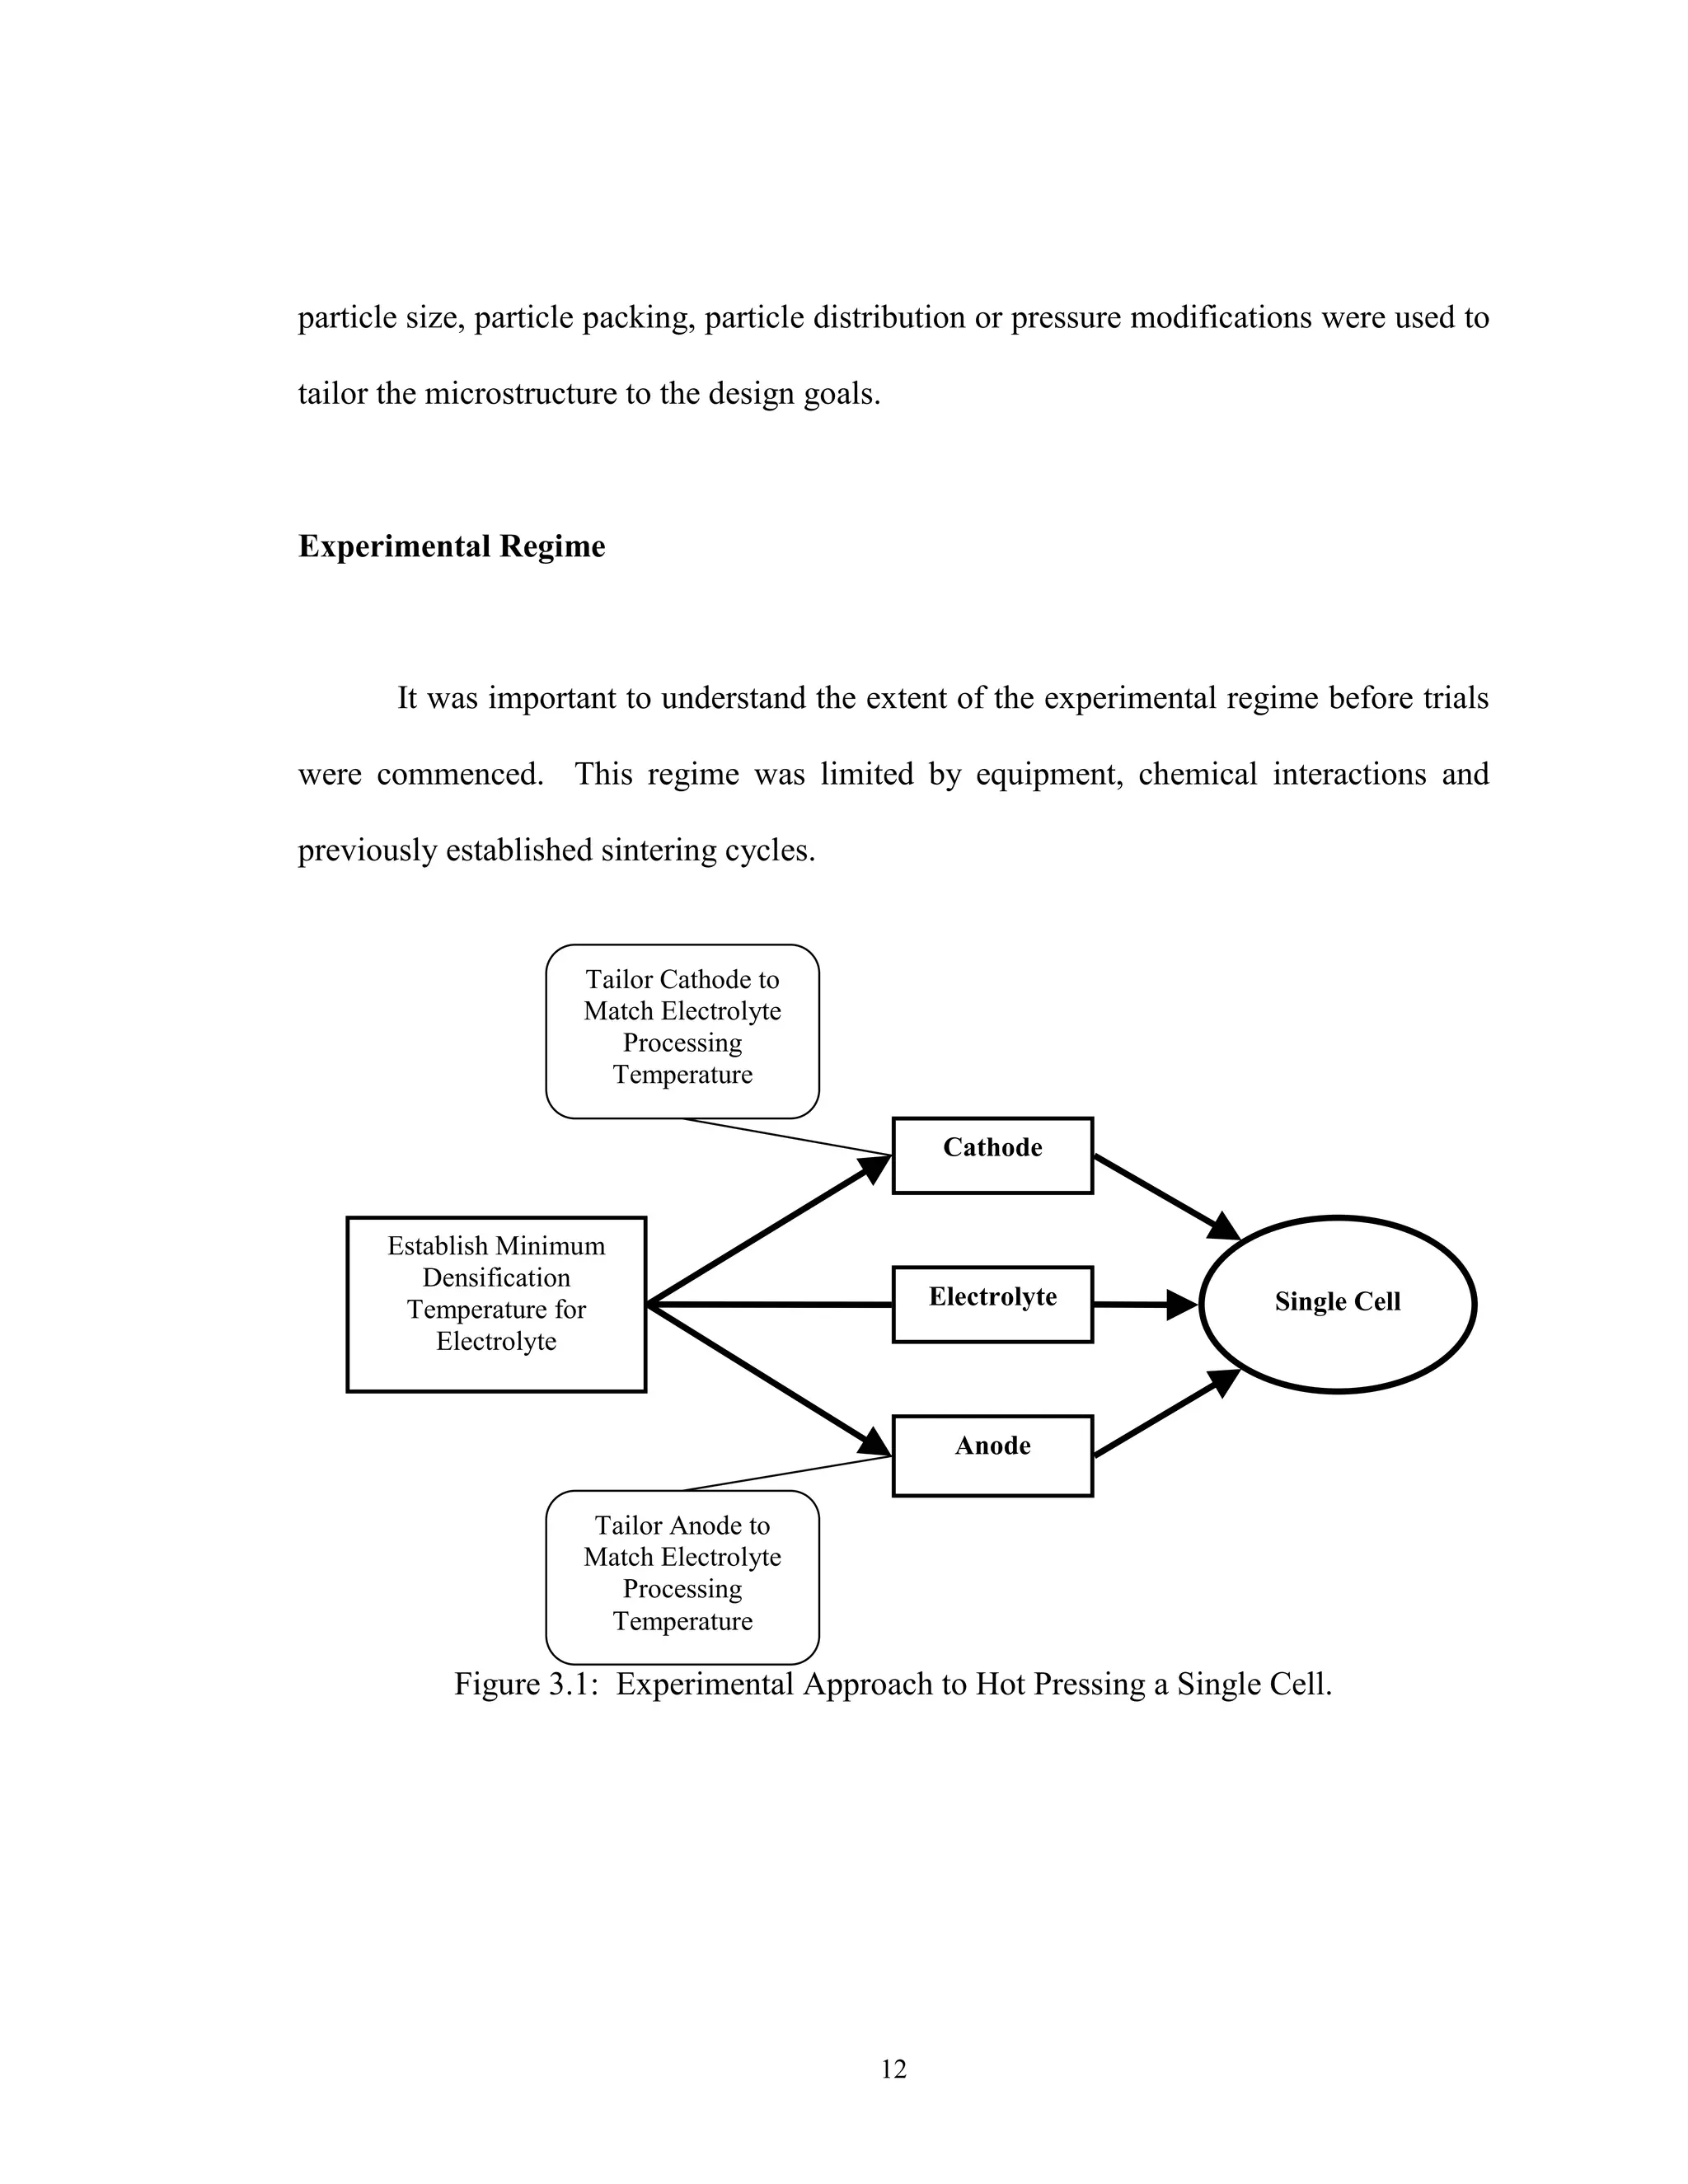
Hot Pressing
Hot pressing is the simultaneous application of elevated temperature and
compressive stress to consolidate fine green pressed powders into partially or fully
sintered components. The technique, shown in Fig. 1.2, was developed for the powder
metallurgy industry and has been successfully applied to ceramic components over the
last several decades [14, 15]. Pressure increases the driving force for densification, in
effect, reducing the processing temperature required for a sintering process. Also, hot
pressing results in smaller overall grain size, more precise control over the microstructure
and the flexibility of functionally grading the ceramic layers.
Figure 1.2: Schematic Representation of SOFC Hot Pressing Technique.](https://image.slidesharecdn.com/sofcsingle-stepjan062003-180904234325/75/ORNL-Sub-94-SS112-04-Development-of-Hot-Pressing-as-a-Low-Cost-Processing-Technique-for-Fuel-Cell-Fabrication-9-2048.jpg)
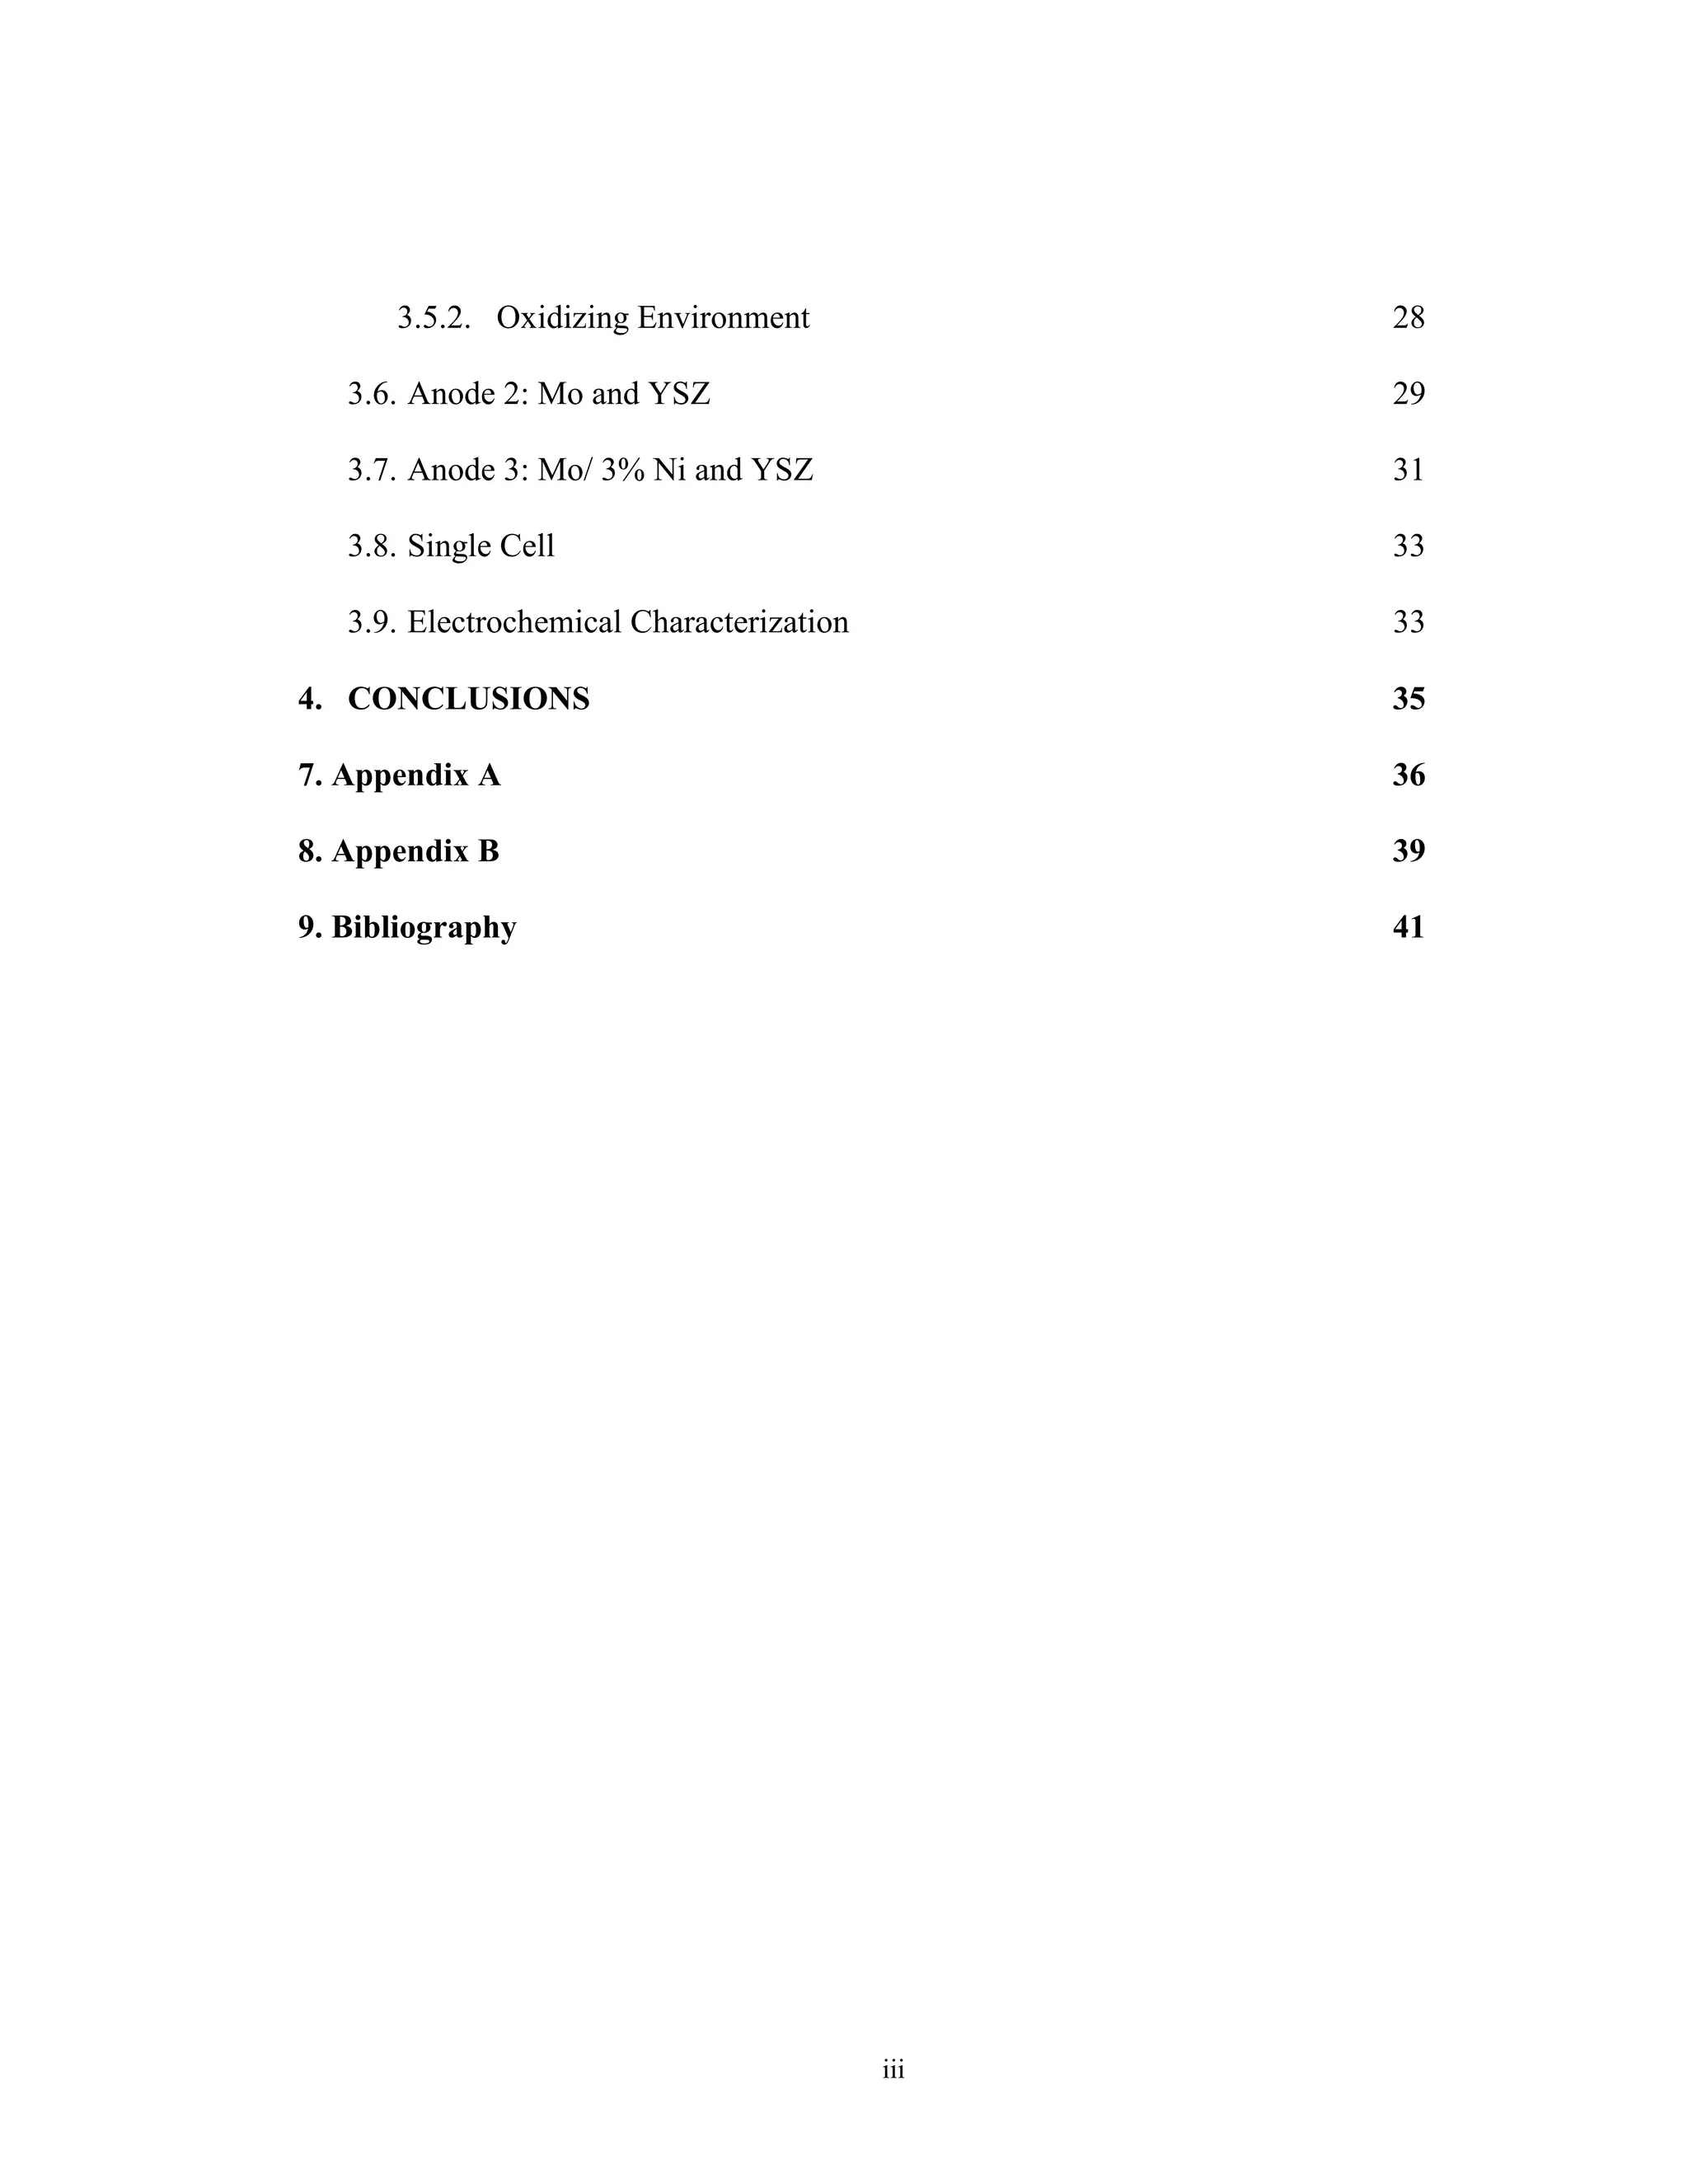
![8
Chapter 2
EXPERIMENTAL DETAILS
Typical Hot Pressing Cycle
The final hot pressed microstructure is controlled by three primary parameters:
temperature, pressure, and time. As shown in the theoretical section, temperature,
pressure, and time have decreasing amounts of effectiveness in changing the initial
microstructure.
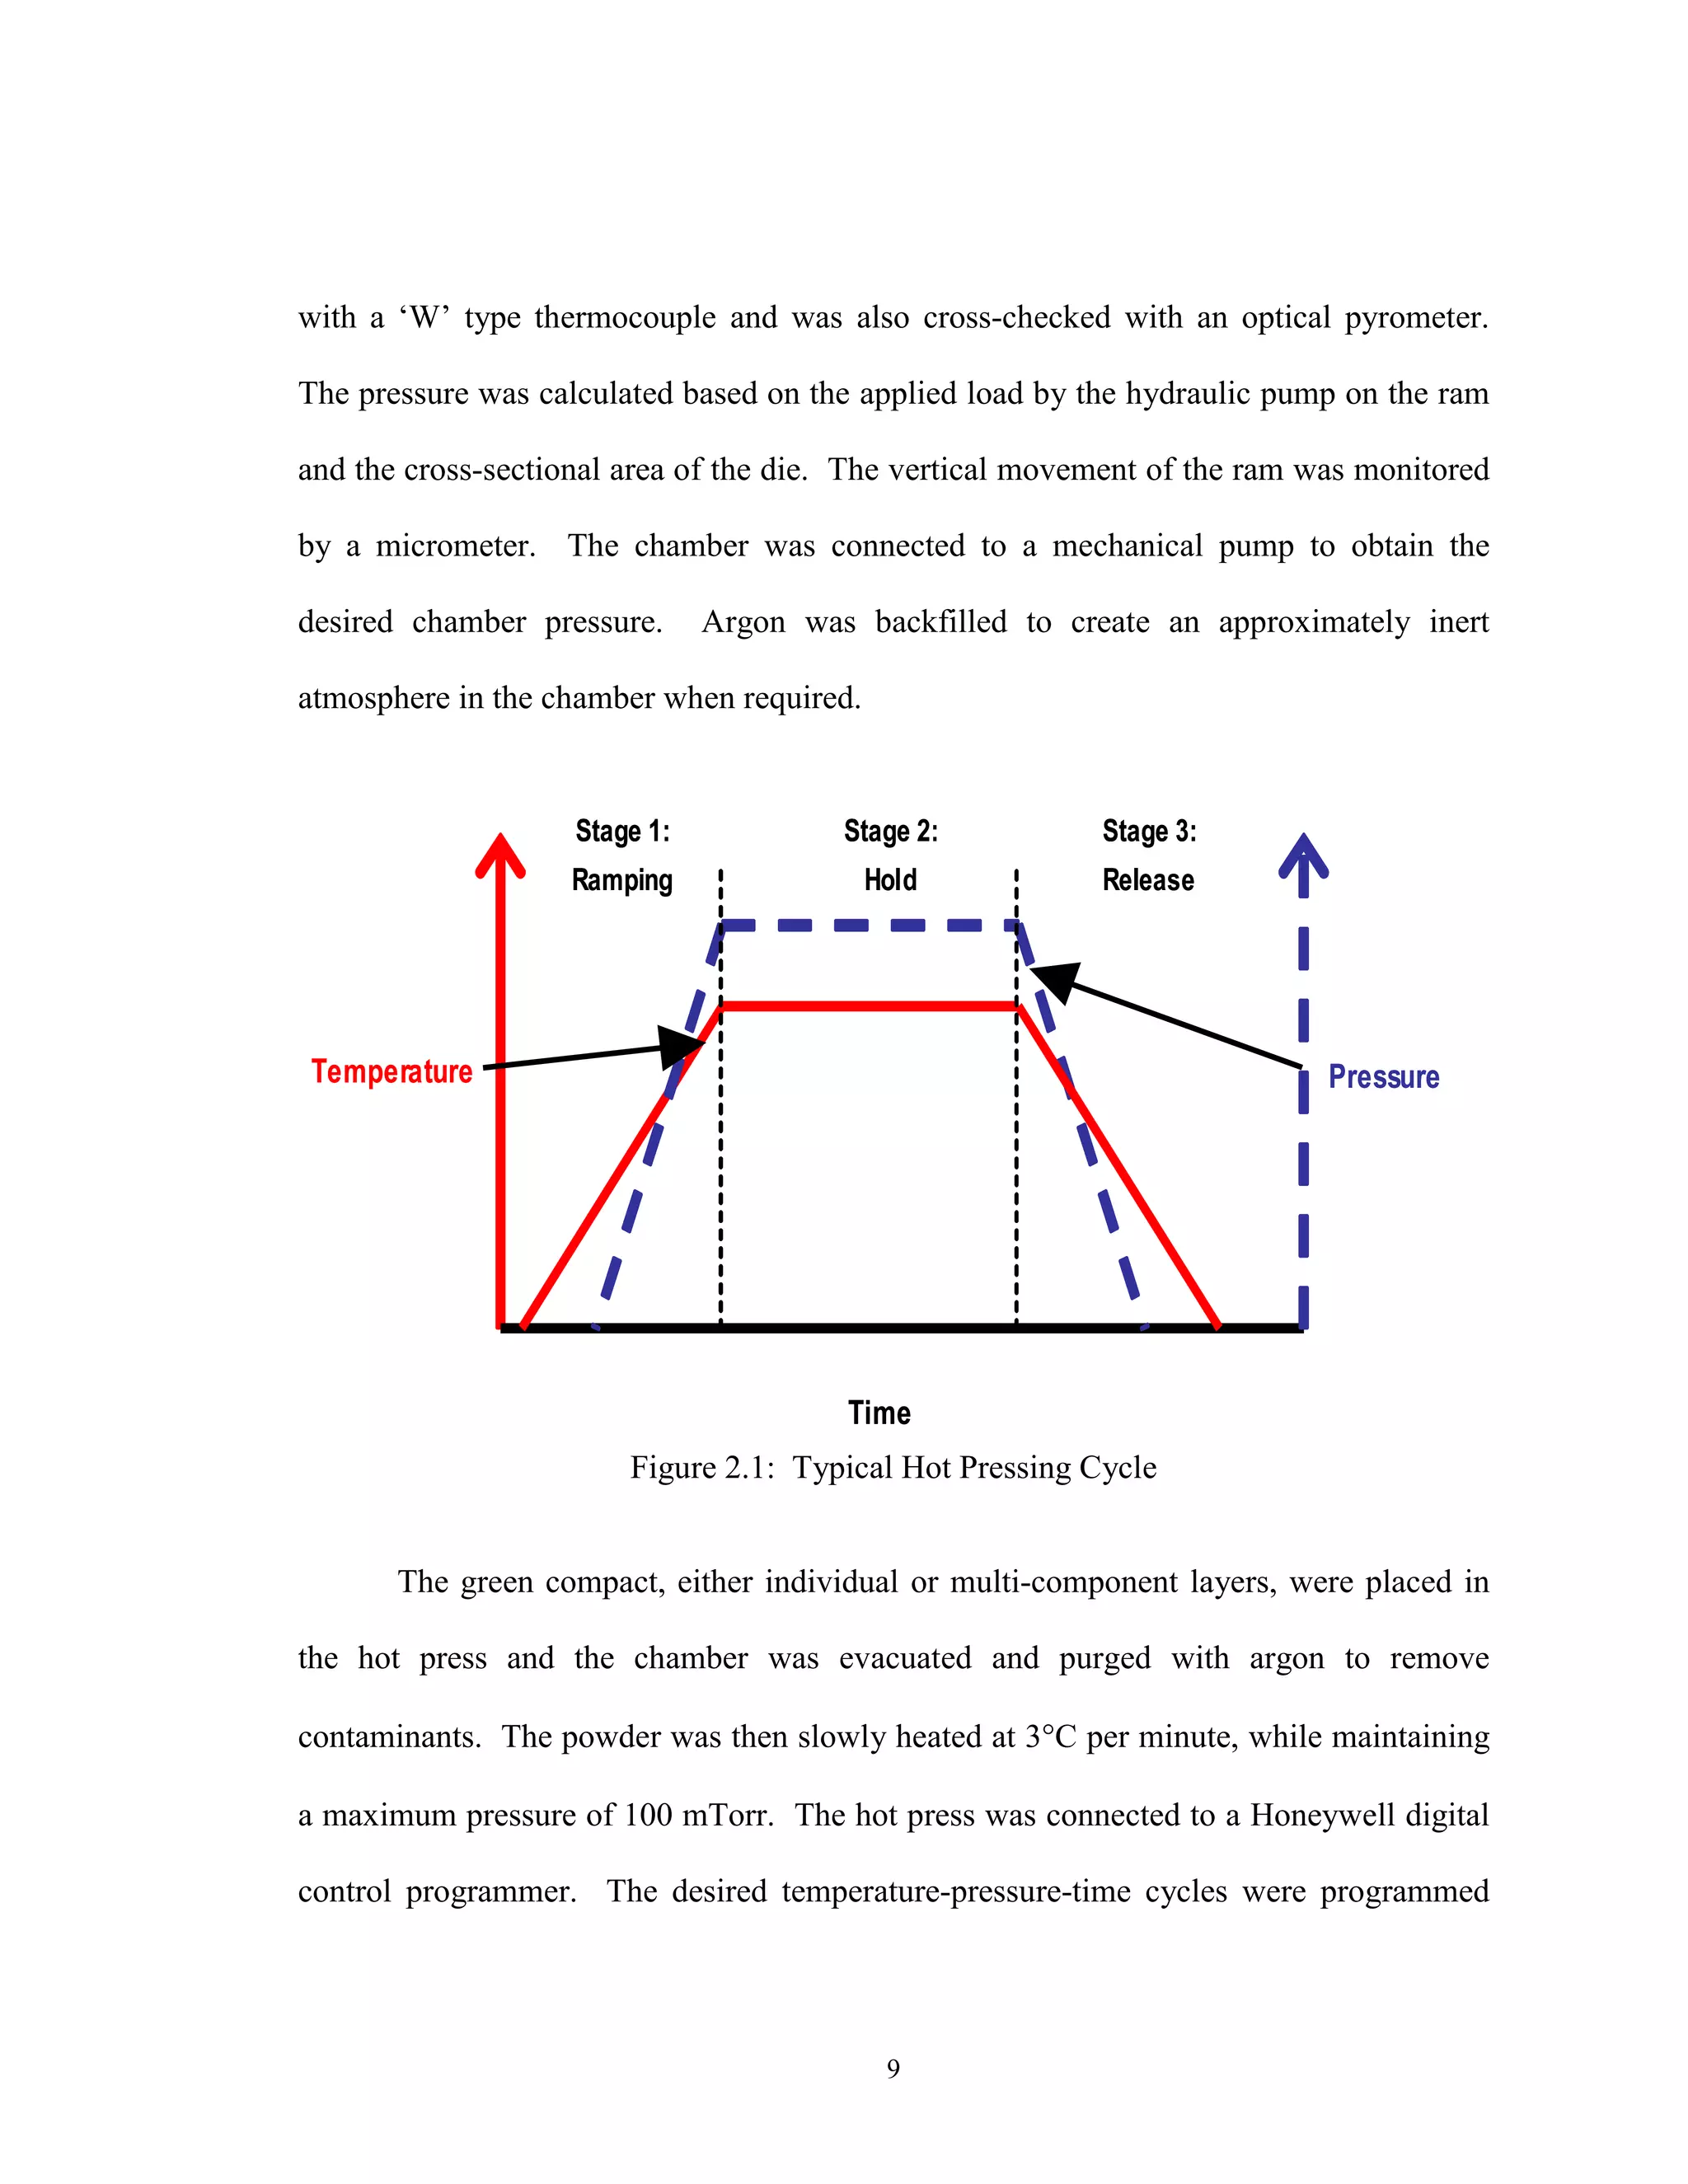
An example of a pressured assisted sintering cycle for pore closure in cemented
carbide ceramics is plotted in Fig. 2.1. A key attribute is the simultaneous application of
maximum temperature and pressure. This cycle has been shown to give the smallest
open porosity [27]. This approach has been taken in this research to ensure a fully dense
electrolyte at the lowest temperature possible. Secondary parameters such as particle size
distribution, green density and added binders are ignored in this representation.
Hot Pressing Experiments: Reducing Environment
The experiments were conducted in a Centorr hot-press with graphite heating
elements resulting in a reducing environment. The chamber temperature was measured](https://image.slidesharecdn.com/sofcsingle-stepjan062003-180904234325/75/ORNL-Sub-94-SS112-04-Development-of-Hot-Pressing-as-a-Low-Cost-Processing-Technique-for-Fuel-Cell-Fabrication-13-2048.jpg)
![13
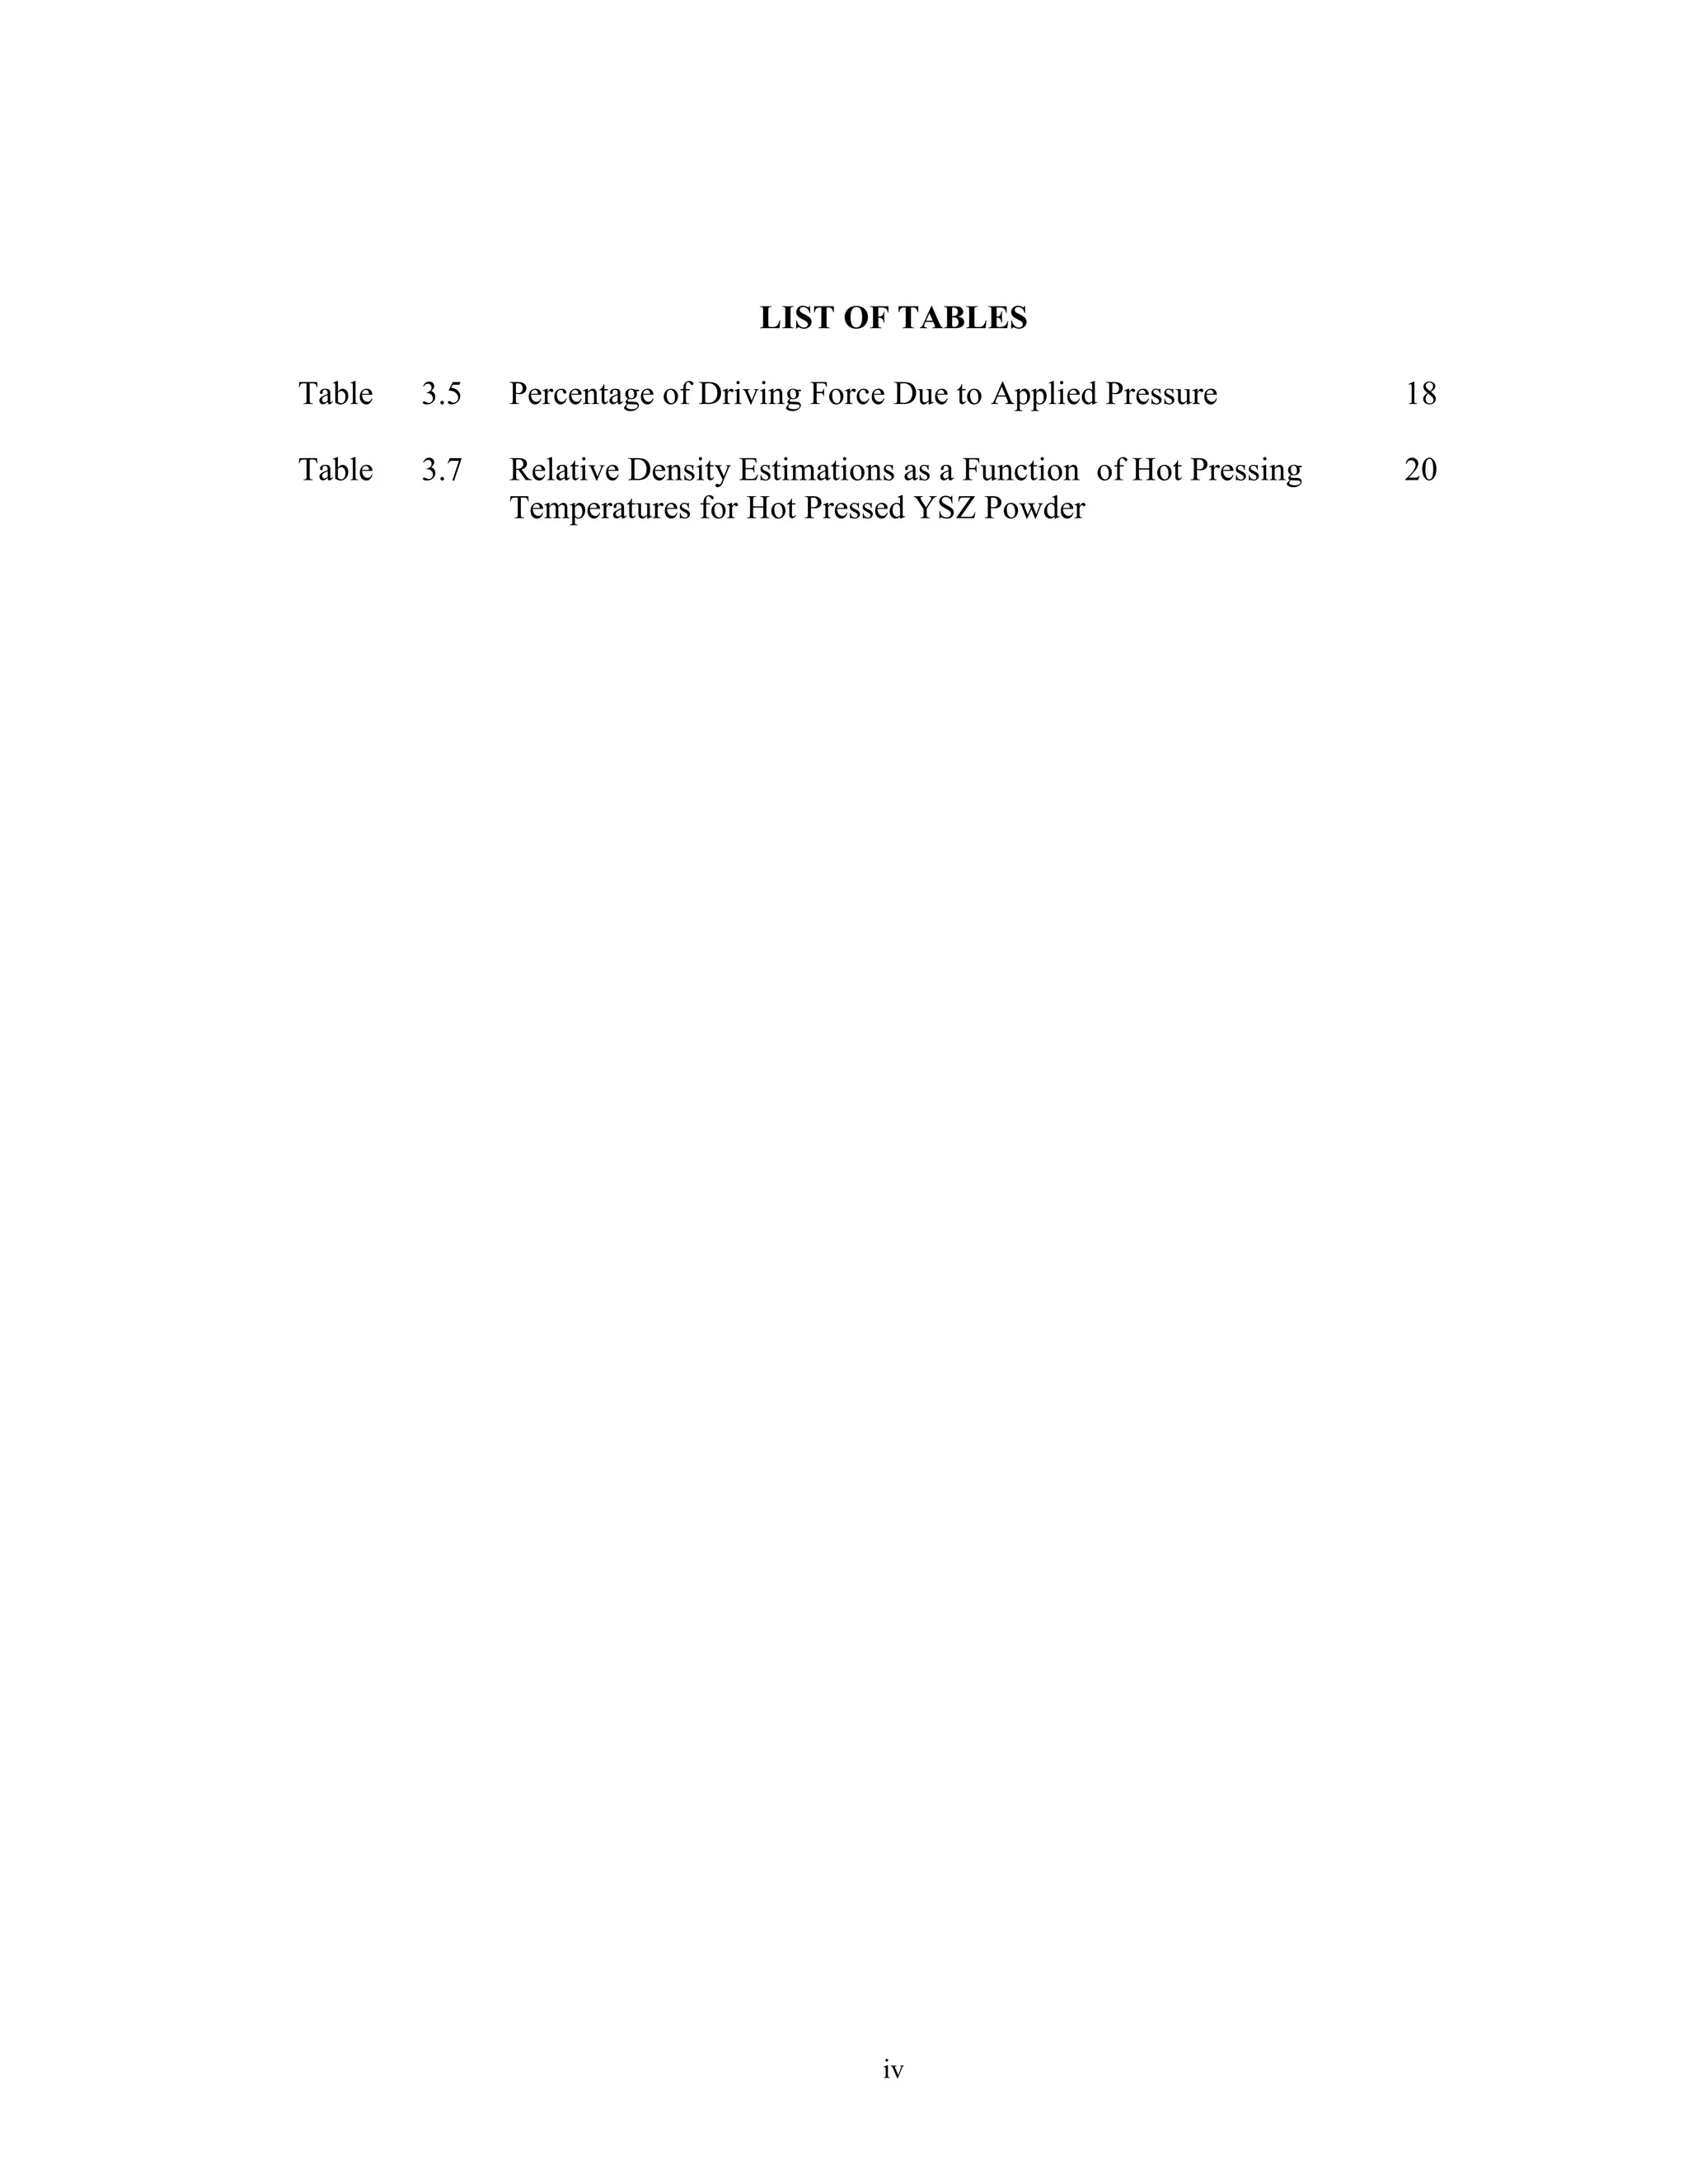
Equipment Limits
The maximum operating temperature of the graphite heating elements used in the
hot press was 2500°C. Therefore 2500°C was the absolute upper limit for the fabrication
temperature. All hot pressing experiments were initially conducted in a graphite die and
sleeve fixture. The reported maximum compressive stress of for high density, fine-
grained structural graphite is 15, 000 to 18, 000 psi, from room temperature to 2500°C
[41]. Assuming a safety factor of 2/3, a maximum pressure limit of 10, 000 psi was
assigned. Therefore a pressure range of 0 to 10, 000 psi was used for these experiments.
This region was further divided into moderate pressure, 0- 5000 psi, and high pressure
5000-10, 000 psi. This is schematically summarized in Fig. 3.2.
0
500
1000
1500
2000
2500
3000
0 2000 4000 6000 8000 10000 12000
Pressure [psi]
Temperature[C]
High Pressure RegimeModerate Pressure Regime
Maximum HP Temperature
Maximum
Graphite
Compressive
Stress
Figure 3.2: Experimental Operating Regime.](https://image.slidesharecdn.com/sofcsingle-stepjan062003-180904234325/75/ORNL-Sub-94-SS112-04-Development-of-Hot-Pressing-as-a-Low-Cost-Processing-Technique-for-Fuel-Cell-Fabrication-18-2048.jpg)
![14
Chemical Interactions
Chemical interactions between the components become important at higher
temperature. Therefore the maximum temperature before interactions begin was
established.
Thermodynamically, ZrO2 reacts with LaMnO3 to form insulating phases such as
La2Zr2O7 between the cathode and electrolyte, at temperatures above 1100°C [42, 43, 44,
45]. Although the reaction kinetics of this reaction are slow, these insulating phases are
undesirable in SOFCs and must be minimized because they hinder electronic conduction
in the cathode causing cell performance to degrade significantly.
Figure 3.3: Practical SOFC Hot Pressing Experimental Regime
MP: 1880 °°°°C
500
1000
1500
2000
2500
3000
Temperature[C]
ElectrolyteCathode Anode Interconnect
La2Zr2O7 Formation
Mn +2 Diffusion NiCrO 4 Formation
MP: 2660 °°°°C
MP: 1453 °°°°C
MP: 2510 °°°°C](https://image.slidesharecdn.com/sofcsingle-stepjan062003-180904234325/75/ORNL-Sub-94-SS112-04-Development-of-Hot-Pressing-as-a-Low-Cost-Processing-Technique-for-Fuel-Cell-Fabrication-19-2048.jpg)
![15
Manganese is known to be a mobile species at high temperatures and can easily
diffuse into the electrolyte, changing the electrical characteristics or the structure of both
the cathode and the electrolyte [46]. Fabrication temperature was limited to below
1400°C to minimize this migration. Also, above 1400°C, Ni or NiO may react with the
LaCrO3 interconnect material to form poorly conducting phases such NiCrO4 [47].
Finally, elemental Nickel melts at 1453°C. These facts suggested a maximum processing
temperature of 1400°C, lower if possible. These facts, as well as the melting points of
the SOFC component materials are summarized in Fig. 3.3
Established Sintering Cycles
The monolithic fuel cell fabrication temperature using tape calendaring and
pressure-less sintering was reported to lie between 1300 and 1400°C [27, 48].
Zirconia powder, of 0.1 µm mean diameter, was sintered to 98% theoretical
density at 1300°C in air [50]. YSZ powders of sub-micrometer size were formed into a
green body (about 50% green density) and fired to 95% theoretical density in air at
1125°C [51]. These data suggest a starting point for hot pressing zirconia to full density
of 1100°C to 1300°C.
Nickel powder, of 0.5 µm particle size, was sintered at 800°C to 98% theoretical
density [49]. This suggests that Ni powder will not yield the 30-40% porosity required
for a SOFC anode. However, NiO powder of 0.3 µm mean particle size was fired to 57%
theoretical density at 900°C [49]. This suggests that NiO powder will yield the 30-40%](https://image.slidesharecdn.com/sofcsingle-stepjan062003-180904234325/75/ORNL-Sub-94-SS112-04-Development-of-Hot-Pressing-as-a-Low-Cost-Processing-Technique-for-Fuel-Cell-Fabrication-20-2048.jpg)
![16
porosity required for a SOFC anode. This is consistent with the established processing of
the anode using NiO powder as described in the introductory section.
The LSM cathode was air sintered at 1250°C, to the required porosity level [18].
Since an additional driving force for densification, arising from the applied pressure, was
available in hot pressing, this ensured densification to the required porosity at or below
1250°C.
Based on the above information, the limitation to the experimental regime
imposed by previously established sintering cycles is summarized in Fig. 3.4.
500
700
900
1100
1300
1500
Temperature[C]
ElectrolyteCathode Anode
YSZ Air Sintered
Monolithic Fabrication Temperature
Interconnect
Nano YSZ Air Sintered
Ni 98% Density
NiO 57% Density
LSM 80% Density
500
700
900
1100
1300
1500
Temperature[C]
ElectrolyteCathode Anode
YSZ Air Sintered
Monolithic Fabrication Temperature
Interconnect
Nano YSZ Air Sintered
Ni 98% Density
NiO 57% Density
LSM 80% Density
500
700
900
1100
1300
1500
Temperature[C]
ElectrolyteCathode Anode
YSZ Air Sintered
Monolithic Fabrication Temperature
Interconnect
Nano YSZ Air Sintered
Ni 98% Density
NiO 57% Density
LSM 80% Density
Figure 3.4: Practical SOFC Hot Pressing Experimental Regime](https://image.slidesharecdn.com/sofcsingle-stepjan062003-180904234325/75/ORNL-Sub-94-SS112-04-Development-of-Hot-Pressing-as-a-Low-Cost-Processing-Technique-for-Fuel-Cell-Fabrication-21-2048.jpg)
![18
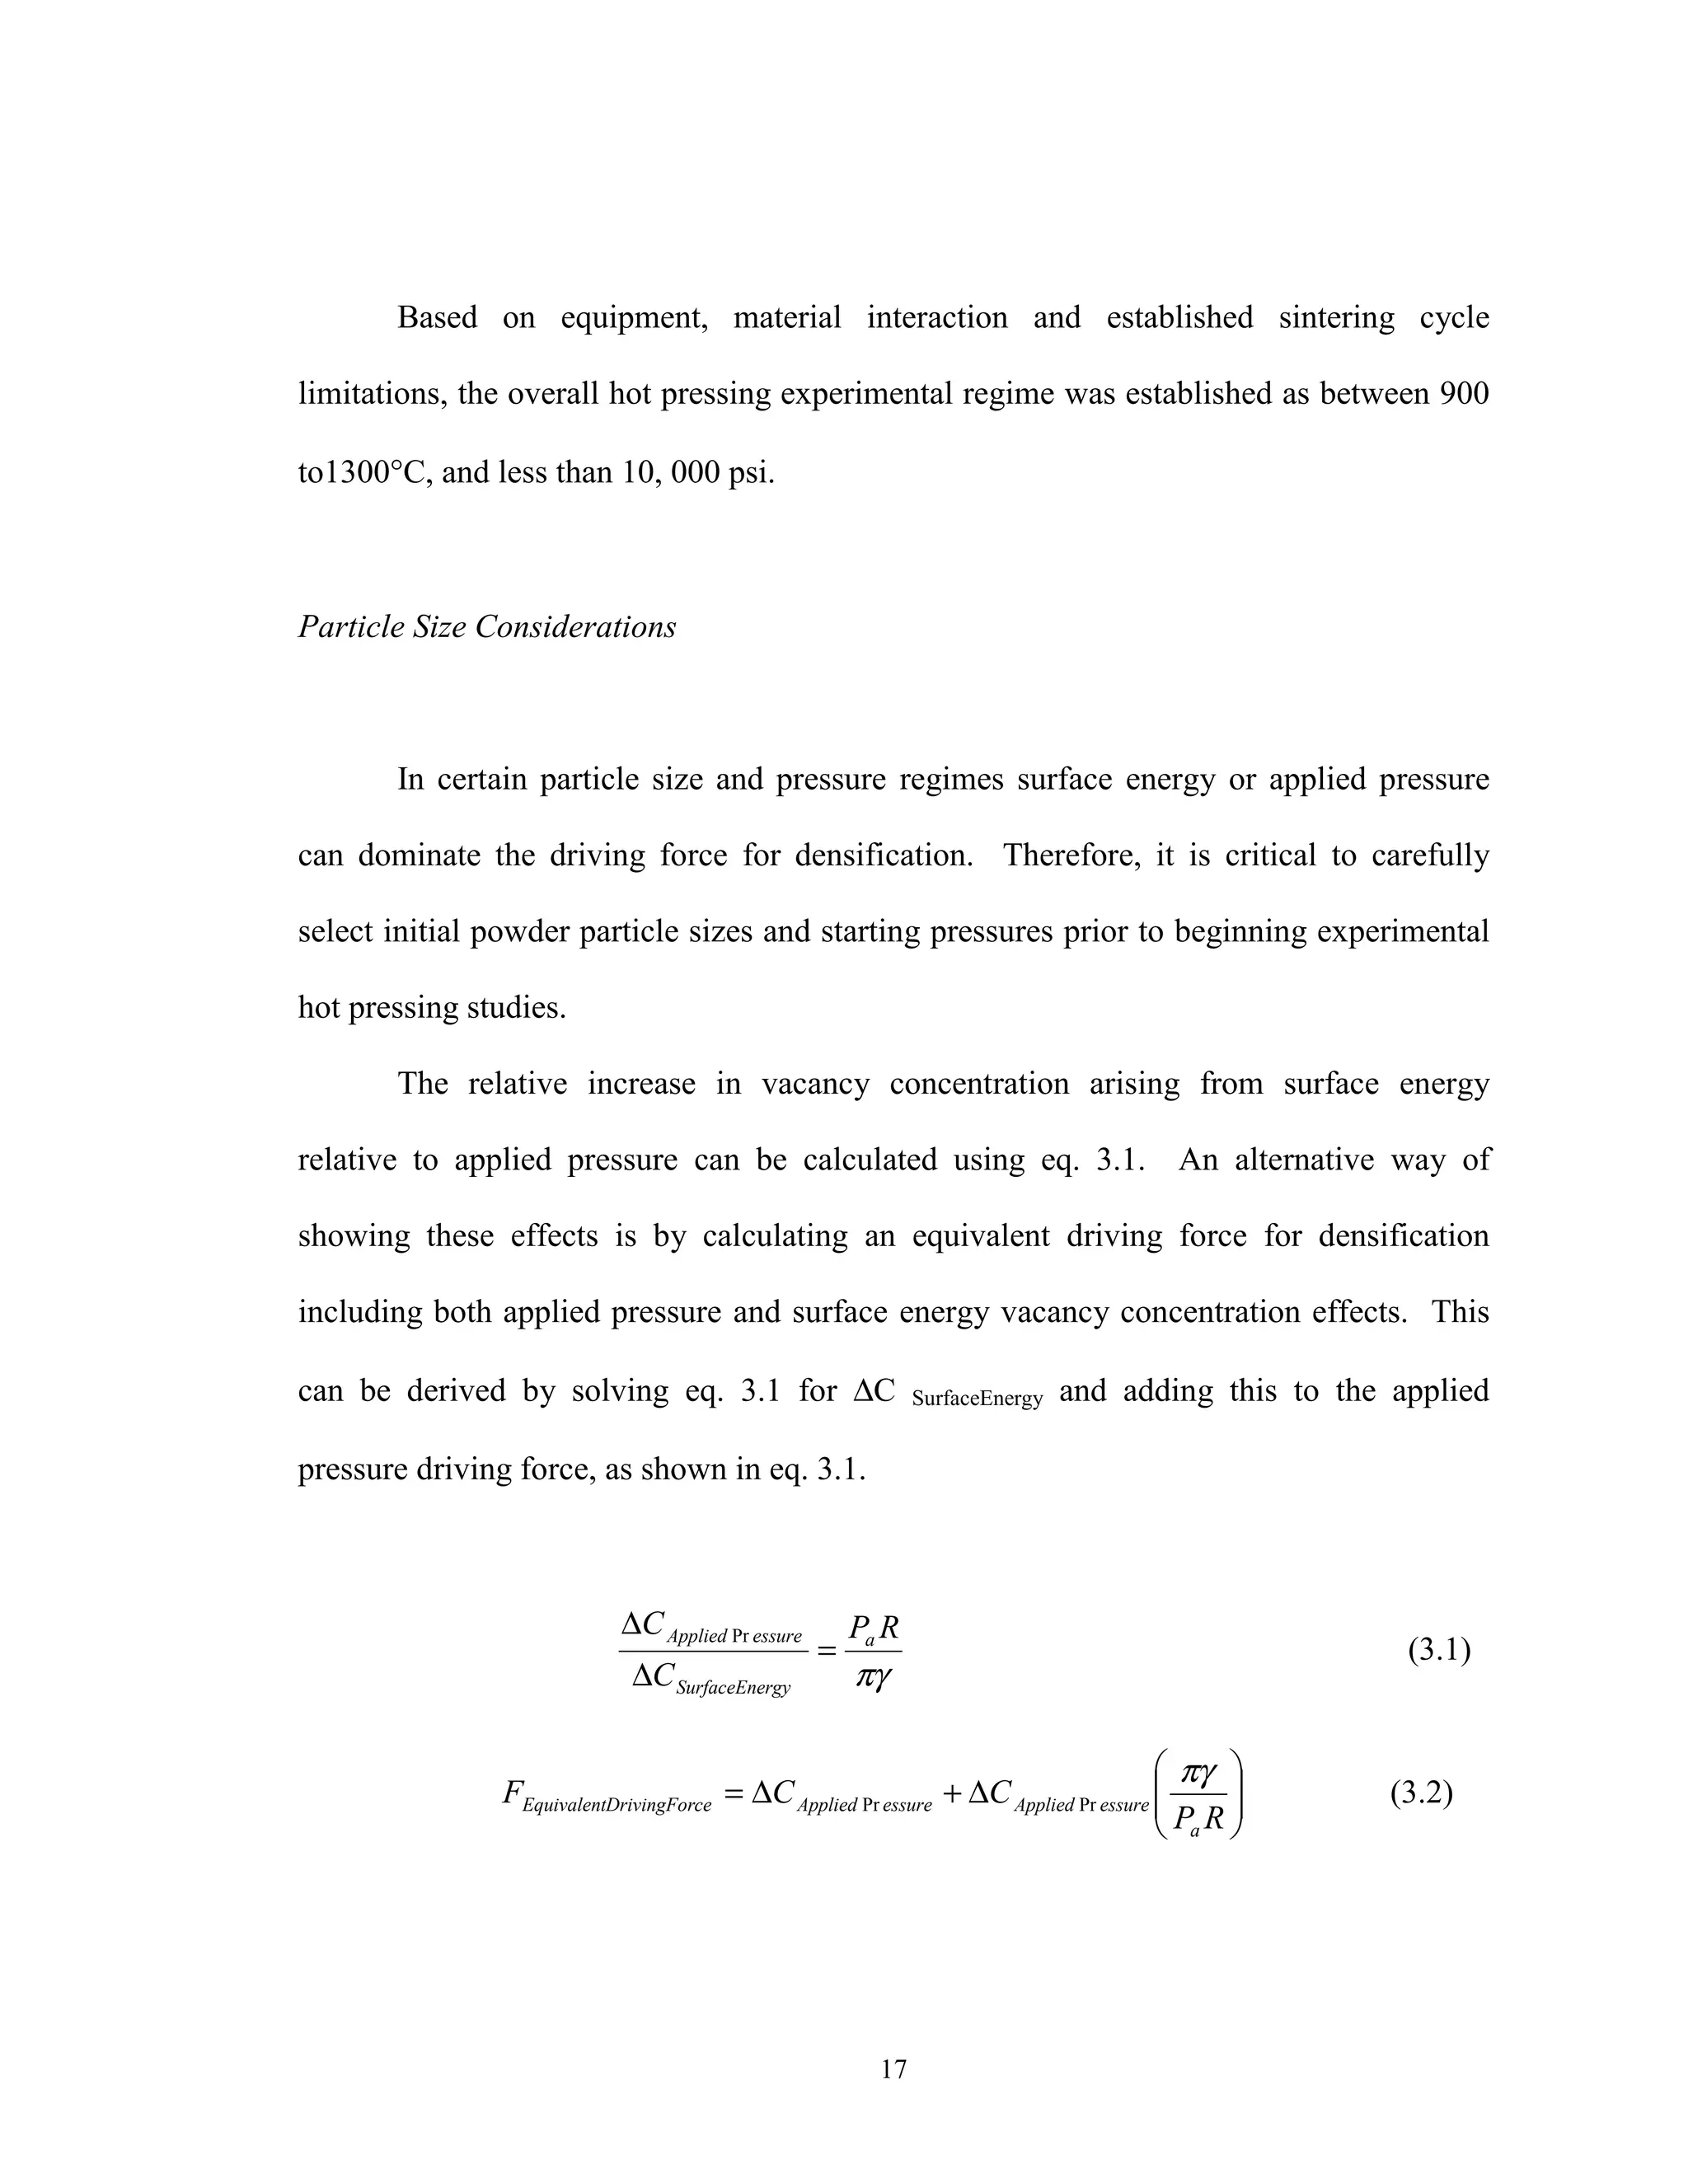
Using eq. 3.1, the equivalent driving force was calculated over several particle
sizes and applied pressures ranges. In Table 3.5, the percentage of this driving force due
to applied pressure was calculated. The surface energy, γ, used in eq. 3.1, was
approximated as 10 3
ergs/ cm 2
or 1 J/ m 2
as described by Coble [34]. As evident from
the calculated values, the surface energy contribution to driving force is negligible (<1%)
for particle sizes 10 µm and greater, with 2500 psi or greater as the applied force.
Particle Size Radius [µµµµm]
Applied
Pressure
[psi] 0.01 0.1 1 10 100 1000
10000
40.79% 87.33% 98.57% 99.86% 99.99% 100.00%
5000
25.62% 77.50% 97.18% 99.71% 99.97% 100.00%
2500
14.69% 63.27% 94.51% 99.42% 99.94% 99.99%
1000
6.45% 40.79% 87.33% 98.57% 99.86% 99.99%
100
0.68% 6.45% 40.79% 87.33% 98.57% 99.86%
Table: 3.5: Percentage of Driving Force Due to Applied Pressure.
Full density, or at a minimum, closed porosity is critical for an SOFC electrolyte.
Therefore, it was desirable to hot press with a powder particle size where there was a
significant contribution to driving force from both applied pressure and surface energy
effects. Assuming 2500 psi applied pressure, a particle range between 0.1 and 1 µm
yielded approximately a 50% contribution to driving force from both applied pressure
and surface energy effects. However for the electrodes, densification was limited or
hindered as much as possible since incomplete sintering or connected porosity is critical](https://image.slidesharecdn.com/sofcsingle-stepjan062003-180904234325/75/ORNL-Sub-94-SS112-04-Development-of-Hot-Pressing-as-a-Low-Cost-Processing-Technique-for-Fuel-Cell-Fabrication-23-2048.jpg)
![23
Anode Development
A SOFC anode consists of 30 to 40 vol% nickel with the balance YSZ and
approximately 20- 40 % porosity. The anode is processed with Ni in its oxide form and
reduced in situ as the cell begins operating in the fuel gas of 95% H2-5 % H2O at 1000°C.
This process has been found to take place in a matter of minutes under these conditions
[18].
High temperature use of the hot press necessitates graphite as structural material
for the heating elements. The carbon environment was highly reducing, since only a
limited amount of oxygen was present (from the NiO). Therefore the atmosphere is
controlled by the presence of carbon monoxide, as described by eq. 3.3. The change in
Gibbs Free Energy, at 1100°C, for this reaction is -68.943 kJ and equilibrium constant is
shown in eq. 3.4 [51].
C+CO2 (g) =2CO (g) (3.3)
k equilibrium = P2
CO / P CO2 = 419.6 (3.4)
Thermodynamically, the graphite environment caused reduction of the NiO
through the formation of carbon dioxide, as shown in eq. 3.5. The change in Gibbs Free
Energy, at 1100°C, for this reaction was -160 kJ and equilibrium constant is shown in eq.
3.6 [51]. The negative change in Gibbs Free Energy for this reaction above 300°C,](https://image.slidesharecdn.com/sofcsingle-stepjan062003-180904234325/75/ORNL-Sub-94-SS112-04-Development-of-Hot-Pressing-as-a-Low-Cost-Processing-Technique-for-Fuel-Cell-Fabrication-28-2048.jpg)
![24
resulted in a driving force for the reduction of NiO through a solid state reaction over the
entire hot pressing experimental regime.
2NiO + C = 2 Ni +CO2 (g) (3.5)
k equilibrium = P CO2 = 1.39 x 10 6
(3.6)
After this reduction took place, the Ni metal that formed physically separated the
C and NiO. There was no longer intimate contact between the graphite and the NiO.
Any further reduction took place though the gas phase reaction of NiO and CO as
described in eq. 3.7. The change in Gibbs Free Energy, at 1100°C, for this reaction was
-46 kJ and the equilibrium constant is shown in eq. 3.8 [51].
NiO + CO (g)= Ni +CO2 (g) (3.7)
k equilibrium = P CO2 / P CO = 57.4 (3.8)
The equilibrium of Ni and NiO was controlled by the temperature and the oxygen
partial pressure of the atmosphere at which the equilibrium took place. Any CO2 which
formed reacted with the carbon components of the hot press according to eq. 3.3. At all
temperatures, the equilibrium oxygen partial pressure in the hot press was controlled by
the reaction in eq. 3.3 as discussed above. The log of the equilibrium oxygen partial
pressure (see Appendix A) of this reaction is plotted versus the Ni/ NiO equilibrium
oxygen partial pressure in Fig. 3.10. In an analogous manner to an Ellingham Diagram,](https://image.slidesharecdn.com/sofcsingle-stepjan062003-180904234325/75/ORNL-Sub-94-SS112-04-Development-of-Hot-Pressing-as-a-Low-Cost-Processing-Technique-for-Fuel-Cell-Fabrication-29-2048.jpg)
![26
1E-30
1E-24
1E-18
1E-12
1E-06
1
500 600 700 800 900 1000 1100 1200 1300 1400 1500
Temperature [C]
PartialPressureofOxygen
2Ni + O2(g) = 2NiO 2CO(g) + O2(g) = 2CO2(g) 2H2(g) + O2(g) = 2H2O(g)
Figure 3.10: Equilibrium Oxygen Partial Pressure of Ni/ and NiO as a Function of
Temperature.
Elimination of Ni Reaction Layer
Experimental modifications were made to reduce the driving force and kinetics
for NiO reduction during hot pressing. This was accomplished by attempting to control
the oxygen partial pressure where the reaction takes place, at the sample surface.
YSZ discs were used to isolate the NiO from the carbon environment during hot
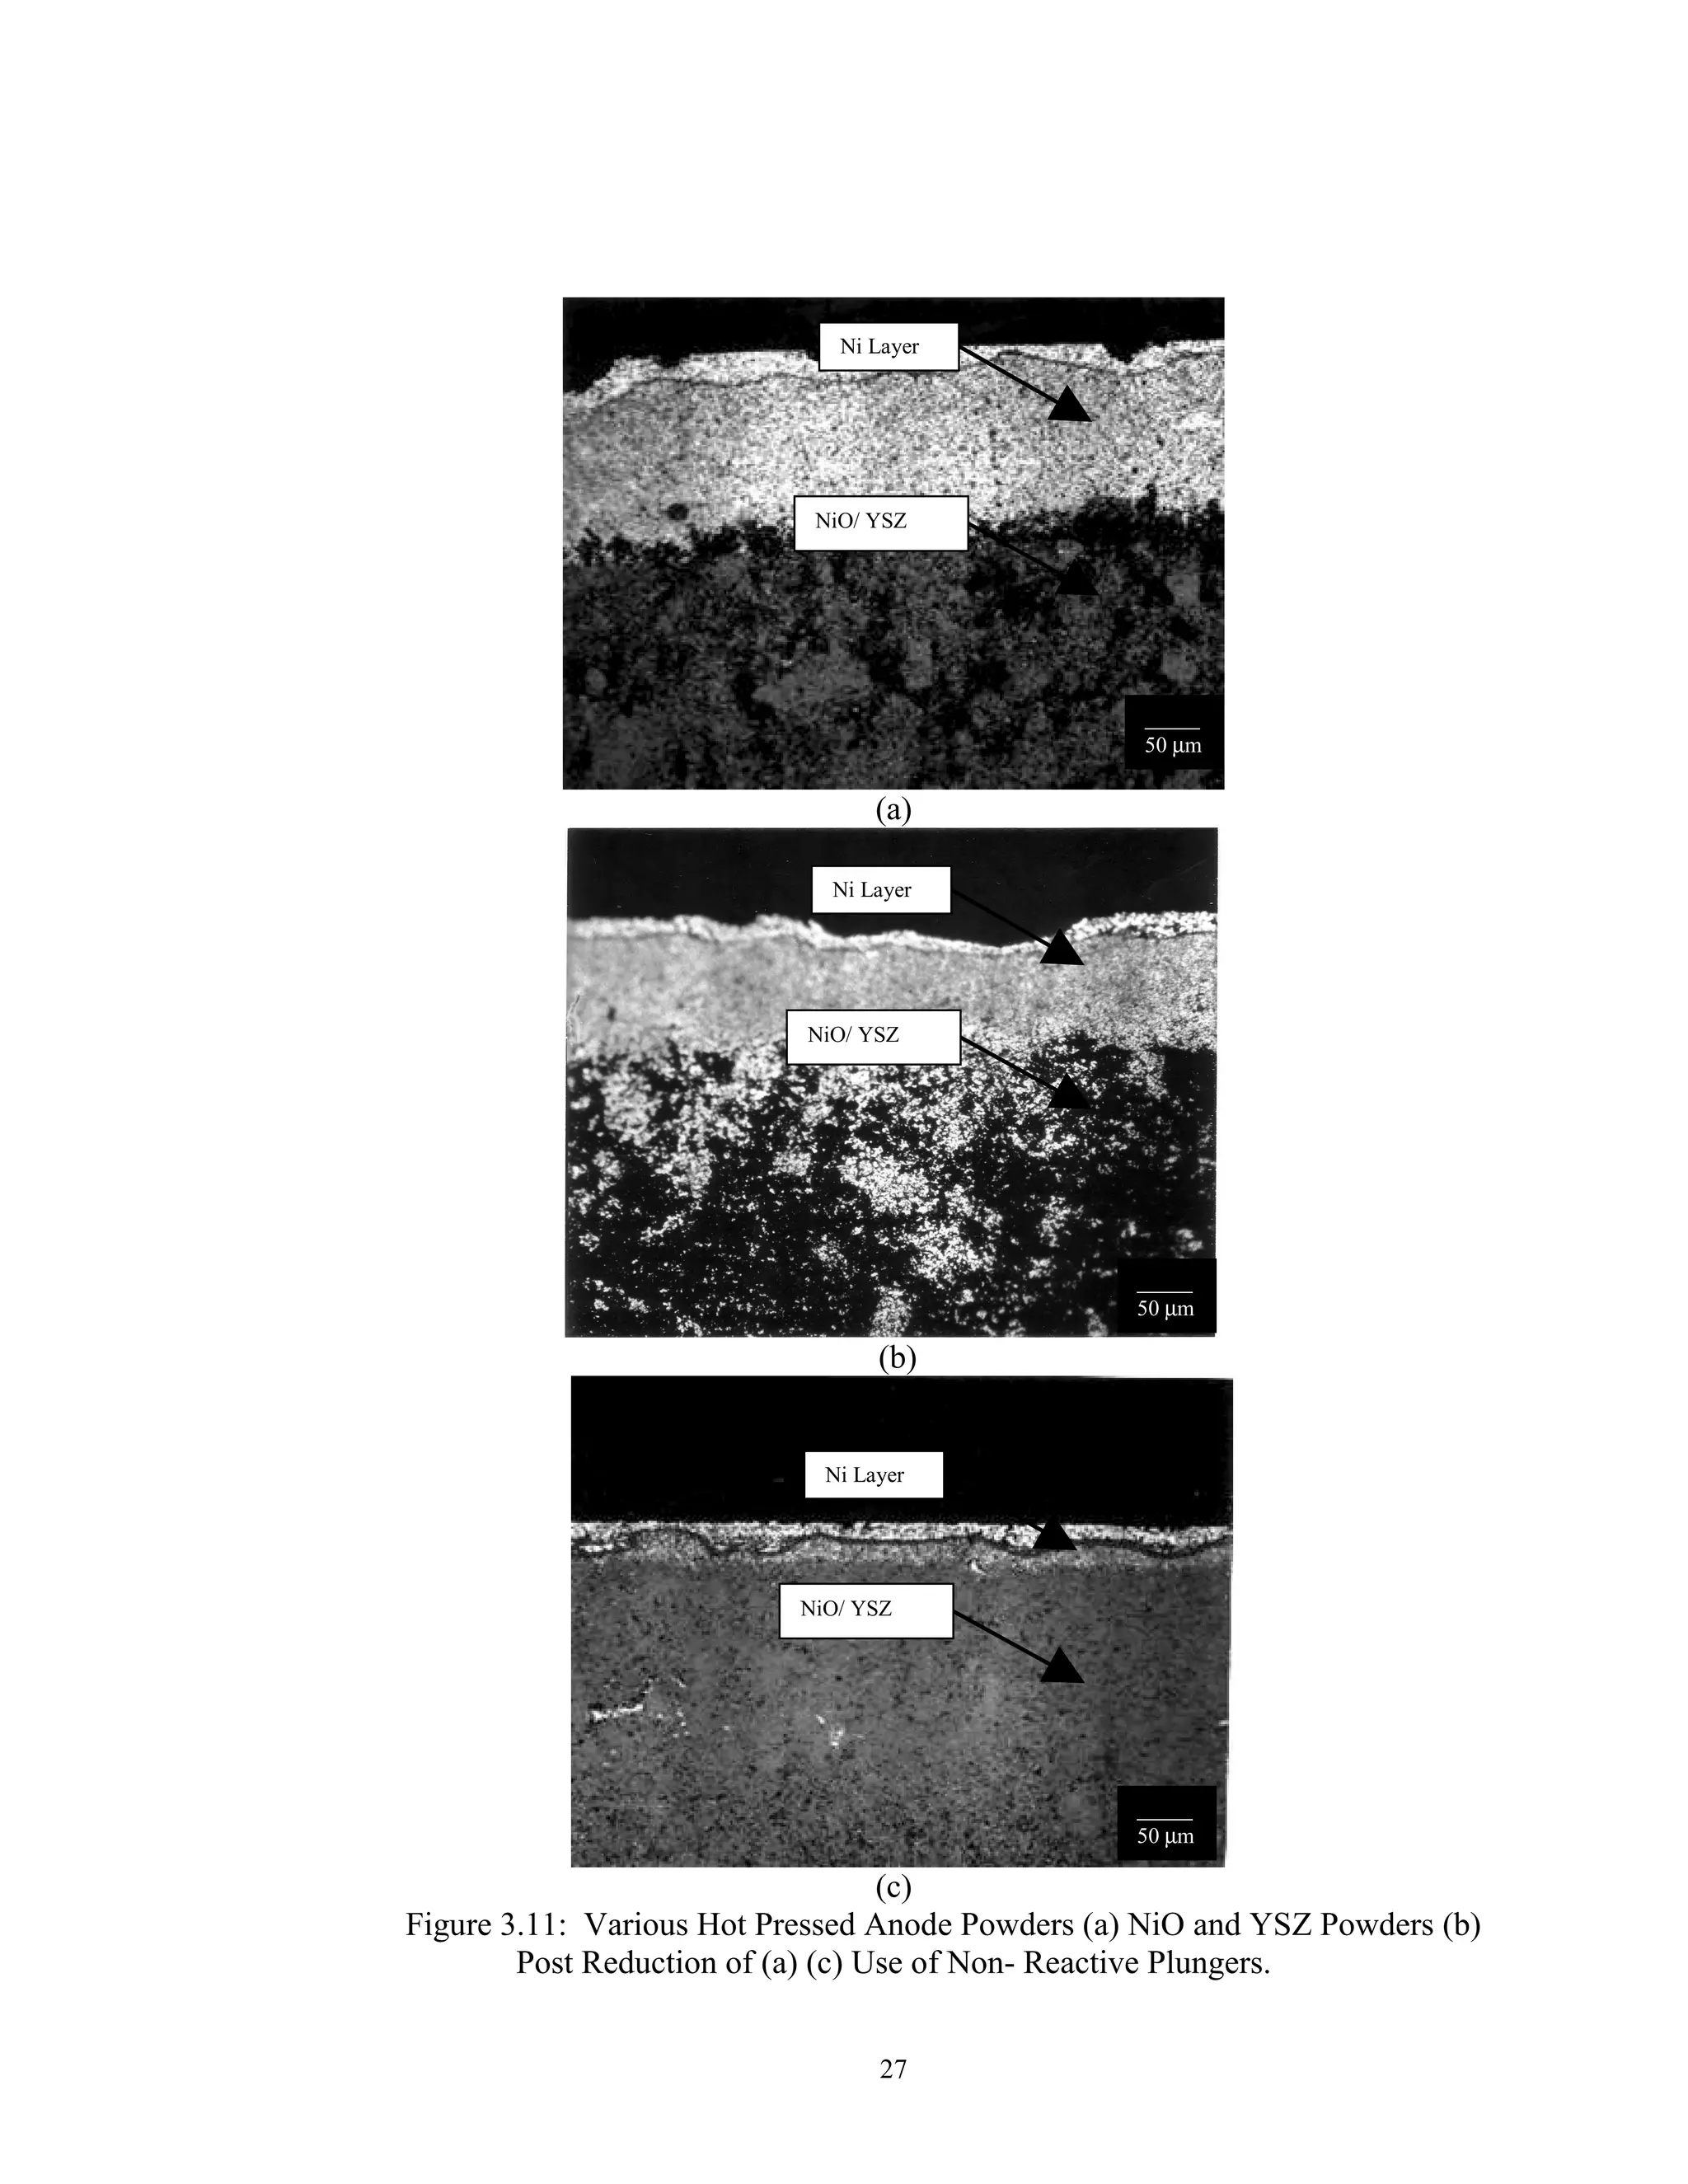
pressing. With NiO sandwiched between these plungers, the compact was hot pressed at
1100°C, 2500 psi, with a 30 min hold. Hot pressed samples processed using a carbon
sleeve and YSZ plungers are shown in Fig. 3.11a and Fig. 3.11c, respectively.
Substantial reduction in the thickness of the Ni reaction layer was evident. However,
even after this modification, a thin layer of Ni was still present at the sample surface.
NiO Stable
Ni Stable](https://image.slidesharecdn.com/sofcsingle-stepjan062003-180904234325/75/ORNL-Sub-94-SS112-04-Development-of-Hot-Pressing-as-a-Low-Cost-Processing-Technique-for-Fuel-Cell-Fabrication-31-2048.jpg)
![28
Further extension of this isolation concept incorporates fully inert die and sleeves.
Elimination of the carbon sleeve and plunger was accomplished using an alumina tube
and discs. By hot pressing in an environment without any direct contact between NiO
and carbon, the thickness of the Ni layer could be further reduced. However the presence
of the low oxygen partial pressure around the die assembly still seemed to draw oxygen
from the NiO.
Oxidizing Environment
For NiO to remain stable (eq. 3.9), the partial pressure of oxygen must remain
above 1.17 x 10 -9
atm. at 1100°C [52].
2 NiO = 2 Ni + O2(g) (3.9)
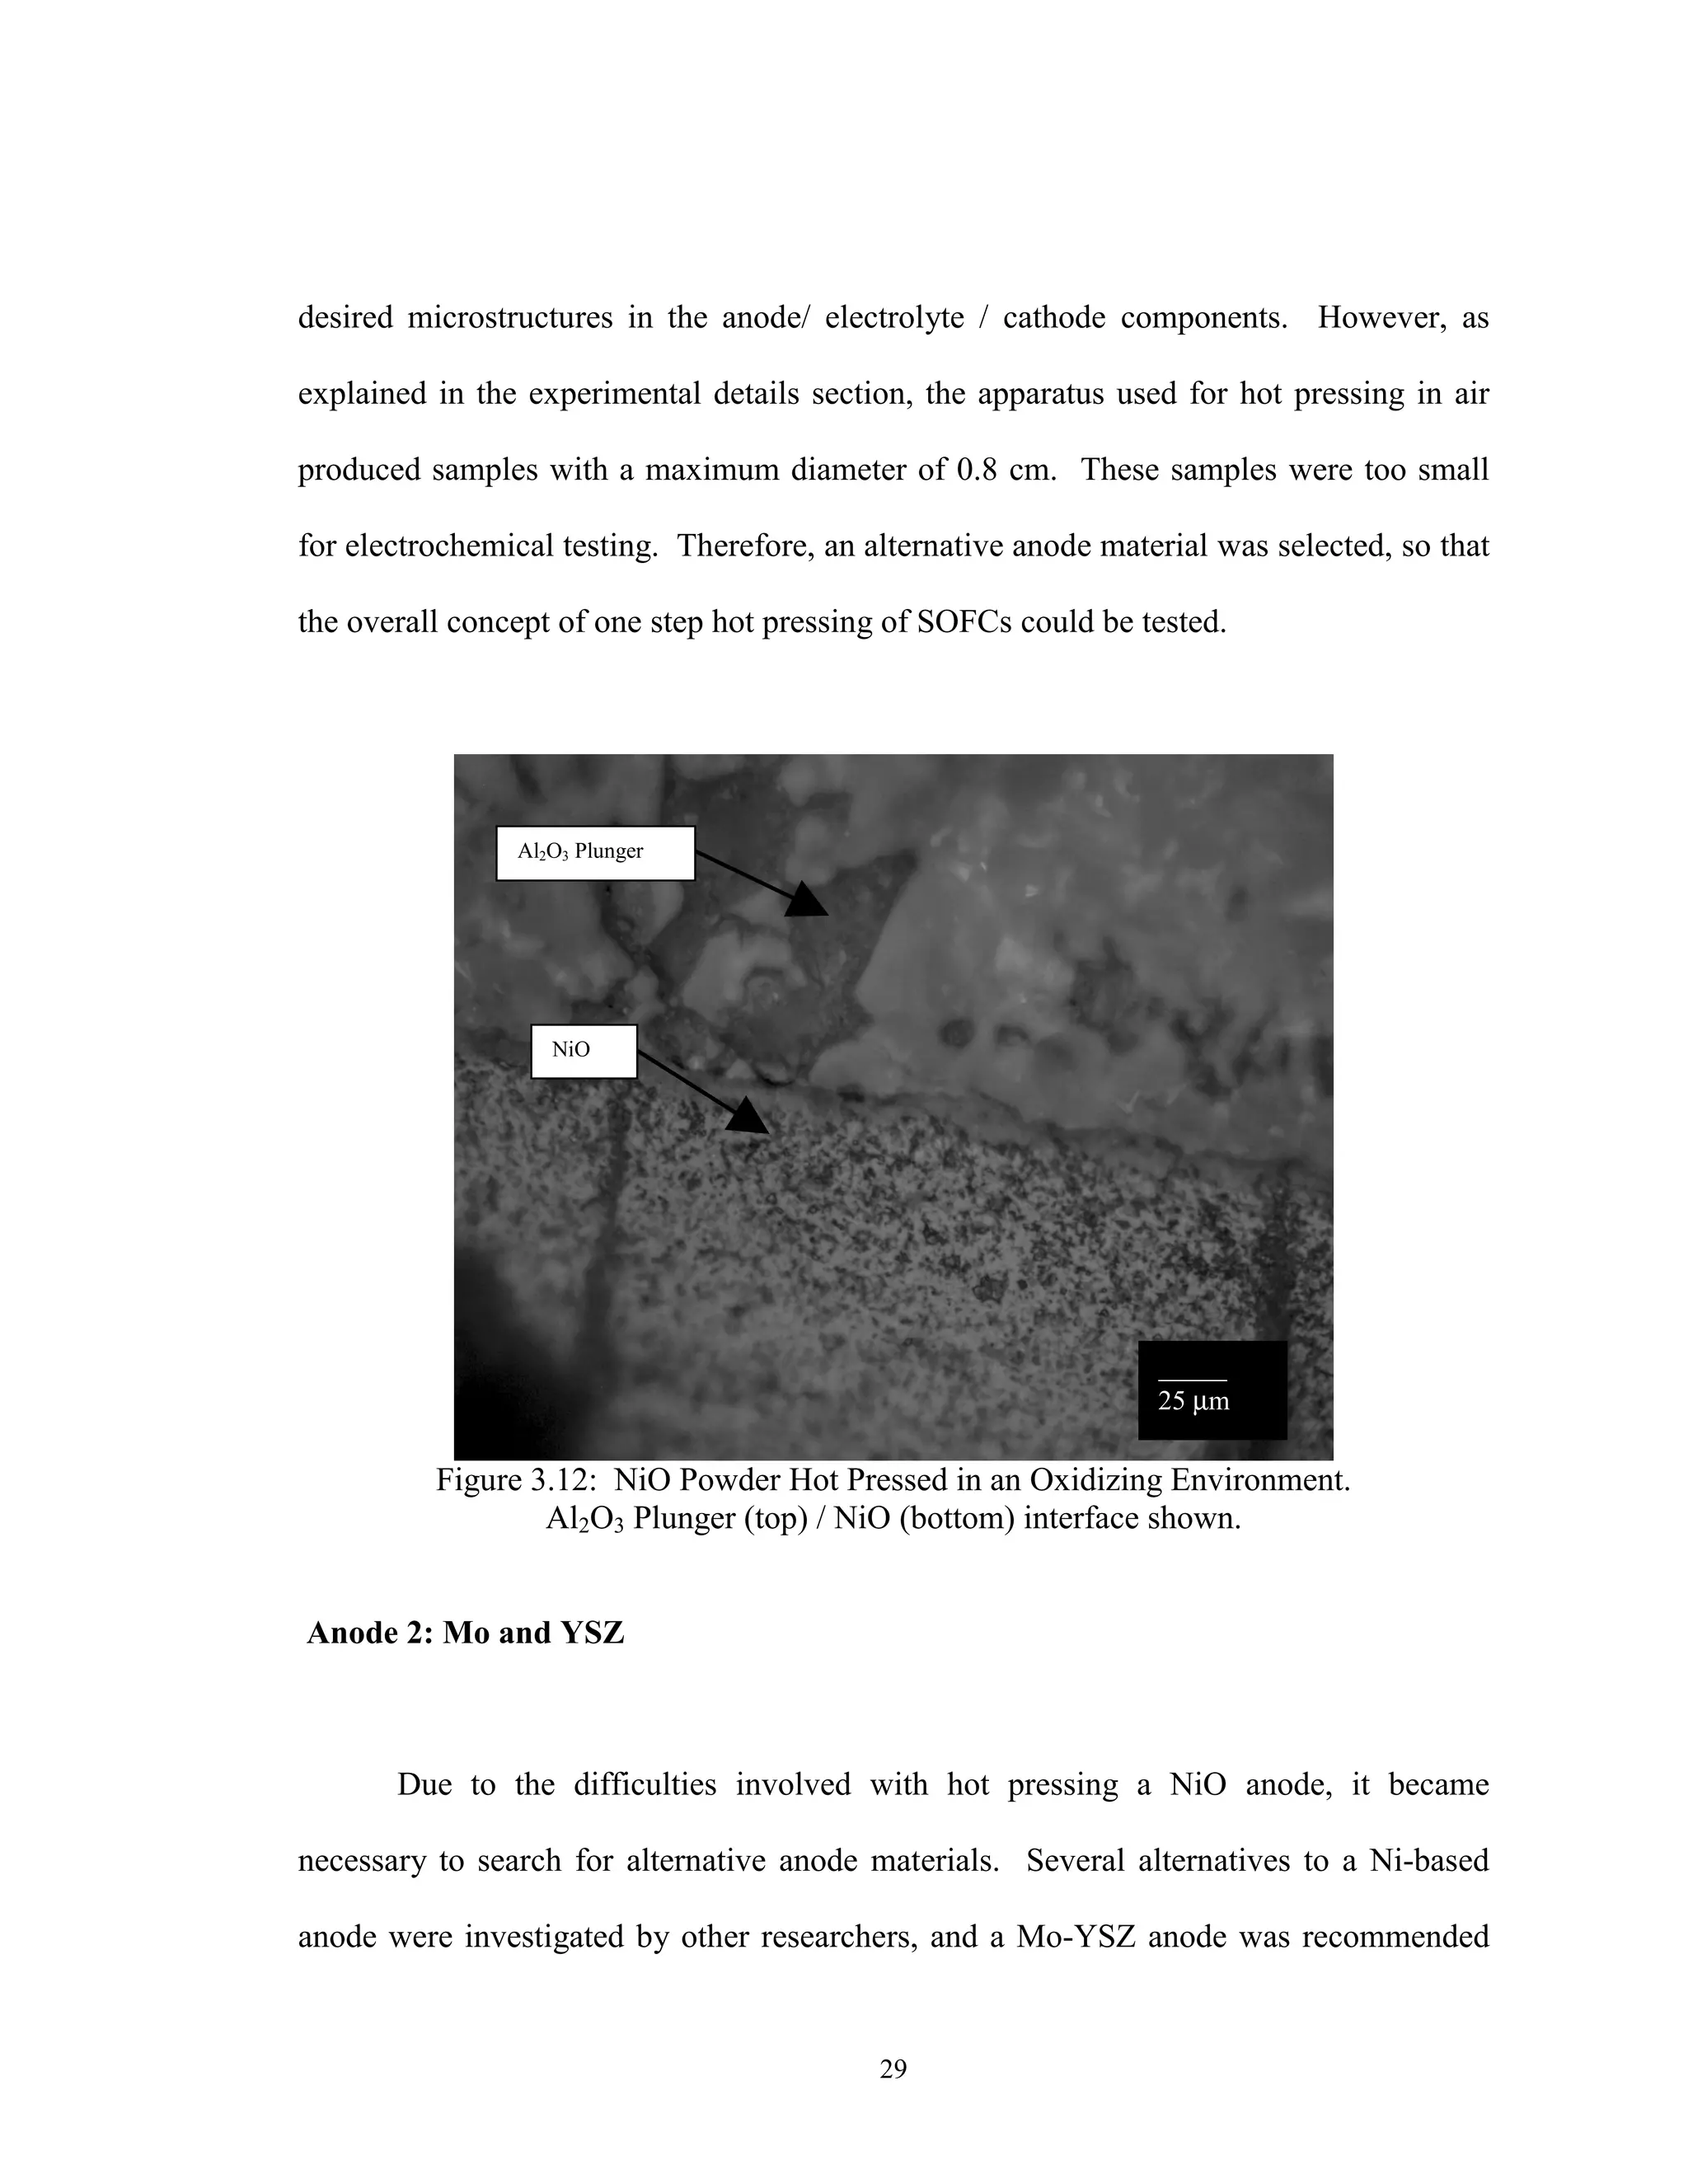
Therefore, hot pressing NiO in an oxidizing partial pressure should not allow any
reduction of the oxide. NiO was hot pressed in air at 1100°C, 2500 psi, 30 min hold in an
alumina die and sleeve. Results of this experiment are shown in Fig. 3.12. Notice that no
elemental Ni is found in the cross section or at the die/ powder compact interface. The
NiO reduction problem can be eliminated if an oxidizing environment is used.
Since the LSM cathode operates in an oxidizing atmosphere while the YSZ
electrolyte is stable in both oxidizing and reducing environments [18], the oxidizing
atmosphere results confirm that SOFCs can be hot pressed in a single step to produce the](https://image.slidesharecdn.com/sofcsingle-stepjan062003-180904234325/75/ORNL-Sub-94-SS112-04-Development-of-Hot-Pressing-as-a-Low-Cost-Processing-Technique-for-Fuel-Cell-Fabrication-33-2048.jpg)
![30
[52]. Mo was found to offer stability in the reducing SOFC fuel mixture environment
and formed no insulating phases with YSZ. Additionally, Molybdenum’s electrical
resistivity compares favorably with Ni, ρ Mo = 5.20 µΩ-cm while ρ Ni = 6.84 µΩ-cm [50].
To evenly distribute the YSZ phase throughout the anode, 0.2 um YSZ powder
was used. This resulted in an even, uniform and controlled microstructure with greater
than 40% porosity. The uniformly distributed YSZ cannot be distinguished optically as a
second phase.
The Mo based anode was then hot pressed with the YSZ electrolyte. However,
the Mo anode did not adhere to the electrolyte resulting in poor interfacial contact. This
micrograph is shown in Fig. 3.13. The use of this anode would result in increased charge
transfer resistance and unsatisfactory performance. Therefore the development of a new
anode system was explored.
Figure 3.13: Hot Pressed Mo/ YSZ Anode and YSZ Electrolyte.
YSZ Electrolyte
Mo/ YSZ Anode
Poor Interfacial Contact
_______
25 µm](https://image.slidesharecdn.com/sofcsingle-stepjan062003-180904234325/75/ORNL-Sub-94-SS112-04-Development-of-Hot-Pressing-as-a-Low-Cost-Processing-Technique-for-Fuel-Cell-Fabrication-35-2048.jpg)
![31
Anode 3: Mo/ 3% Ni and YSZ
An adherence problem between Molybdenum based anodes and YSZ electrolyte
has been encountered before [52]. The solution pursued by these researchers was to
change the surface properties and/or increase diffusive flux through the addition of 3 wt%
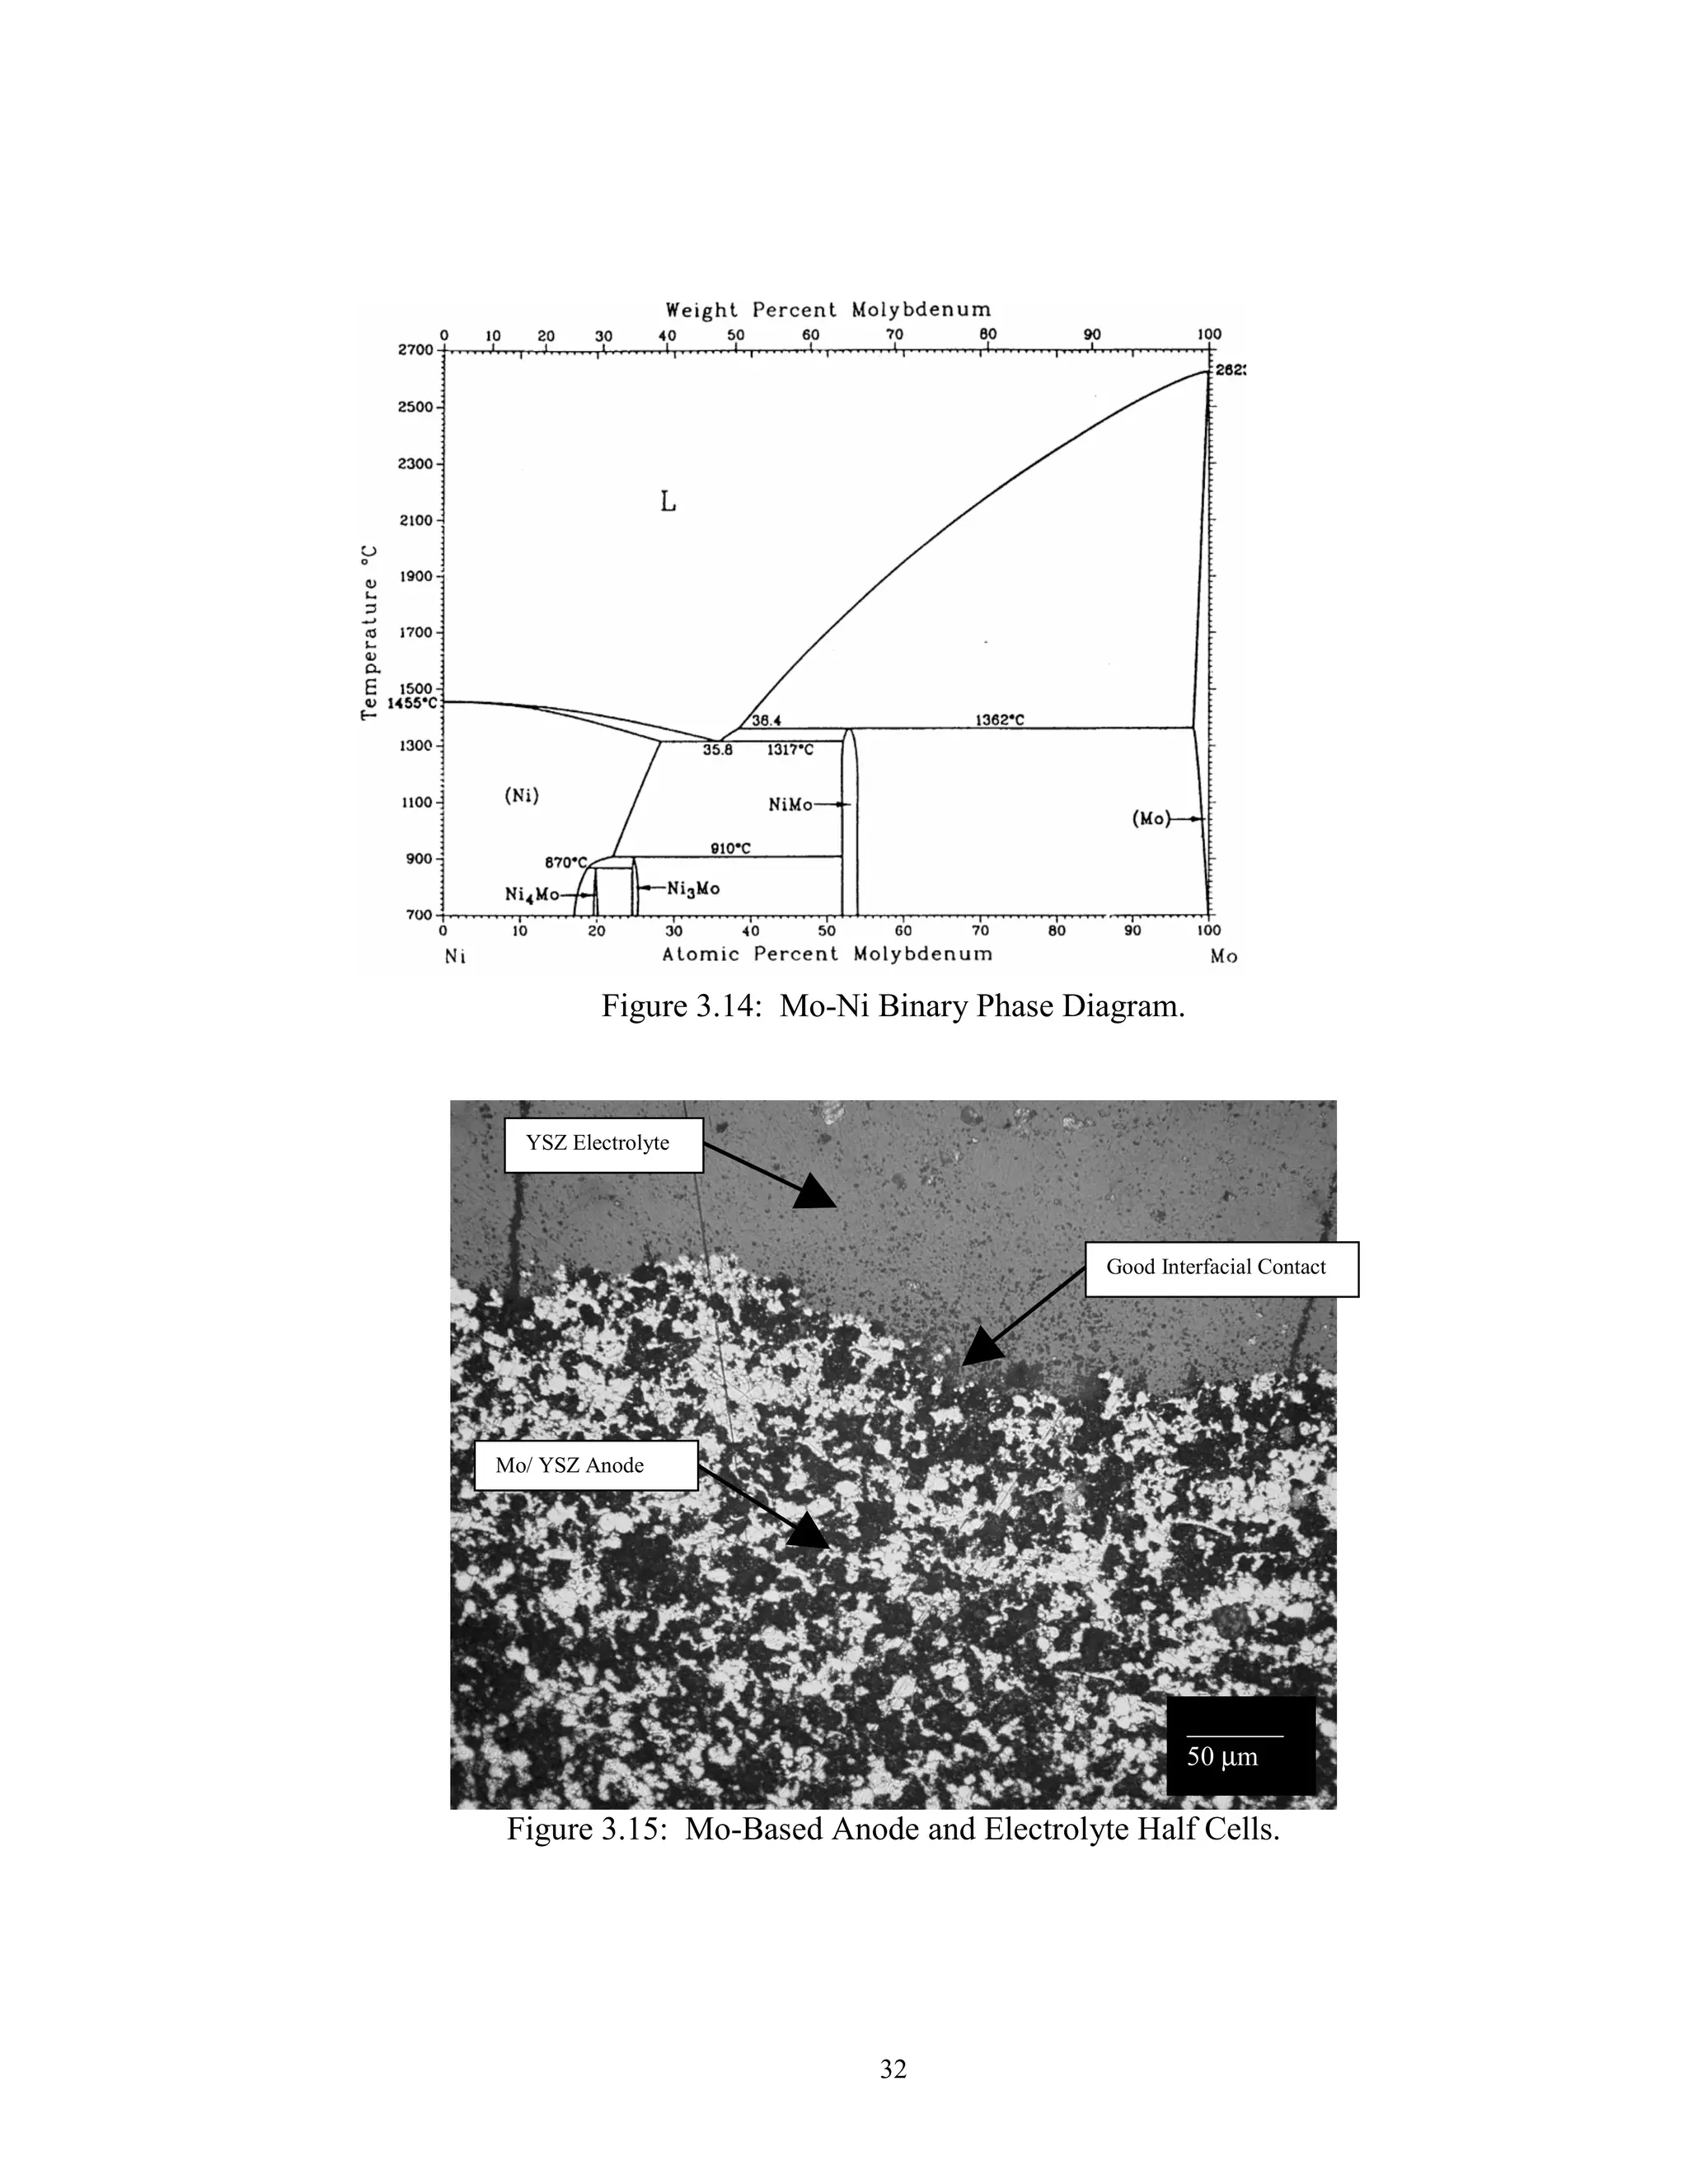
Ni to the pure Mo. Examination of the Mo-Ni phase diagram, Fig. 3.14 [52], shows a
maximum 3 wt% nickel solubility before the formation of a Mo-Ni intermetallic.
Therefore an anode composition of slightly greater than 3 wt% Ni in Mo was used for the
metallic composition of the anode.
The Mo/ YSZ anode and YSZ electrolyte powders were layered and hot pressed
at 1100°C, 2500 psi, with a 30 min hold time. The resultant microstructure represents a
good balance of uniformity, distribution and pore size (Fig. 3.15). The relative density of
the electrolyte remains the same as when pressed alone. The anode, when pressed in
tandem, showed adequate porosity and pore distribution for a SOFC electrode.
Interfacial contact was excellent, with no boundary interactions evident.](https://image.slidesharecdn.com/sofcsingle-stepjan062003-180904234325/75/ORNL-Sub-94-SS112-04-Development-of-Hot-Pressing-as-a-Low-Cost-Processing-Technique-for-Fuel-Cell-Fabrication-36-2048.jpg)
![39
Appendix B
MOLYBDENUM BASED ANODE MAXIMUM FUEL UTILIZATION
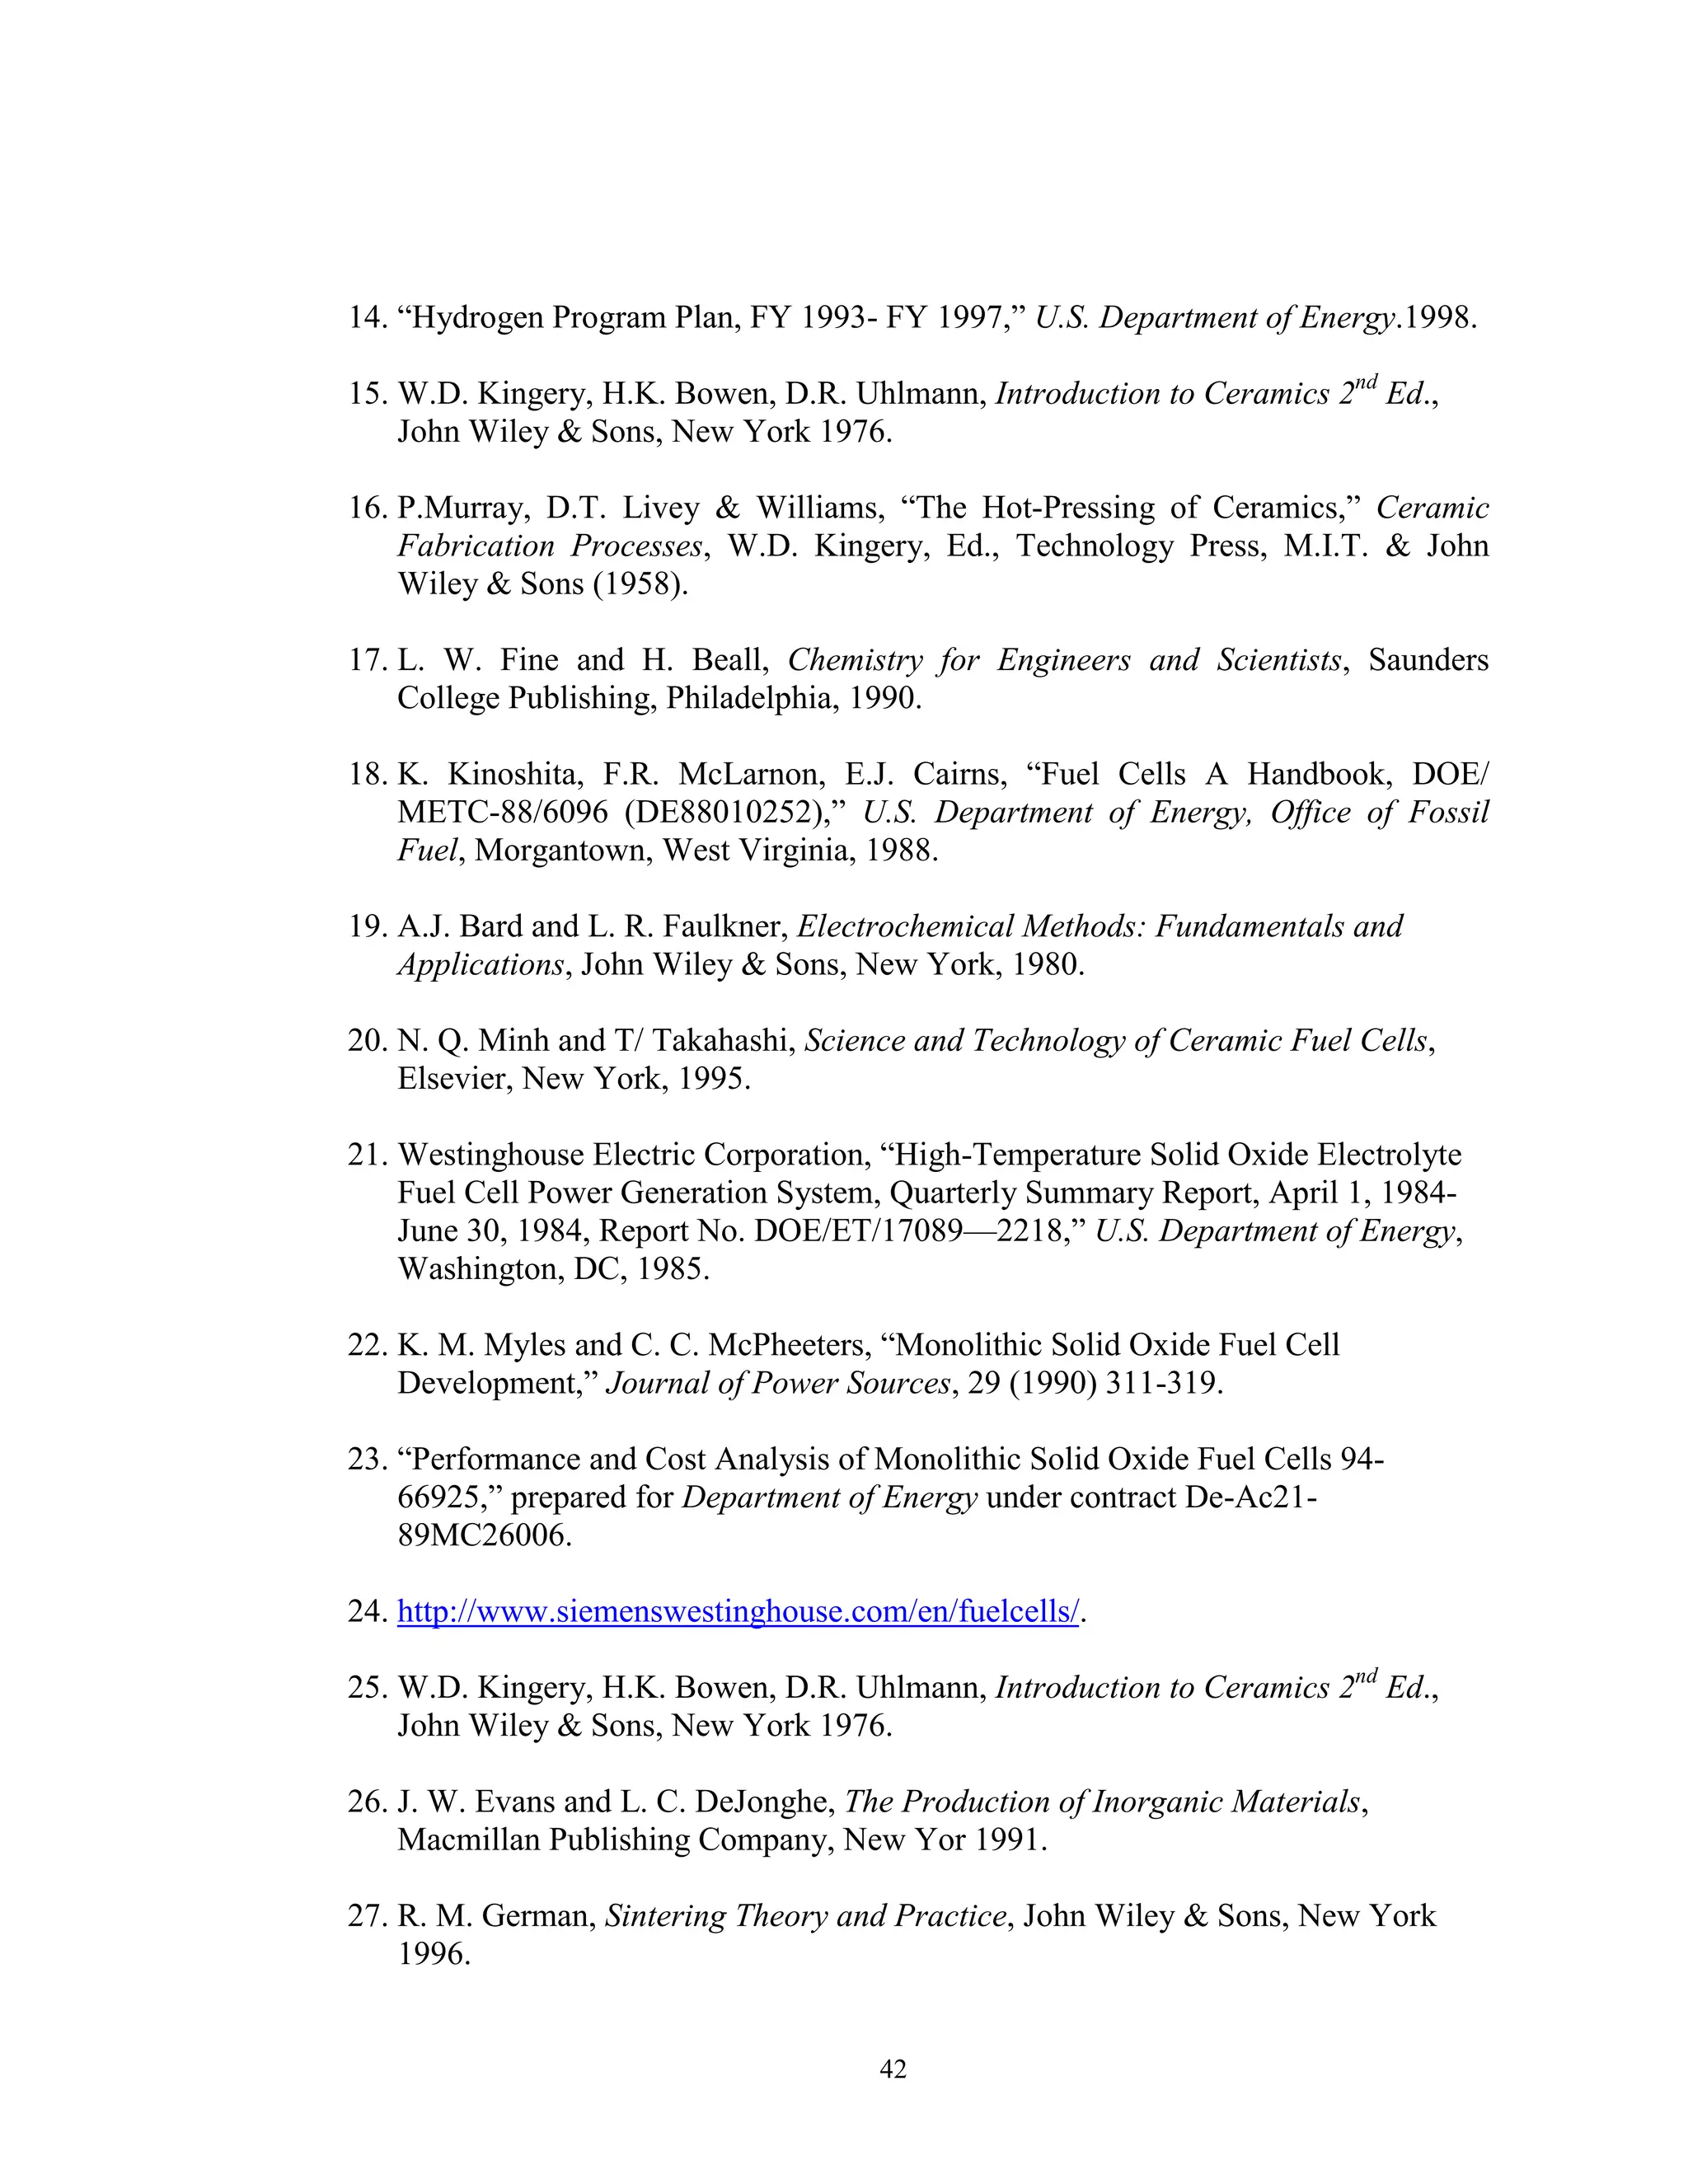
Fuel Utilization (U) refers to the fraction of the total fuel or oxidant introduced
into a fuel cell that reacts electrochemically, it is described in eq. B.1. For a
Molybdenum based anode the maximum amount of hydrogen consumed is controlled by
the oxidation limit of water vapor in the surrounding atmosphere before Molybdenum
dioxide forms. Therefore this was first determined.
In
Consumed
In
OutsIn
f
H
H
H
HH
U
,2
,2
,2
,,2
=
−
= (B.1)
The oxidation limit of Molybdenum was found according to eq. B.2. The
maximum water vapor content of the surrounding atmosphere was found using eq. B.4
eq. B.5 and eq. B.6.
Mo + 2 H2O (g) = MoO2 + 2 H2 (g) (B.2)
=
OH
H
P
P
K
2
2
2
2
1 = 1.589 (at 1000°C [52] (B.3)
2
1
2
2 *7933.0 H
H
OH P
K
P
P == (B.4)](https://image.slidesharecdn.com/sofcsingle-stepjan062003-180904234325/75/ORNL-Sub-94-SS112-04-Development-of-Hot-Pressing-as-a-Low-Cost-Processing-Technique-for-Fuel-Cell-Fabrication-44-2048.jpg)

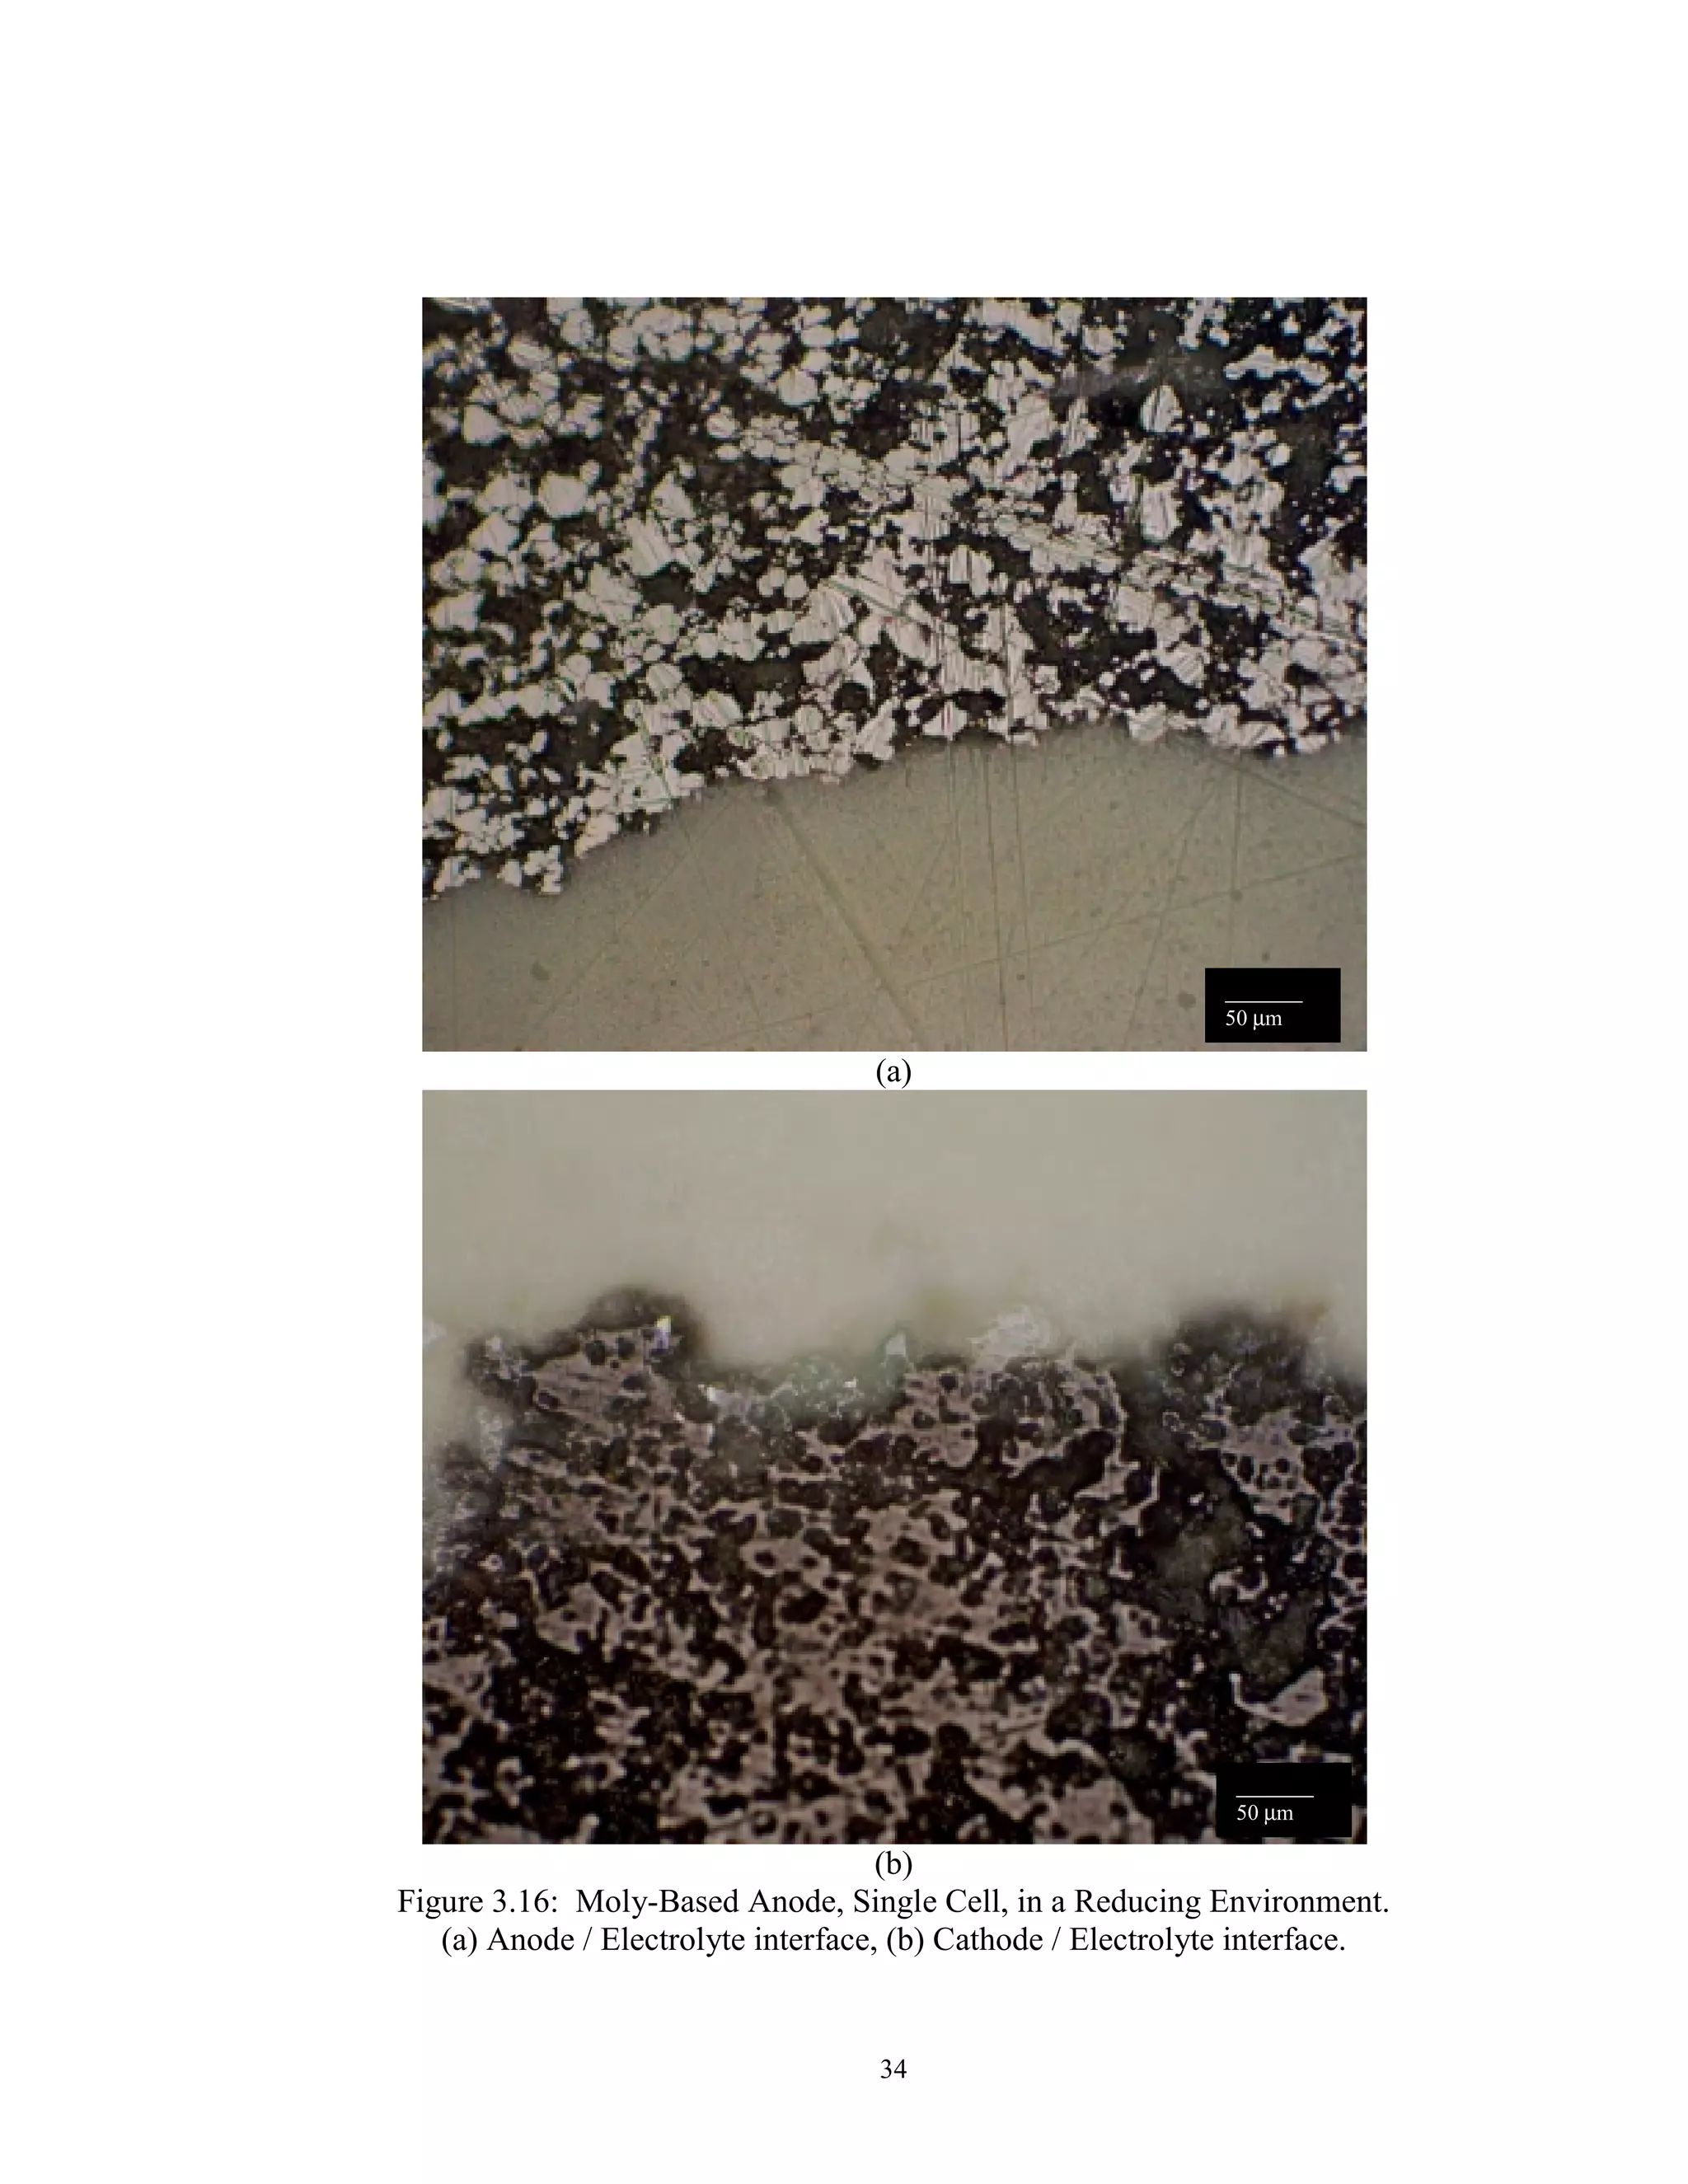
This report details the development of hot pressing as a low-cost processing technique for manufacturing solid oxide fuel cells (SOFCs), aiming to address high capital and operational costs that hinder commercialization. It highlights the advantages of this novel technique, such as reducing manufacturing steps and improving interfacial contact, which leads to lower polarization losses. The research includes experimental methods and findings that establish the feasibility of hot pressing for SOFC fabrication, focusing on essential parameters like temperature, pressure, and processing cycles.


