Downloaded 89 times


![Master Project. Arturo Veiga López 25
2. Development of a SOFC electrolyte with ESD technique
2.1. Introduction and Objectives
The current section will briefly describe the rationale behind the selection of the
Electrostatic Spray Deposition (ESD) technique to build a Solid Oxide Fuel Cell and the
basic concepts of this methodology.
Based on the results of the Thesis called “Electrostatic spray deposition of Solid Oxide
Fuel Cell electrolyte” [He, 2013] it is feasible to achieve a 100% dense YSZ layer using
the ESD technique. Moreover, the control of the porosity of the sprayed layer with
other materials provides with the opportunity to build an anode and cathode with the
same technique, which should be porous to maximize the surface in contact with the
gases in the fuel cell. However, this is not without challenges. We will cover those
challenges and how to overcome them in the following sections.
The overall objective of these experiments is to advance the knowledge of the
properties of the sprayed layer and to face the challenges in long-time sprays and
other materials. The ultimate goal of this research is the development of a complete
fuel cell with the solely use of the ESD technique in several steps of spray and sinter
the several layers of a fuel cell.
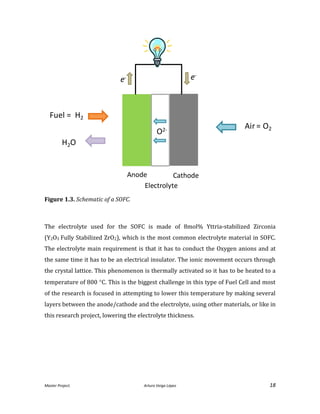
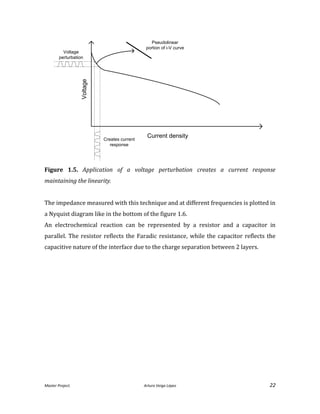
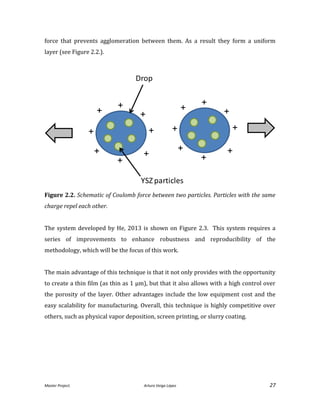
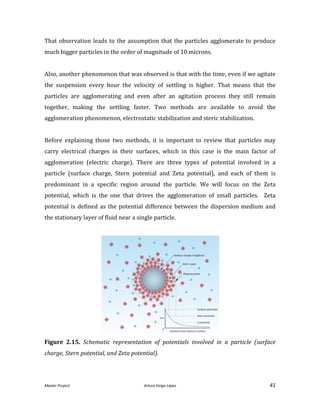
ESD is essentially a coating technique that uses a liquid to create a suspension where
nanoparticles of the material which we want to coat our surface with are dissolved
into (see Figure 2.1. for details).](https://image.slidesharecdn.com/masterthesissofc-140320150426-phpapp02/85/Master-Thesis-SOFC-25-320.jpg)
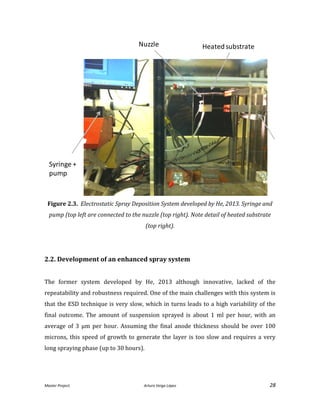
![Master Project. Arturo Veiga López 31
With this tube we cannot apply a pressure to the system so the flow rate will be only
imposed by the electric field and not by the syringe. That also poses the following
challenge; to maintain the suspension level by guessing the flow rate sprayed. Because
of this phenomena and the poor results obtained trying to prevent this vacuum, this
system was not implemented.
Electric field
Another problem that directly affects the spray stability is the uniformity of the
electric field. The electric field is the driving force of the spray; any distortion of the
electric field affects directly shape of the spray. This represents a complex challenge,
because the electric permittivity is directed affected by the concentration,
distribution, and nature of the particles sprayed. In the original design [He, 2013], a
plastic disk was placed in the middle of the nuzzle. This disk allows to concentrate the
electric field in the upper part of the nuzzle, that is a perfect cylinder, blocking the rest
of the possible electric field of the rest of the nuzzle.
To improve this approach a grounded Faraday cage was built to ensure the electric
field, that comes from any other part that is not the last 0.5 inches of the nuzzle, is
cancelled.
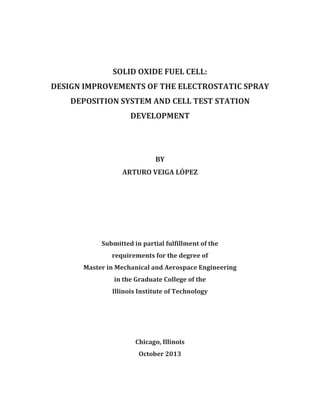
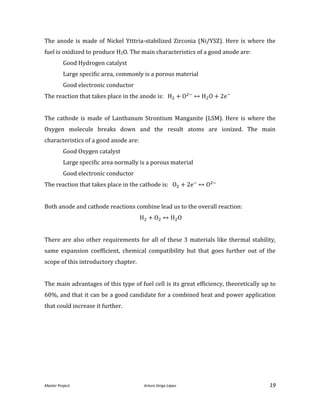
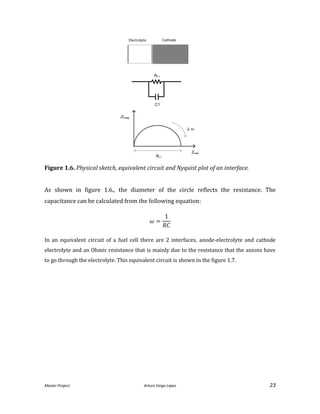
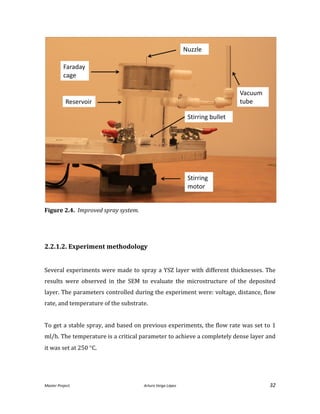
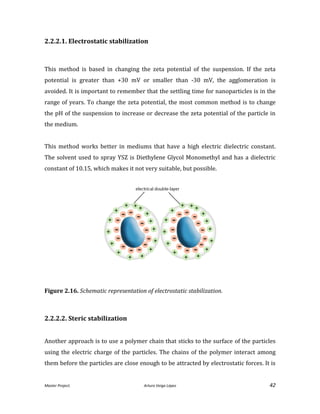
All of the above descried systems were designed and built specifically for this project
(see improved design in Figure 2.4.). They were made as compact as possible and met
the requirements and needs of material compatibility. The system adapted the design
of the original design [He, 2013] in terms of the chamber, the positioning, and the
heating system. The design was developed using the software PRO-E a CAD software.](https://image.slidesharecdn.com/masterthesissofc-140320150426-phpapp02/85/Master-Thesis-SOFC-31-320.jpg)
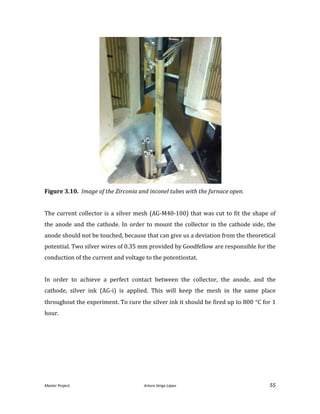
![Master Project. Arturo Veiga López 35
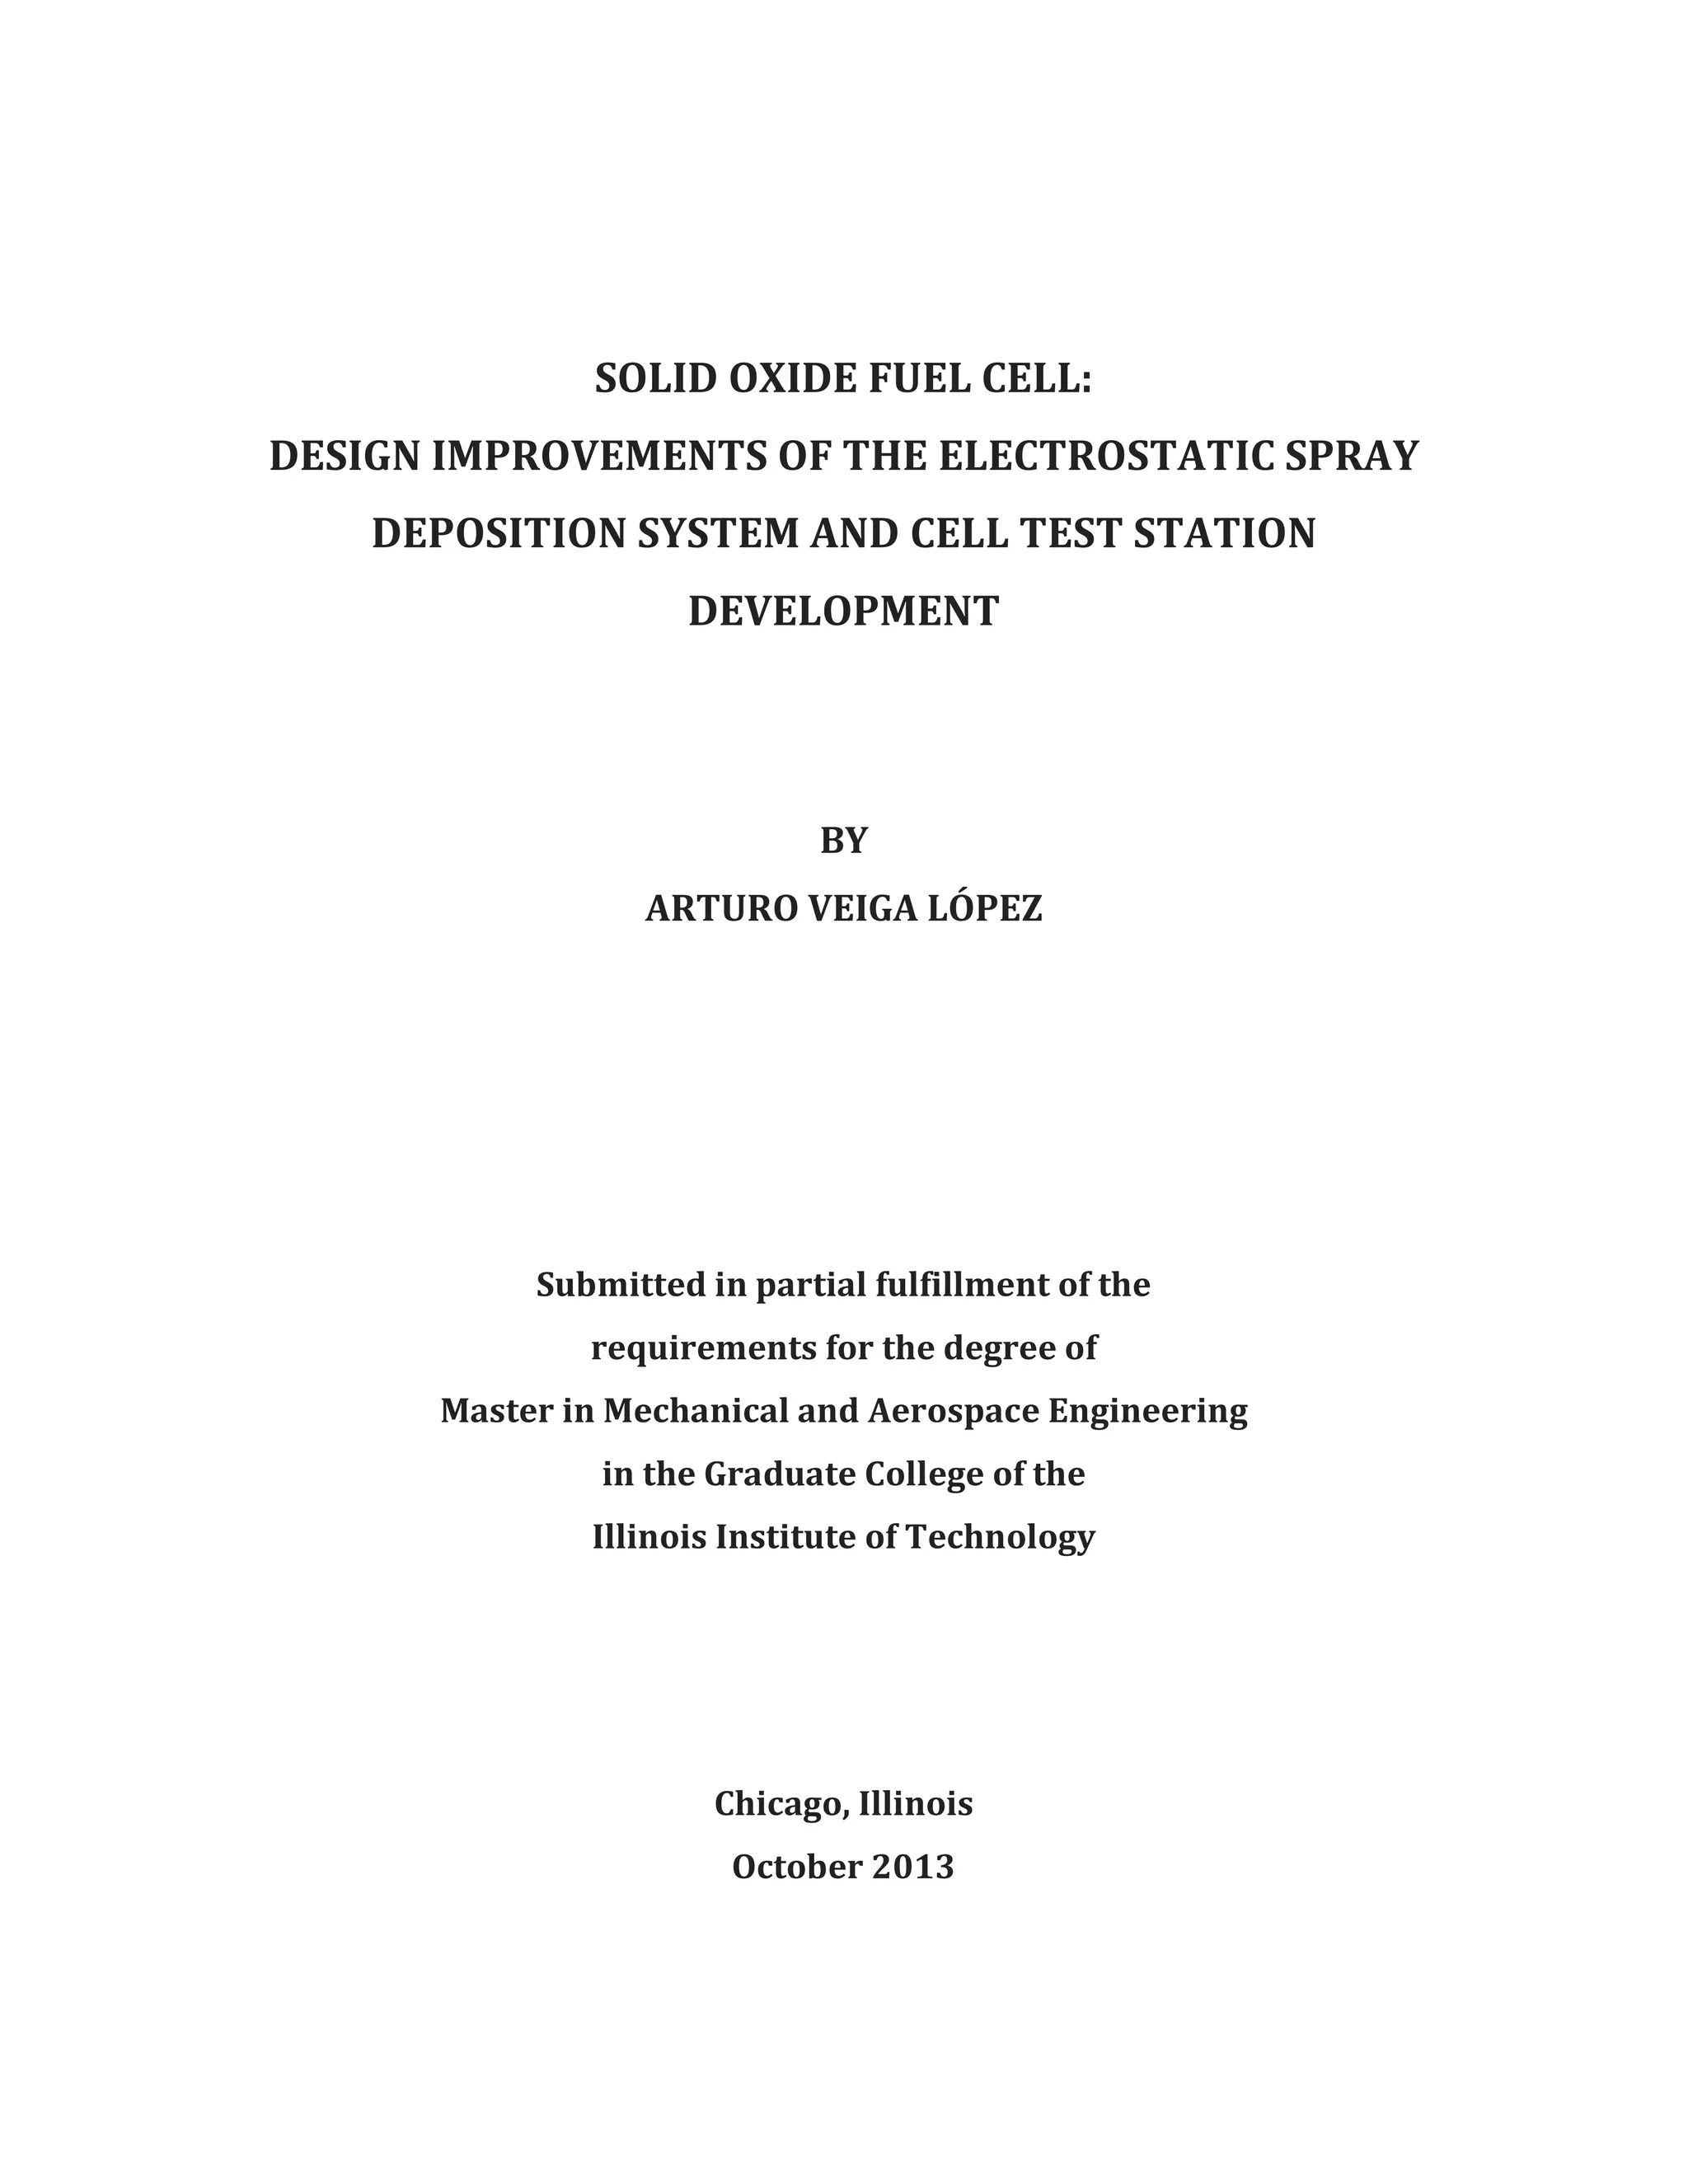
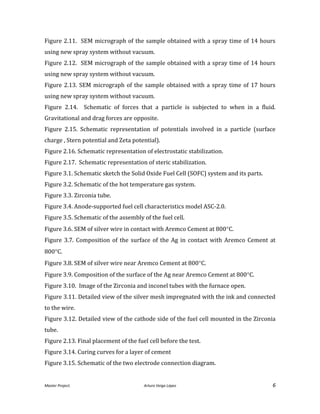
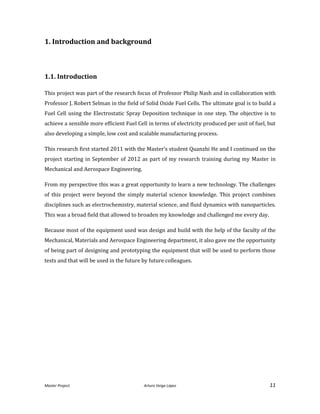
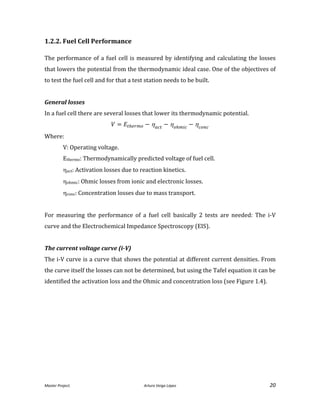
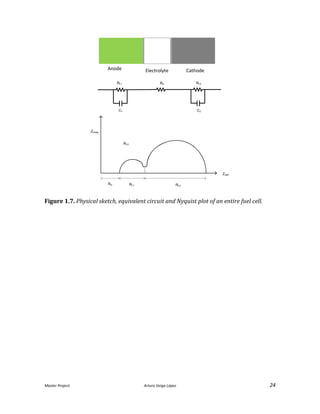
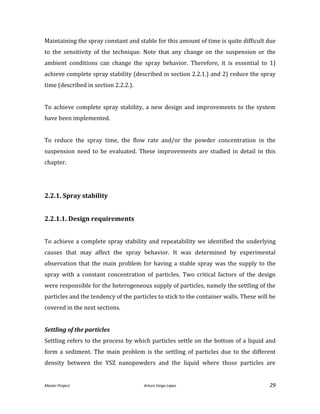
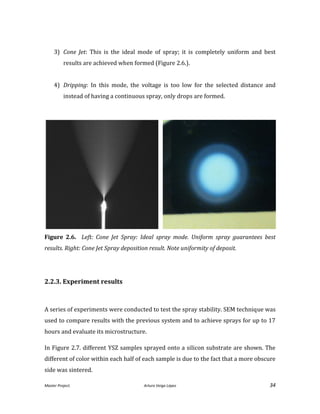
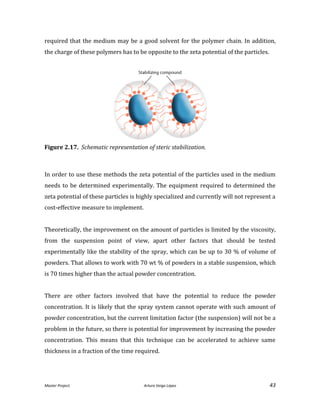
Figure 2.7. Different samples of YSZ sprayed onto a silicon substrate.
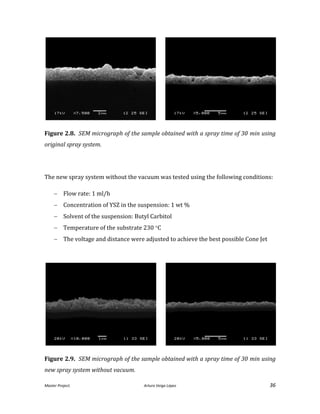
To evaluate the results in terms of density and uniformity after the sinterization, the
samples obtained were compared to the original system [He, 2013]. Figure 2.8. shows
a SEM micrograph obtained after the use of the original system. Some pores are
evident, but most of them will disappear with the sinter process.](https://image.slidesharecdn.com/masterthesissofc-140320150426-phpapp02/85/Master-Thesis-SOFC-35-320.jpg)
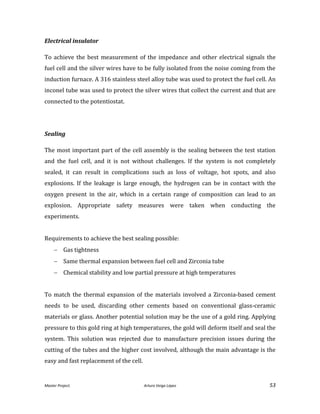
![Master Project. Arturo Veiga López 54
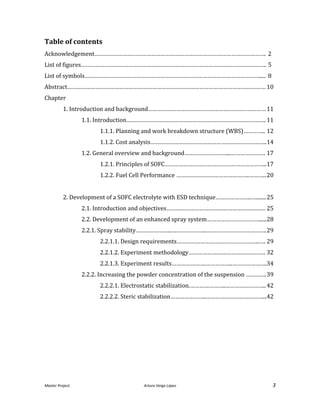
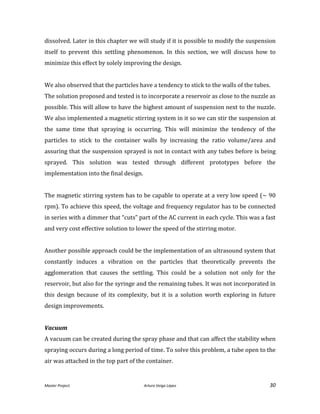
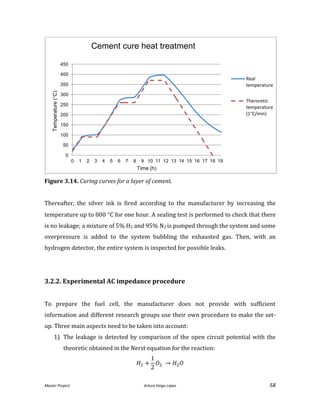
A Zirconia-based cement (Ceramabond 885) provided by Aremco was used. The main
problem encountered in this sealant is that it forms a porous layer. The easy diffusion
of H2 through the layer requires to apply several layers (up to 4) and to cure them
successively to achieve a good sealing and prevent any H2 leakage.
3.2. Preparation of the experiment
3.2.1 Assembly process of the fuel cell
The assembly of this cell is a critical step in the fuel cell testing and in order to achieve
a good result is crucial to have a perfect assembly of the system. The literature is
scarce regarding fuel cell assembly. This methodology used was based on the results
of the Thesis called “Characterization of porous SOFC Electrodes” [Hslao, 1996] and
was specifically adapted and improved for this design.
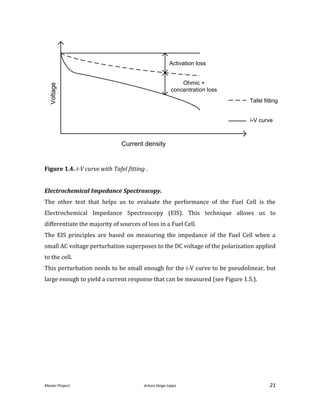
To make the process easier and time effective when it comes to test more than one
cell, 1 inch of the Zirconia tube was cut to mount the fuel cell. Then, the other side was
pasted with the same cement to the Zirconia tube. This also allows to have more space
to take the silver wire connected to the anode outside of the system. After that,
another collector is placed in the cathode side and pasted with the silver ink.](https://image.slidesharecdn.com/masterthesissofc-140320150426-phpapp02/85/Master-Thesis-SOFC-54-320.jpg)
![Master Project. Arturo Veiga López 68
4. Conclusions
The current research work focuses on the principles of fuel cells and specifically, the
parameters that measure the performance of a solid oxide fuel cell.
A rigorous study has been developed to improve the original Electrostatic Spray
Deposition (ESD) spray system, a new technology to develop a efficient solid oxide
fuel cell. This original EDS spray system was developed in the Thesis: “Electrostatic
spray deposition of Solid Oxide Fuel Cell electrolyte” [He, 2013]. The improvements
developed in the current project focused on enhancing the efficiency of the EDS spray
by achieving a better spray stability.
To increase the stability, and in turn the efficiency of the EDS spray, a more
homogeneous supply of particles is required. This is controlled by two main factors:
the settling of the particles and the tendency of the particles to stick to the container
walls. Several experiments were specifically designed to test these two aspects and
included improvements of the original design that targeted the following aspects:
- Include a reservoir under the nuzzle.
- Avoid the vacuum produced during the spray.
- Create a more uniform electric field.
Several prototypes described in Chapter 2 were developed to test the results of the
above-mentioned aspects. The finished system was tested spraying layers of YSZ up to
14 hours and 70 microns of thickness and we can conclude that this system is
appropriate to produce a stable spray system for YSZ and that the desired thickness
can be obtained varying the deposition time.
Because reducing the spray time is critical to achieve a complete stable spray, a
theoretical analysis was developed to increase the percentage of particles in the
suspension.](https://image.slidesharecdn.com/masterthesissofc-140320150426-phpapp02/85/Master-Thesis-SOFC-68-320.jpg)
![Master Project. Arturo Veiga López 70
References
[He, 2013] He, Quanzhi. “Electrostatic Spray Deposition of Solid Oxide Fuel Cell
Electrolyte”. Thesis. Illinois Institute of Technology, 2013.
[Hslao, 1996] Hsiao, Yin-Chang. “Characterization of Porous SOFC Electrodes”. Thesis.
Illinois Institute of Technology, 1996.
O'Hayre, Ryan, Suk-Won Cha, Withey Colella, and Fritz B. Prinz. Fuel Cell Fundamentals.
Hoboken, NJ: John Wiley & Sons, 2006.
Varma, Ravi, and Robert Selman, eds. Techniques for Characterization of Electodes and
Electrochemical Processes.: Willey Interscience, 1991. The Electrochemical Society.
Nakajima, Hironori. "Electrochemical Impedance Spectroscopy Study of the Mass
Transfer in an Anode-Supported Microtubular Solid Oxide Fuel Cell." Mass Transfer -
Advanced Aspects. N.p.: Intech, 2011. 285-304.
Nomura, Hiroshi, Sandeep Parekh, Robert Selman, and Said Al-Hallaj. "Fabrication of
YSZ Electrolyte Using Electrostatic Spray Deposition (ESD):I – a Comprehensive
Parametric Study." Journal of Applied Electrochemistry (2005): 61-67.
Nomura, Hiroshi, Sandeep Parekh, Robert Selman, and Said Al-Hallaj. "Fabrication of
YSZ Electrolyte for Intermediate Temperature Solid Oxide Fuel Cell Using Electrostatic
Spray Deposition: II – Cell Performance." Journal of Applied Electrochemistry(2005):
1121-126.
Xiao, Haiming, and Thomas Reitz. "Anode-Supported Solid Oxide Fuel Cells with Thin
Film Electrolyte for Operation at Reduced Temperatures." ECS Transactions (2006).](https://image.slidesharecdn.com/masterthesissofc-140320150426-phpapp02/85/Master-Thesis-SOFC-70-320.jpg)

The document presents a master's project focused on improving the design and functionality of solid oxide fuel cells (SOFCs) through enhancements in electrostatic spray deposition (ESD) techniques and the development of a testing station. Key findings indicate that the modified ESD system successfully produces stable YSZ layers and that the test station effectively evaluates SOFC performance, affirming its design validity. The research aims to advance fuel cell efficiency and manufacturing methods while integrating various scientific disciplines.