Downloaded 19 times


![15
Fuel Cell Use World Wide
Fuel cells were developed for the space program and have been used since the late
1950s to provide electricity and drinking water for astronauts. Terrestrial applications
can be classified into categories of transportation, stationary or remote generation uses.
Transportation
Automobile emissions remain one of the largest contributors to urban air
pollution. Worldwide, over one billion people living in urban areas are suffering from
poor air quality, leading to over 700, 000 deaths annually [1]. Estimates from the EPA
[2] indicate that motor vehicles in the US still account for
78% of all Carbon Monoxide emission
45% of Nitrogen Oxide emissions
37% of Volatile Organic Compounds
Offsetting the impact of modern lower emission gasoline vehicles engines are the
growth in the number and size of vehicles on the road, as well as an increase in the
number of miles each vehicle travels. If recent trends continue, Americans will be
driving twice as many miles in 2015 as today [3]. Low gasoline prices also do not](https://image.slidesharecdn.com/bumsthesisschumacherjan2003-180904230629/85/ONE-STEP-PROCESS-FOR-SOLID-OXIDE-FUEL-CELL-FABRICATION-15-320.jpg)
![16
encourage fuel efficiency or conservation. Rather, the number of sport utility vehicles
market share is continuing to rise therefore increasing the number of less efficient
vehicles on the road.
Bills such as the 1990 Clean Air Act and the National Energy Policy Act of 1992
paved the way for less polluting gasoline vehicles and the introduction of alternative fuel
vehicles on the roads in the US. Also, in 1990, the California Air Resources Board
recognized that even the cleanest gasoline powered vehicles wouldn’t satisfy the state’s
goals for higher air quality. Meeting state and federal air standards in seriously polluted
area such as Los Angeles would require either restrictions on driving or a large scale
switch to vehicles that don’t pollute. California adopted the Low Emission Vehicle Act
that mandated the seven largest auto makers begin immediately to reduce all tailpipe
emissions and to introduce zero emission vehicles (ZEVs) starting in 1998. Beginning in
2003, 10% of new vehicles sold in CA will be required to be ZEVs or nearly ZEVs - also
known as “equivalent ZEVs” [4]. The California Air Resources Board believes, “the
remarkable developments of fuel-cell engines will help California in its war on smog as
well as provide new consumer choices for transportation.”
Because of the legislative initiative taken by California and subsequent similar
regulations imposed by a number of states in the Northeast, every major automobile
manufacturer has made significant progress toward the development of ultra-low and
zero emission vehicles. This legislation has promoted and encouraged the development
of fuel cells as an energy source. Fuel cells operate at 2-3 times the efficiency of modern
internal combustion engines. An improvement of 1-2 miles per gallon (MPG) is](https://image.slidesharecdn.com/bumsthesisschumacherjan2003-180904230629/85/ONE-STEP-PROCESS-FOR-SOLID-OXIDE-FUEL-CELL-FABRICATION-16-320.jpg)
![17
considered substantial in the automotive industry, if fuel cells could directly replace the
car engine, it would mean a 25 to 50 MPG increase in fuel efficiency.
Stationary
The utility sector is expected to be the first areas where fuel cells will be widely
commercialized. Today, only about one-third of the electrical energy produced reaches
the user because of the low energy conversion efficiencies of power plants. Using fuel
cells for utility applications will improve energy efficiencies by as much as 69% while
reducing emissions [5].
Fuel cell commercialization opportunities in the U.S. market are focused in
several large-scale areas: re-powering, central power plants, industrial generators, and
commercial/ residential generators.
The Department of Energy (DOE) predicts that 403 GW of new generating
capacity will be required by 2020 in the United States to replace existing units and meet
growing demand [6]. Both restructuring and rising capacity demands pose new
opportunities for fuel cell adoption in applications as diverse as merchant power plants,
industrial cogeneration plants, data center backup power, and even residential “garage
power” uses.
SOFCs are considered the only fuel cell technology with a wide span of possible
market applications ranging from 2-kilowatt residential systems to wholesale distributed
generation systems of 10-25 megawatts.](https://image.slidesharecdn.com/bumsthesisschumacherjan2003-180904230629/85/ONE-STEP-PROCESS-FOR-SOLID-OXIDE-FUEL-CELL-FABRICATION-17-320.jpg)
![18
Remote
Remote or “distributed power” is a new approach utility companies are beginning
to implement – small power generators located at or near the site of consumption provide
advantages for traditional utilities that own both generation and delivery systems. By
placing the power source near the load, the generator avoids energy losses—up to 5
percent of energy transported—via heat dissipation along the transmission and
distribution lines.
Because fuel cells are modular in design and highly efficient, these small units
can be placed on-site. Installation is less of a financial risk for utility planners and
modules can be added as demand increases. Utility systems are currently being designed
to use regenerative fuel cell technology and renewable sources of electricity. Fuel cells
are becoming an alternative choice for rural energy needs in places where there are no
existing power grids or where the power supply is often unreliable.
In a study released in July 2001, the Electric Power Research Institute (EPRI)
estimates that power interruptions and disturbances are responsible for as much as $188
billion in losses every year [7]. This figure can only increase, as more and more sensitive
equipment becomes an integral part of the overall economy. It is no longer possible to
ignore the implications of the reliability and overall quality of our electrical power
supply. Interruptions and disturbances in electric supply can shut down, damage, or even
destroy equipment. A $10 billion global industry has arisen to provide energy consumers
with the solutions they need to protect their operations and property [8].](https://image.slidesharecdn.com/bumsthesisschumacherjan2003-180904230629/85/ONE-STEP-PROCESS-FOR-SOLID-OXIDE-FUEL-CELL-FABRICATION-18-320.jpg)
![19
Depletion of the World’s Nonrenewable Fuel Reserves
The world’s production of oil reached a record level of 65 million barrels a day in
1997 and global demand is rising more than 2% per year. Americans spend roughly
$100, 000 per minute to purchase foreign oil [9], and the US transportation sector uses
over 10% of the world’s oil [9]. Consumption of oil by passenger vehicles, which
include automobiles and light duty trucks, exceeds all of the United States’ domestic
production of oil. Reserves of fossil fuels are large but finite, and there is growing
evidence to suggest that world production of crude oil will peak in the early 21st
century
[10]. Since 1985 energy use worldwide has increased 40% in both Latin America and
Africa and 50% in Asia [10].
The Energy Information Agency forecasts that worldwide demand for oil will
increase 60% by 2020[11]. By 2010, Middle East OPEC states, considered unpredictable
and often unstable, will have over 50% of the world oil business, and the switch from
growth to decline in oil production could cause economic and political tension [12]. As
excess oil production capacity begins to decline over the coming decades, oil prices can
be expected to rise. The transportation sector is likely to be most heavily affected by
these fluctuations. World wide, transportation relies almost exclusively on oil, and there
are few viable short-term options.
The introduction of fuel cells will increase fuel efficiency, decrease foreign oil
dependency, and become an important strategy/ technology to mitigate climate change.
In the future the combination of high efficiency fuel cells and fuels from renewable](https://image.slidesharecdn.com/bumsthesisschumacherjan2003-180904230629/85/ONE-STEP-PROCESS-FOR-SOLID-OXIDE-FUEL-CELL-FABRICATION-19-320.jpg)
![21
fuel adaptability, and very low levels of NOx and SOx emissions. The quiet, vibration-
free operation of fuel cells also eliminates the noise usually associated with conventional
power generating systems.
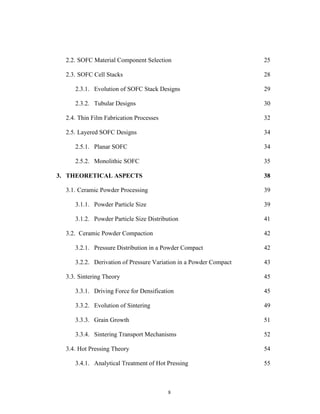
Fuel Cell Types
There are several types of fuel cells, typically classified by the nature of the
electrolyte; these include Polymer Electrolyte Membrane (PEM), Alkaline (AFC),
Phosphoric Acid (PAFC), Molten Carbonate (MCFC) and Solid Oxide (SOFC). A
summary of the different fuel cells can be seen in Table 1.1.
Figure 1.1: Comparison of Developing Fuel Cells [13].](https://image.slidesharecdn.com/bumsthesisschumacherjan2003-180904230629/85/ONE-STEP-PROCESS-FOR-SOLID-OXIDE-FUEL-CELL-FABRICATION-21-320.jpg)
![22
Among these fuel cells types, the PEM is being developed mainly for space and
transportation applications, and the AFC is an important power source on space flights.
The PAFC is presently at the initial stage of commercialization for electric utility and
cogeneration uses. The MCFC is the next most likely candidate for commercialization,
whereas the SOFC is considered third-generation, or the youngest fuel cell technology in
development.
Development of SOFC as a Superior Design
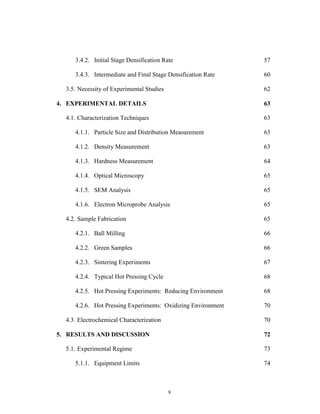
The current commercial leader in electrical energy generating technology is the
gas turbine power plant, due to the low capital cost associated with the device. Fuel cells
are compared against the gas turbine and other large scale energy generating devices in
Table 1.2. Although the gas turbine is presently the least capital intensive, the long term
operating cost is much higher both economically and environmentally [14].
SOFCs show the greatest potential for efficient power generation. High operating
temperatures promote rapid reaction kinetics, allow reforming of hydrocarbon fuels
within the fuel cell, and produce high quality byproduct heat suitable for use in
cogeneration or bottoming cycles. A bottoming cycle is used to generate additional
electricity using fuel cell byproduct heat in a gas turbine or steam engine. Cogeneration
uses the fuel cell byproduct heat for space heating, to supply hot water, or to generate
steam for industrial purposes. Configured in the co-generation format, efficiencies
approaching 70% are projected [13].](https://image.slidesharecdn.com/bumsthesisschumacherjan2003-180904230629/85/ONE-STEP-PROCESS-FOR-SOLID-OXIDE-FUEL-CELL-FABRICATION-22-320.jpg)
![23
Figure 1.2: Selected Energy Generating Devices [13]
Also, SOFCs exhibit high power-to-weight ratio since they are made of light-
weight-thin-film ceramic materials. Lower manufacturing times are obtained for SOFCs
since the units are modular in nature and can be assembled on site; and the solid-state
structure can be easily transported as compared to alternative fuel cells.
SOFC additionally have several advantages over alternative fuel cells mostly
arising from the use of a solid electrolyte. The use of a solid electrolyte in ceramic fuel
cells eliminates material corrosion and electrolyte management problems and permits
unique cell designs with performance improvements over other fuel cells. The
conductivity requirement for ceramic electrolytes necessitates high operating
temperatures (600° to 1000°C). Because of the high operating temperature of SOFCs,
natural-gas and other hydrocarbon fuels can be reformed within the cell stack eliminating
the need for expensive external reformer system.](https://image.slidesharecdn.com/bumsthesisschumacherjan2003-180904230629/85/ONE-STEP-PROCESS-FOR-SOLID-OXIDE-FUEL-CELL-FABRICATION-23-320.jpg)
![25
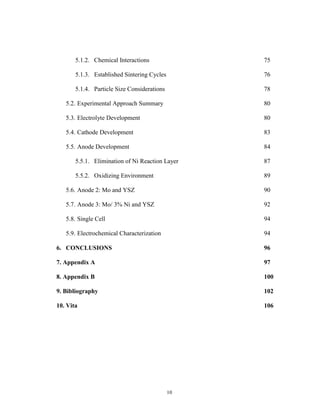
to be competitive with current power generating devices. There is a limit to the premium
that customers will be willing to pay for environmentally friendly power or even higher
efficiencies. The current cost goal of $400 per kilowatt can only be met by improved
processing techniques.
Figure 1.3: Cost Comparison of Selected Power Generating Systems [13].
Some of the most energy intensive and expensive fabrication processes, for any
SOFC stack design, are the high temperature sintering steps. Batch processes, in the
tubular and planar designs, use repeated thermal cycling steps to sinter successive layers
upon previous ones. The monolithic design improves upon this approach by co-firing all
layers in a cell in one step, thereby eliminating the batch processing. However, the
monolithic design incorporates extensive post process non-destructive testing and
evaluation due to the complex geometries and multiple shrinkage rates encountered
during processing. This extraneous post testing substantially increases the overall
fabrication cost.](https://image.slidesharecdn.com/bumsthesisschumacherjan2003-180904230629/85/ONE-STEP-PROCESS-FOR-SOLID-OXIDE-FUEL-CELL-FABRICATION-25-320.jpg)
![26
Therefore an improved fabrication process is desired, which would reduce or
remove the number of separate batch processes required to produce a SOFC without
adding extreme post process testing.
This is the approach currently being undertaken at Boston University (BU).
Researchers at BU have shown preliminary results using an alternative ceramic
processing technique to eliminate batch, without the added geometrical complexity of the
monolithic design.
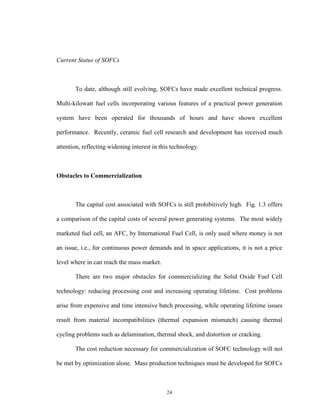
Hot Pressing
Hot pressing is the simultaneous application of elevated temperature and
compressive stress to consolidate fine green pressed powders into partially or fully
sintered components. The technique, shown in Fig. 1.4, was developed for the powder
metallurgy industry and has been successfully applied to ceramic components over the
last several decades [14, 15]. Pressure increases the driving force for densification, in
effect, reducing the processing temperature required for a sintering process. Also, hot
pressing results in smaller overall grain size, more precise control over the microstructure
and the flexibility of functionally grading the ceramic layers.](https://image.slidesharecdn.com/bumsthesisschumacherjan2003-180904230629/85/ONE-STEP-PROCESS-FOR-SOLID-OXIDE-FUEL-CELL-FABRICATION-26-320.jpg)
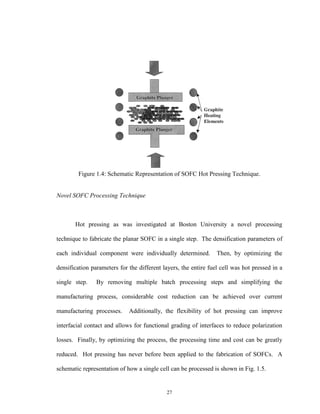
![33
The ideal standard potential of an H2/O2 fuel cell, EO, is 1.229 volts with liquid
water product and 1.18 volts with water as a gaseous product. This value is known as the
oxidation potential of H2 [17]. The potential across the electrodes is directly related to
the change in Gibbs free energy for the reaction of hydrogen and oxygen.
The relation of EO to cell temperature is shown in Fig. 2.2. As the operating
temperature increases the reversible potential decreases, therefore operation at lower
temperatures gives a theoretical advantage in output voltage.
Figure 2.2: H2/ O2 Fuel Cell Ideal Potential as a function of Temperature [after 18].
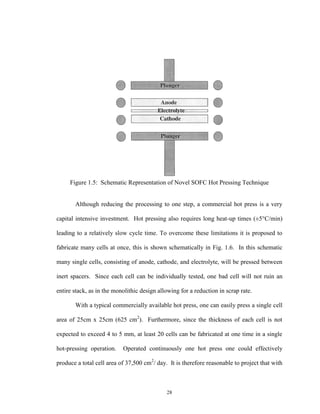
Useful work (electrical energy) is obtained from a fuel cell only when reasonable
current is drawn. However the actual cell potential is decreased from its equilibrium
potential because of irreversible losses as this current is drawn, this effect is shown in
Fig. 2.3. Several sources contribute to irreversible losses in fuel cells. These losses,
called polarization, overpotential, or overvoltage, , originate primarily from three
sources: activation polarization, act, ohmic polarization, ohm, and concentration](https://image.slidesharecdn.com/bumsthesisschumacherjan2003-180904230629/85/ONE-STEP-PROCESS-FOR-SOLID-OXIDE-FUEL-CELL-FABRICATION-33-320.jpg)
![34
polarization, con. These losses result in a cell voltage, V, for a fuel cell that is less than
its ideal potential, E, as shown in eq. 2.2.
TotalEV (2.2)
The activation polarization loss is dominant at low current density. Charge
transfer barriers have to be overcome prior to current and ion flow. Activation losses
show some increase as current increases.
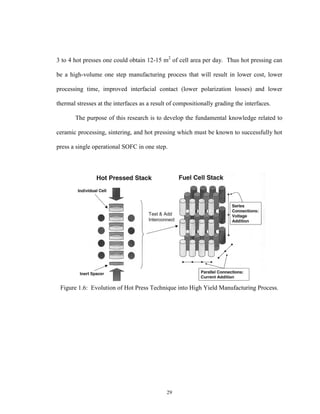
Figure 2.3: Ideal and Actual Fuel Cell Voltage/ Current Characteristic [after 18].
A gas transport loss, or concentration polarization, occurs assuming that gas
transport is slower than the rate of O2-
ion consumption. Concentration polarization
occurs over the entire range of current densities, but these losses become prominent at
high limiting currents where it becomes difficult to provide reactants to and from the cell
Limiting
Current
Density](https://image.slidesharecdn.com/bumsthesisschumacherjan2003-180904230629/85/ONE-STEP-PROCESS-FOR-SOLID-OXIDE-FUEL-CELL-FABRICATION-34-320.jpg)
![36
For large positive or negative values of , one of the exponential terms in eq. 2.3
becomes negligible. Then eq. 2.3 can be simplified to the Tafel equation (eq. 2.4, or 2.5).
For example, at large negative overpotentials, exp [-nf] >> exp [(1-) nf] yields,
nfii o exp (2.4)
or ibai
nf
RT
i
nf
RT
o loglnln
(2.5)
Tafel plots (Fig. 2.4) provide a visual understanding of the activation polarization
of a fuel cell. They are used to measure the exchange current density and the electron
transfer coefficient. The exchange current density is given by the extrapolated intercept
at Act = 0 which is a measure of the maximum current that can be extracted at negligible
polarization. The transfer coefficient is simply equal to the slope of the plot.
Figure 2.4: Example of a typical Tafel plot [after 18].](https://image.slidesharecdn.com/bumsthesisschumacherjan2003-180904230629/85/ONE-STEP-PROCESS-FOR-SOLID-OXIDE-FUEL-CELL-FABRICATION-36-320.jpg)
![38
phase mass transfer leads to the formation of a concentration gradient. Concentration
polarization, conc, is represented (as a voltage) mathematically in eq. 2.7, where iL is the
limiting current, as shown in Fig. 2.4 above.
l
conc
i
i
nF
RT
1ln
(2.7)
The net result of current flow in a fuel cell is to increase the anode oxygen
chemical potential and to decrease the cathode chemical potential, thereby reducing cell
voltage. For further information on electrochemical testing please see Bard and Faulkner
[19].
SOFC Material Component Selection
The material property requirements for high-temperature (600-1000°C) Solid
Oxide Fuel Cells are quite stringent. The electrolyte must have high oxygen ion
conductivity (0.1-0.01 S/cm), negligible electronic conductivity, be stable in both
oxidizing and reducing conditions and remain dense and impervious to gas. The porous
and gas-permeable cathode and anode must have high electronic conductivity and charge
transfer/surface exchange kinetics (>10-7
cm/s). The cathode must be stable in oxidizing
conditions, while the anode must be stable in reducing conditions and both must be
chemically, mechanically, and structurally compatible with the electrolyte and](https://image.slidesharecdn.com/bumsthesisschumacherjan2003-180904230629/85/ONE-STEP-PROCESS-FOR-SOLID-OXIDE-FUEL-CELL-FABRICATION-38-320.jpg)
![39
interconnect materials. The interconnect material must be an electronic conductor,
remain dense and impervious to separate the anodic and the cathodic regions, be stable in
both reducing and oxidizing conditions, and be chemically, mechanically and structurally
compatible with the anode and the cathode materials.
SOFC materials have been studied extensively in the development of these
devices [20]. Current state of the art SOFCs components are shown in Table 2.5. A
convention SOFC electrolyte is 8 molar percent (mol %) yttria stabilized zirconia (YSZ),
a known oxygen ion conductor with negligible electronic conductivity at SOFC operating
temperatures.
The anode is fabricated from a nickel (Ni)/ YSZ cermet. For proper operation the
anode must contain minimum 30 volume percent (vol %) Ni and 20-40% porosity for gas
permeability.
Table 2.5: State of the Art SOFC Components.](https://image.slidesharecdn.com/bumsthesisschumacherjan2003-180904230629/85/ONE-STEP-PROCESS-FOR-SOLID-OXIDE-FUEL-CELL-FABRICATION-39-320.jpg)
![40
The cathode is made from A-site, i.e., La site, doped lanthanum manganite
(LaMnO3). Typically strontium is used as the dopant, in which case it is abbreviated
LSM. The cathode also requires 20-40% porosity for gas phase mass transfer. Large
internal electrode surface area, i.e., controlled, fine, uniformly distributed porosity, is also
desired to enhance reaction kinetics.
Finally, the interconnect is made of A/B site doped lanthanum chromate
(LaCrO3). LaCrO3 is chemically stable in reducing and oxidizing atmospheres.
(a) (b)
Figure 2.6: SEM Micrograph of a Conventional SOFC [21].
Cross sections of the state of the art Siemens-Westinghouse SOFC are shown in
Fig. 2.6a and Fig. 2.6b. In these secondary electron (Fig. 2.6a) and backscattered
electron (Fig. 2.6b) images, the cathode, electrolyte and anode are labeled AE (air
electrode), E (electrolyte), and FE (fuel electrode), respectively. The fully dense YSZ
electrolyte is approximately 60-80 m in thickness. Also note the irregular boundaries](https://image.slidesharecdn.com/bumsthesisschumacherjan2003-180904230629/85/ONE-STEP-PROCESS-FOR-SOLID-OXIDE-FUEL-CELL-FABRICATION-40-320.jpg)
![43
design, a modification of the segmented in series design, incorporated a cylindrical thin
wall electrolyte. The cylindrical configuration allows for the sealless nature of the
design. In 1982, the monolithic design was proposed and developed by Argonne
National Labs. In this design the cells are arranged in a honeycomb like structure, where
the cells act as a baffle and manifold in addition to their normal duties [22].
Currently, the sealless tubular design, having surpassed the segmented in series
design, is the most advanced. Numerous improvements to the tubular design have been
made in the last 5 -10 years. Also, there has been renewed interest in the flat plate, or
planar design, arising from new advances in ceramic processing and forming. The
monolithic design, although having extraordinarily high power density has seems to be
reaching fewer and fewer developmental milestones [23].
Only the tubular, planar and monolithic designs are relevant to the current
research, these designs will be elaborated on in the following sections.
Tubular SOFCs
The most advanced construction for SOFCs is the Siemens -Westinghouse tubular
design (Fig. 2.7). Multi kilowatt stacks have been fabricated and operated for thousands
of hours. The tubular construction can be assembled into large units without seals. The
sealless nature and its robust design are this configurations biggest engineering
advantages.](https://image.slidesharecdn.com/bumsthesisschumacherjan2003-180904230629/85/ONE-STEP-PROCESS-FOR-SOLID-OXIDE-FUEL-CELL-FABRICATION-43-320.jpg)
![44
Figure 2.7: Siemens Westinghouse Tubular SOFC [24]
Expensive batch fabrication techniques like Electrochemical Vapor Deposition
(EVD) for the electrolyte, as shown in Table 2.8, result in a fairly high cost for this type
of cell. The use of such exotic processes necessitates the need for control over a number
of parameters, resulting in complicated and expensive stack manufacturing. In addition
to the financial burden imposed, these manufacturing techniques raise the difficulty of
adapting such a system on a commercial scale. The tubular geometry of these fuel cells
limits the specific power density, both on weight and volume basis, to low values while
the electron conduction paths are long and lead to high energy losses due to internal
resistance heating. For these reasons, other configurations are actively being pursued at
the present time.
COMPONENTS MATERIAL FABRICATION PROCESS
Air Electrode
Electrolyte
Interconnection
Fuel Electrode
Sr doped LaMnO3
YSZ
Mg Doped LaCrO3
NI-YSZ Cermet
Extrusion –Sintering
Electrochemical Vapor Deposition (EVD)
Plasma Spraying
Dip Coating followed by Sintering
Table 2.8: Tubular SOFC Fabrication Processes.](https://image.slidesharecdn.com/bumsthesisschumacherjan2003-180904230629/85/ONE-STEP-PROCESS-FOR-SOLID-OXIDE-FUEL-CELL-FABRICATION-44-320.jpg)
![45
Before the planar and monolithic designs can be explained fully, current thin
ceramic film fabrication processing used in their construction must be briefly presented.
Thin Film Fabrication Processes
A common ceramic thin film fabrication process is tape casting, shown in Fig.
2.9. A ceramic slip, or slurry is made by combining the desired processed powder, with a
solvent, typically an alcohol, and organic surfactants, dispersants, and stabilizers. This
solution is then spread over a tempered glass bed which is coated with a carrier film. The
thickness of the slurry coating is controlled by two or more doctoring blades which
spread and scrape excess slurry from the bed. This green layer is then carefully heated, to
remove organics, and fired in a controlled sintering cycle. These layers are typically
applied individually, demanding a batch processing approach to layer fabrication.
Figure 2.9: Tape Casting [20].](https://image.slidesharecdn.com/bumsthesisschumacherjan2003-180904230629/85/ONE-STEP-PROCESS-FOR-SOLID-OXIDE-FUEL-CELL-FABRICATION-45-320.jpg)
![46
A second ceramic thin film fabrication process is tape calendaring, shown in Fig.
2.10. In this process similar ingredients as tape casting are kneaded into a much thicker
semi-fluid state. This dough like slurry is then fed between rollers yielding a thin 2D
structure. A second rolling operation can mechanically bond individual layers into a
single multilayer structure. This structure can be cut, laminated, corrugated, or formed
prior to firing. Compression molding is used to make the corrugated structure. For a
reliable, robust layer, a carefully controlled combination of temperature, pressing
pressure, pressing time, material consistency, and tape thickness must be used.
Figure 1.10: Tape Calendaring [20].
The advent of these and similar processes have allowed rapid improvement in the
manufacturability and quality of thin ceramic layers.](https://image.slidesharecdn.com/bumsthesisschumacherjan2003-180904230629/85/ONE-STEP-PROCESS-FOR-SOLID-OXIDE-FUEL-CELL-FABRICATION-46-320.jpg)
![47
Layered SOFC Designs
Layered designs are some of the most simple, yet they can be the most cost
efficient and most manufacturable. They are fabricated using standard thin film ceramic
processes such as tape casting, for planar cells, and tape calendaring, for monolithic cells.
Planar SOFC
The most common alternative construction to the tubular design is the planar
design, which resembles a cross-flow heat exchanger, shown in Fig. 2.11. The planar
cross flow fuel cell is built from alternating flat single cell membranes, which are tri-
layer anode/ electrolyte/ cathode structures, and interconnection plates, which conduct
current from cell to cell and provide channels for gas flow.
Figure 2.11: Planar SOFC in Cross-flow Configuration [20].](https://image.slidesharecdn.com/bumsthesisschumacherjan2003-180904230629/85/ONE-STEP-PROCESS-FOR-SOLID-OXIDE-FUEL-CELL-FABRICATION-47-320.jpg)
![49
inactive manifolding found in the planar design resulting in an extremely light, compact,
and high power density design.
(a) (b)
Figure 2.12: Monolithic SOFC in Co-Flow (a)and Cross-flow (b) Configurations [20].
The advantages of the monolithic design are small cell size and high power
density. The thin components allow for short current pathways, leading to much smaller
resistive losses. This allows the monolithic design to be operated at higher current
densities, for a given voltage, than competing designs.
The major disadvantage of the monolithic stack is fabricating the complex design
consistently and reliably. Current processing techniques involve tailoring thermal
mismatches and shrinkage rates so the corrugated structure can be co-fired. This design
requires extensive testing prior to operating, to ensure cell integrity.
The fabrication of the monolithic co-fired cell is a complex endeavor. It entails
controlling, adjusting and monitoring many sometimes inversely related parameters at](https://image.slidesharecdn.com/bumsthesisschumacherjan2003-180904230629/85/ONE-STEP-PROCESS-FOR-SOLID-OXIDE-FUEL-CELL-FABRICATION-49-320.jpg)
![50
once. For example, reducing particle size, to increase sinterability, may result in more
shrinkage, and possibility cracking due to the increase in specific surface area due to the
smaller particles. The amount of binders, volume loading, and particle surface area must
be stringently controlled. Green state parameters must be controlled to minimize thermal
expansion mismatch during cycling. Initial and final process parameters for the
monolithic SOFC firing cycle can be seen in Fig. 2.13.
Figure 2.13: Firing Shrinkage as a Function of Temperature for Monolithic Powders
[20].](https://image.slidesharecdn.com/bumsthesisschumacherjan2003-180904230629/85/ONE-STEP-PROCESS-FOR-SOLID-OXIDE-FUEL-CELL-FABRICATION-50-320.jpg)
![53
different results, none is basically more “correct” than the others. Several methods of
characterization can be found in the literature [25, 26, 27].
In the same way that the “size” of a particle requires definition, the “average size”
of a series of particles may be subject to several interpretations unless carefully defined.
The average calculated particle size, daverage, depends on the weight given to the factors
of: (a) number, (b) length, (c) surface, and (d) weight or volume of the particles of
different sizes. The average may be defined by eq. 3.1 where y is the percentage of the
total number, length, surface, or volume represented by the particles of diameter dn.
100
* n
average
dy
d (3.1)
There are several established methods for measuring particle size including,
sieving, microscopy, sedimentation, sensing zone techniques, x-ray line broadening, and
light scattering. Information on these and other techniques can be found in the literature
[26, 27]. Optical microscopic methods may be used for particles size down to 0.5
micron. The microscopic method of determining of an entire range of particle size
distribution suffers from the difficulty that reasonably precise microscopic counts are
laborious. Also, it can be difficult to determine how much material is present that is
smaller than the limit of the resolution of the microscope. Microscopic determination of
separated fractions is particularly important as a check on the screening or sedimentation
calibration and efficiency, as well as shape and other particle characteristics. Electron
microscopy is similarly useful down to much smaller particle sizes, and is unique in its](https://image.slidesharecdn.com/bumsthesisschumacherjan2003-180904230629/85/ONE-STEP-PROCESS-FOR-SOLID-OXIDE-FUEL-CELL-FABRICATION-53-320.jpg)
![55
sizes is reduced. In general, a narrower range of particles can be obtained by
precipitation or calcination. Higher calcination temperatures give larger particle sizes
and also a broader particle size distribution [28].
Ceramic Powder Compaction
The firing behavior of ceramic compact depends on the proximity of ceramic
particles relative to each other. It is convenient to conceptualize the compact as porosity
size and distribution.
Pressure Distribution in a Powder Compact
Pressure affects the firing behavior of ceramic compacts. The pressure
distribution will decay as a function of depth from the location of the applied stress. This
effects may be due to: (a) decrease in pore size and better particle contact, (b) strain
energy added due to plastic flow, (c) strain energy added due to particle interlocking, or
(d) fracture of particles at contact points. The first and last are the only effects of
importance for most ceramic composites [28].
The main deleterious effect of pressure variation within a cold pressed compact is
the corresponding differences in green bulk density. These variations will cause non-
uniform shrinking resulting in distortion or warping during firing as high densities are
obtained [29]. Final porosity variations are due to pressure variations throughout the](https://image.slidesharecdn.com/bumsthesisschumacherjan2003-180904230629/85/ONE-STEP-PROCESS-FOR-SOLID-OXIDE-FUEL-CELL-FABRICATION-55-320.jpg)
![56
piece. For a simple cylindrical sample, pressure variations in general increase as the
length-diameter ratio increases [30]. Length-to-diameter ratios greater than unity begin
to cause serious problems [31].
Resistance to compaction arises from collapsing bridges, or neck formations and
wall friction. After bridges collapse, further increases in densification may occur by
means of plastic deformation or crushing particles at the contact points. Kamm,
Steinberg, and Wulff, have shown that the major and almost entire cause of pressure
variation is the wall friction. By spraying two layers of a stearic acid lubricant on the
mold walls, complete elimination of pressure variations was obtained. However no
improvement of properties was obtained by adding lubricant to the powder [32].
Derivation of Pressure Variation in a Powder Compact
A first approximation of the mathematical relationships governing pressure
variations in a powder compact can be derived relatively easily.
Assume a cylindrical powder compact of length, l, and diameter, D, is uniaxially
compressed by double action plungers, each applying pressure, Po, as shown
schematically in Fig. 3.1. If we take an arbitrarily thin disc, of thickness dx, at a distance
x from the top plunger, then a force balance on the disc will yield eq. 3.2a and eq. 3.2b.
(3.2a)
0)(
44
22
dxDdPP
D
P
D
F XXXX
](https://image.slidesharecdn.com/bumsthesisschumacherjan2003-180904230629/85/ONE-STEP-PROCESS-FOR-SOLID-OXIDE-FUEL-CELL-FABRICATION-56-320.jpg)
![63
Figure 3.5: Consolidation Stages of a Sintered Powder Compact [27].
During the initial stages of sintering, the predominant feature is an increase in the
interparticle contact areas with time, accompanied by a rounding-off of the sharp re-
entrant angles formed at the points of contact, allowing neck growth to begin.
As the growing necks merge, the intermediate stage of sintering begins. During
this stage the original particulate structure disappears and is replaced by that of a poly
crystalline body of intergranular porosity, although the pores still remain interconnected.
During this stage, grain growth usually occurs as the pores shrink and may take the form
of discontinuous growth in which certain grains grow rapidly at the expense of neighbors.
Ultimately, during the final stage of sintering, the pore network is broken into
isolated pores. Further densification results from the shrinking of these pores.
Throughout the sintering process pores have remained in their original positions. Over
time some pores may become isolated from the grain boundary, increasing the vacancy
diffusion distance. Since pores far removed from the grain boundary are only eliminated
through much slower lattice diffusion the rate of sintering greatly diminishes.](https://image.slidesharecdn.com/bumsthesisschumacherjan2003-180904230629/85/ONE-STEP-PROCESS-FOR-SOLID-OXIDE-FUEL-CELL-FABRICATION-63-320.jpg)
![66
Figure 3.6: Sintering Transport mechanisms [after 27].
Mechanisms involving bulk transport, such as grain boundary diffusion, volume
diffusion and dislocation creep, move material by decreasing the distance between
particle centers. Mechanisms involving surface transport, evaporation/condensation,
volume coarsening, and surface diffusion, move material without bringing the particle
centers closer.
Each of these type of mechanisms are important depending on the end goal. If the
goal is fully dense material, the quickest route is to sinter in a regime in which only
densifying mechanisms are prevalent. To control amount and distribution of porosity,
non densifying mechanism regimes are important.](https://image.slidesharecdn.com/bumsthesisschumacherjan2003-180904230629/85/ONE-STEP-PROCESS-FOR-SOLID-OXIDE-FUEL-CELL-FABRICATION-66-320.jpg)
![67
Hot Pressing Theory
The driving force for sintering is the excess free energy of the powder over that of
a solid. In contrast to increasing the temperature, hot pressing increases the driving force
for densification rather than the driving force for diffusion. By applying pressure rather
than temperature, hot pressing can limit particle coarsening during sintering, resulting in
more efficient densifcation. Estimates of this increase in driving force can reach 1 to 2
orders of magnitude higher than sintering at the same temperature [29].
Diffusion occurs whenever a powder compact is brought to an adequate
temperature to activate the process. Hot pressing does not change the basic sintering
mechanisms; however it allows those mechanisms to be activated at lower temperature.
For example, in refractory carbides, sintering is generally performed at about 1350°C,
while hot pressing is accomplished at 1200°C [35].
Applied pressure can cause particle rearrangement (grain boundary sliding),
particle fracture, or plastic flow in a ceramic compact. These processes occur on a time
scale of seconds to tens of seconds, while the sintering process depends on a time scale of
minutes to hours, at least an order of magnitude larger time scale. Therefore the
governing mechanism in hot pressing is the same as in sintering: diffusion. Although
plastic flow and creep can be important in certain regimes, their effects are most
prevalent only at high applied pressures (greater than 5000 psi).](https://image.slidesharecdn.com/bumsthesisschumacherjan2003-180904230629/85/ONE-STEP-PROCESS-FOR-SOLID-OXIDE-FUEL-CELL-FABRICATION-67-320.jpg)
![68
Analytical Treatment of Hot Pressing
Falling a treatment by Coble [33], models for initial-, intermediate, and final-stage
densification under pressure explicitly including both surface energy and applied pressure
as driving forces will be presented. These densification mechanisms have been shown to
be important when small particles (1 m) and moderate pressures (1-5000 psi) are used
[34].
It is important to consider both applied pressure and surface tension driving forces
when the ratio of the two is approximately unity. The change in concentration, C, due
to applied pressure, Pa, divided by surface energy, , is given by eq. 3.13, where, R is the
particle radius size, and , represents pie. Assuming a moderate surface energy value of
103
ergs/ cm2
(1 J/ m2
), this ratio is plotted as a function of particle size and applied
pressure in Fig. 3.7. As this ratio increases the driving force for densification is
dominated by the applied pressure, as it decreases the driving force is dominated by
reduction of surface energy.
RP
C
C a
rgySurfaceEne
essureApplied
Pr
(3.13)
Four different particle size YSZ powders were hot pressed under the same
temperature and pressure conditions to demonstrate the relative effects of pressure vs.
particle size. The smallest particle size powder (0.2 m) densified to greater than 90%
relative density, while the largest powder (75 m), resulted in 70% relative density.
Micrographs of the densified YSZ powders are shown in Fig. 3.8.](https://image.slidesharecdn.com/bumsthesisschumacherjan2003-180904230629/85/ONE-STEP-PROCESS-FOR-SOLID-OXIDE-FUEL-CELL-FABRICATION-68-320.jpg)
![69
Figure 3.7: Particle Size and Pressure Regime in Hot Pressing.
(a) (b)
(c) (d)
Figure 3.8: Various Hot Pressed YSZ Powders.
YSZ particle sizes (a) 0.2 m (b) 3.5 m, (c) 25 m, and (d) 75 m.
1
10
100
1000
10000
100000
1000000
10000000
0.01 0.1 1 10 100 1000
Particle Radius [um]
Pressure[psi]
90% of Densification due to Applied Pressure 90% of Densification due to Particle Size
Pressure Dominated
Densification
Particle Size Dominated
Densification
Unity Line
50 m
___
50 m
___
50 m
___
50 m
___
50 m](https://image.slidesharecdn.com/bumsthesisschumacherjan2003-180904230629/85/ONE-STEP-PROCESS-FOR-SOLID-OXIDE-FUEL-CELL-FABRICATION-69-320.jpg)
![71
Figure 3.9: Initial Stage Densification of Sintering Compact [after 33].
The rate of volume change must be formulated from geometrical terms into
material property terms. Diffusive vacancy flux from neck surface to the grain boundary
can be expressed as eq. 3.18, where J/l is the flow per unit length of a cylinder, Dv is the
vacancy diffusion coefficient, C is the difference in vacancy concentration between the
surface of the control cylinder and the central axis. The length, l, is equal to the neck
radius for lattice diffusion or one half the grain boundary width, W/2, for boundary
diffusion.
CD
l
J
V 4 (3.18)
Multiplying by the vacancy volume, , and the specific neck length, or y, yields
eq. 3.19, for lattice diffusion, or eq. 3.20 for grain boundary diffusion. The densification
rate is now the integral of either of these equations depending on the controlling diffusive](https://image.slidesharecdn.com/bumsthesisschumacherjan2003-180904230629/85/ONE-STEP-PROCESS-FOR-SOLID-OXIDE-FUEL-CELL-FABRICATION-71-320.jpg)
![73
t
RP
kTR
D
R
x AL
3
4
32
(3.22)
t
kTR
D
R
x L
3
4
32
(3.23)
t
RP
kTR
D
R
x AB
4
6
96
(3.24)
t
kTR
D
R
x B
4
6
96
(3.25)
By comparing eq. 3.22 with eq. 3.23 or eq. 3.24 with eq. 3.25, it can be seen that
the applied pressure can be added to the surface energy as a driving force for initial stage
densification when multiplied by a dimensional constant (R/) involving the particle
radius. Thus, the explanation for hot pressing increasing the driving force for
densification but not diffusion can be seen from this mathematical standpoint.
Intermediate and Final Stage Densification Rate
The Nabarro-Herring [36] diffusion creep model has been modified for hot
pressing by a number of authors [34, 37, 38, 39]. Uncertainties arise in the calculation of
the effective stress as a function of porosity as the relationship is not precisely known.
There is a factor of 2 uncertainty in both effective stress and surface area/ path length,
yielding less than a factor of 4 uncertainty in densification rate. This equation cannot be
rigorously applied to predict time dependence of densification. However the modified](https://image.slidesharecdn.com/bumsthesisschumacherjan2003-180904230629/85/ONE-STEP-PROCESS-FOR-SOLID-OXIDE-FUEL-CELL-FABRICATION-73-320.jpg)
![74
diffusion creep model can be applied to approximate the instantaneous rate of
densification.
The Nabarro-Herring Creep equation (3.26) gives the uniaxial strain rate (d/dt)
which will be caused by lattice diffusion, Dl, under an applied stress, ; where G is the
grain size. For grain boundary diffusion, Db, the strain rate is given by eq. 3.27 [40],
where W is the grain boundary width. Both equations are derived for materials of
theoretical density.
kTG
D
dt
d L
2
3
40
(2.26)
kTG
WD
dt
d b
3
5.47
(2.27)
Either eq. 3.26 or eq. 3.27 could be used to approximate densification using the
effective stress in a porous mass, and the conversion of the relative strain rate to a
densification rate. However these equations would only be approximate for
instantaneous densification rate as mentioned above. Surface energy effects can be
included in eq. 3.26 and eq. 3.27 by added the pressure difference across the curved
interface to the effective stress. These equations can be approximately used for final
stage densification also [see 33].](https://image.slidesharecdn.com/bumsthesisschumacherjan2003-180904230629/85/ONE-STEP-PROCESS-FOR-SOLID-OXIDE-FUEL-CELL-FABRICATION-74-320.jpg)
![76
Chapter 4
EXPERIMENTAL DETAILS
Characterization Techniques
Several techniques were used to characterize the precursor powders and the post
sintered sample. These techniques will be briefly explained below; further information
can be found in the literature [27].
Particle Size and Distribution Measurement
Initial powder characteristics were, in some cases, provided by the manufacturers.
All sample particle sizes and distributions however, were measured using a Horibia
Particle Size Analyzer. This analyzer uses a laser light scattering algorithm to determine
particle size and distribution. Typically this process is repeated several times until results
converge to a reproducible level as recommended by the manufacturer.
Density Measurements](https://image.slidesharecdn.com/bumsthesisschumacherjan2003-180904230629/85/ONE-STEP-PROCESS-FOR-SOLID-OXIDE-FUEL-CELL-FABRICATION-76-320.jpg)
![80
Green pressing can be accomplished using binders, waxes and lubricants. Boron
Nitride (BN) was used exclusively as a die/ sleeve wall lubricant in some experiments.
The BN lubricants helped in particle repositioning and rearrangement during the pressing.
Although BN is a stable compound and frequently used [27], possible reactions between
BN and the component layers are not known at this time. Future work should investigate
possible interactions or more stable lubricants as substitutes.
Sintering Experiments
Sintering experiments were conducted in a Lindberg Blue three zone tube furnace.
A mullite or alumina tube was sealed on both ends by a pressure clamping fixture. This
seal allowed flexibility for thermal expansion while maintaining a hermetic seal. The
tube was evacuated with a Welch roughing pump down to approximately 100 mTorr.
Then the tube was backfilled with forming gas (Ar-5% H2) to atmospheric pressure.
During the experiment, forming gas was fed into the tube at a slight positive pressure.
Gas pressure and flow rate were controlled by an MKS 1141 mass flow controller. Any
reacted species and excess gas was forced through the vacuum pump to the exhaust.
In experiments where the oxygen particle pressure needed to be controlled, the
forming gas was bubbled through distilled water at room temperature (298 K). At this
temperature the water vapor concentration was set at 3%, and the H2O (l) to H2O (g)
equilibrium ensured an accurate and controlled oxygen partial pressure.](https://image.slidesharecdn.com/bumsthesisschumacherjan2003-180904230629/85/ONE-STEP-PROCESS-FOR-SOLID-OXIDE-FUEL-CELL-FABRICATION-80-320.jpg)
![81
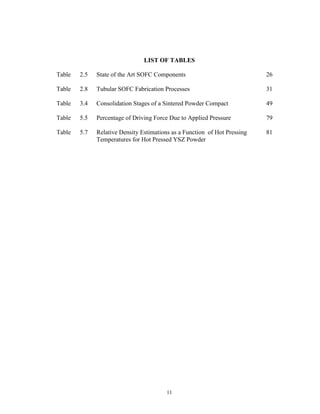
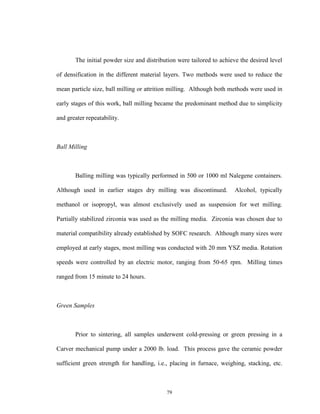
Typical Hot Pressing Cycle
The final hot pressed microstructure is controlled by three primary parameters:
temperature, pressure, and time. As shown in the theoretical section, temperature,
pressure, and time have decreasing amounts of effectiveness in changing the initial
microstructure.
An example of a pressured assisted sintering cycle for pore closure in cemented
carbide ceramics is plotted in Fig. 4.1. A key attribute is the simultaneous application of
maximum temperature and pressure. This cycle has been shown to give the smallest
open porosity [27]. This approach has been taken in this research to ensure a fully dense
electrolyte at the lowest temperature possible. Secondary parameters such as particle size
distribution, green density and added binders are ignored in this representation.
Hot Pressing Experiments: Reducing Environment
The experiments were conducted in a Centorr hot-press with graphite heating
elements resulting in a reducing environment. The chamber temperature was measured
with a ‘W’ type thermocouple and was also cross-checked with an optical pyrometer.
The pressure was calculated based on the applied load by the hydraulic pump on the ram
and the cross-sectional area of the die. The vertical movement of the ram was monitored
by a micrometer. The chamber was connected to a mechanical pump to obtain the](https://image.slidesharecdn.com/bumsthesisschumacherjan2003-180904230629/85/ONE-STEP-PROCESS-FOR-SOLID-OXIDE-FUEL-CELL-FABRICATION-81-320.jpg)
![87
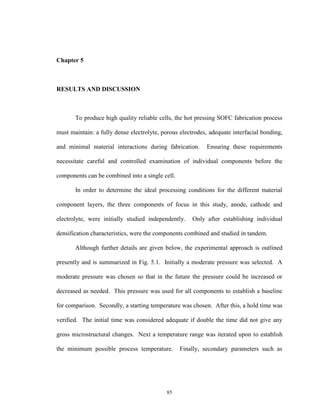
Equipment Limits
The maximum operating temperature of the graphite heating elements used in the
hot press was 2500C. Therefore 2500C was the absolute upper limit for the fabrication
temperature. All hot pressing experiments were initially conducted in a graphite die and
sleeve fixture. The reported maximum compressive stress of for high density, fine-
grained structural graphite is 15, 000 to 18, 000 psi, from room temperature to 2500C
[41]. Assuming a safety factor of 2/3, a maximum pressure limit of 10, 000 psi was
assigned. Therefore a pressure range of 0 to 10, 000 psi was used for these experiments.
This region was further divided into moderate pressure, 0- 5000 psi, and high pressure
5000-10, 000 psi. This is schematically summarized in Fig. 5.2.
Figure 5.2: Experimental Operating Regime.
0
500
1000
1500
2000
2500
3000
0 2000 4000 6000 8000 10000 12000
Pressure [psi]
Temperature[C]
High Pressure RegimeModerate Pressure Regime
Maximum HP Temperature
Maximum
Graphite
Compressive
Stress](https://image.slidesharecdn.com/bumsthesisschumacherjan2003-180904230629/85/ONE-STEP-PROCESS-FOR-SOLID-OXIDE-FUEL-CELL-FABRICATION-87-320.jpg)
![88
Chemical Interactions
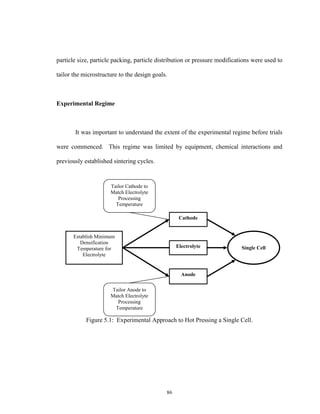
Chemical interactions between the components become important at higher
temperature. Therefore the maximum temperature before interactions begin was
established.
Thermodynamically, ZrO2 reacts with LaMnO3 to form insulating phases such as
La2Zr2O7 between the cathode and electrolyte, at temperatures above 1100C [42, 43, 44,
45]. Although the reaction kinetics of this reaction are slow, these insulating phases are
undesirable in SOFCs and must be minimized because they hinder electronic conduction
in the cathode causing cell performance to degrade significantly.
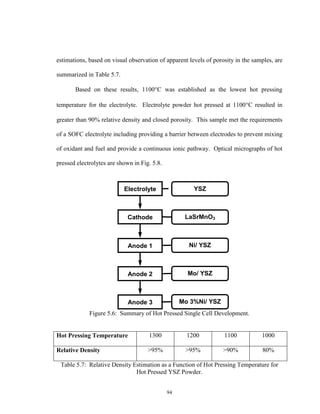
Figure 5.3: Practical SOFC Hot Pressing Experimental Regime
MP: 1880 C
500
1000
1500
2000
2500
3000
Temperature[C]
]
ElectrolyteCathode Anode Interconnect
La2Zr2O7 Formation
Mn +2 Diffusion NiCrO 4 Formation
MP: 2660 C
MP: 1453 C
MP: 2510 C](https://image.slidesharecdn.com/bumsthesisschumacherjan2003-180904230629/85/ONE-STEP-PROCESS-FOR-SOLID-OXIDE-FUEL-CELL-FABRICATION-88-320.jpg)
![89
Manganese is known to be a mobile species at high temperatures and can easily
diffuse into the electrolyte, changing the electrical characteristics or the structure of both
the cathode and the electrolyte [46]. Fabrication temperature was limited to below
1400C to minimize this migration. Also, above 1400C, Ni or NiO may react with the
LaCrO3 interconnect material to form poorly conducting phases such NiCrO4 [47].
Finally, elemental Nickel melts at 1453C. These facts suggested a maximum processing
temperature of 1400C, lower if possible. These facts, as well as the melting points of
the SOFC component materials are summarized in Fig. 5.3
Established Sintering Cycles
The monolithic fuel cell fabrication temperature using tape calendaring and
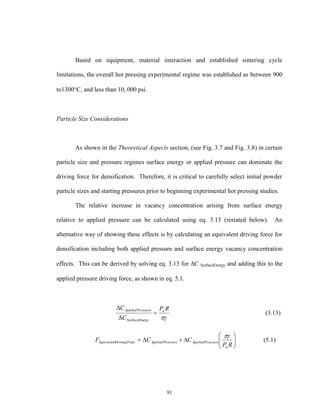
pressure-less sintering was reported to lie between 1300 and 1400C [27, 48].
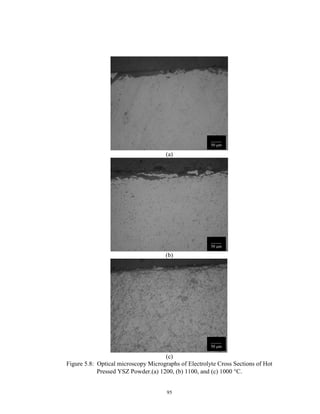
Zirconia powder, of 0.1 m mean diameter, was sintered to 98% theoretical
density at 1300C in air [50]. YSZ powders of sub-micrometer size were formed into a
green body (about 50% green density) and fired to 95% theoretical density in air at
1125C [51]. These data suggest a starting point for hot pressing zirconia to full density
of 1100C to 1300C.
Nickel powder, of 0.5 m particle size, was sintered at 800C to 98% theoretical
density [49]. This suggests that Ni powder will not yield the 30-40% porosity required
for a SOFC anode. However, NiO powder of 0.3 m mean particle size was fired to 57%
theoretical density at 900C [49]. This suggests that NiO powder will yield the 30-40%](https://image.slidesharecdn.com/bumsthesisschumacherjan2003-180904230629/85/ONE-STEP-PROCESS-FOR-SOLID-OXIDE-FUEL-CELL-FABRICATION-89-320.jpg)
![90
porosity required for a SOFC anode. This is consistent with the established processing of
the anode using NiO powder as described in the introductory section.
The LSM cathode was air sintered at 1250C, to the required porosity level [18].
Since an additional driving force for densification, arising from the applied pressure, was
available in hot pressing, this ensured densification to the required porosity at or below
1250C.
Based on the above information, the limitation to the experimental regime
imposed by previously established sintering cycles is summarized in Fig. 5.4.
Figure 5.4: Practical SOFC Hot Pressing Experimental Regime
500
700
900
1100
1300
1500
Temperature[C]
ElectrolyteCathode Anode
YSZ Air Sintered
Monolithic Fabrication Temperature
Interconnect
Nano YSZ Air Sintered
Ni 98% Density
NiO 57% Density
LSM 80% Density
500
700
900
1100
1300
1500
Temperature[C]
ElectrolyteCathode Anode
YSZ Air Sintered
Monolithic Fabrication Temperature
Interconnect
Nano YSZ Air Sintered
Ni 98% Density
NiO 57% Density
LSM 80% Density
500
700
900
1100
1300
1500
Temperature[C]
ElectrolyteCathode Anode
YSZ Air Sintered
Monolithic Fabrication Temperature
Interconnect
Nano YSZ Air Sintered
Ni 98% Density
NiO 57% Density
LSM 80% Density](https://image.slidesharecdn.com/bumsthesisschumacherjan2003-180904230629/85/ONE-STEP-PROCESS-FOR-SOLID-OXIDE-FUEL-CELL-FABRICATION-90-320.jpg)
![92
Using eq. 5.1, the equivalent driving force was calculated over several particle
sizes and applied pressures ranges. In Table 5.5, the percentage of driving force due to
applied pressure was calculated. The surface energy, , used in eq. 3.13, was
approximated as 10 3
ergs/ cm 2
or 1 J/ m 2
as described by Coble [34]. As evident from
the calculated values, the surface energy contribution to driving force is negligible (<1%)
for particle sizes 10 m and greater, with 2500 psi or greater as the applied force.
Applied
Pressure
[psi]
Particle Size Radius [m]
0.01 0.1 1 10 100 1000
10000
40.79% 87.33% 98.57% 99.86% 99.99% 100.00%
5000
25.62% 77.50% 97.18% 99.71% 99.97% 100.00%
2500
14.69% 63.27% 94.51% 99.42% 99.94% 99.99%
1000
6.45% 40.79% 87.33% 98.57% 99.86% 99.99%
100
0.68% 6.45% 40.79% 87.33% 98.57% 99.86%
Table: 5.5: Percentage of Driving Force Due to Applied Pressure.
Full density, or at a minimum, closed porosity is critical for an SOFC electrolyte.
Therefore, it was desirable to hot press with a powder particle size where there was a
significant contribution to driving force from both applied pressure and surface energy
effects. Assuming 2500 psi applied pressure, a particle range between 0.1 and 1 m
yielded approximately a 50% contribution to driving force from both applied pressure
and surface energy effects. However for the electrodes, densification was limited or
hindered as much as possible since incomplete sintering or connected porosity is critical](https://image.slidesharecdn.com/bumsthesisschumacherjan2003-180904230629/85/ONE-STEP-PROCESS-FOR-SOLID-OXIDE-FUEL-CELL-FABRICATION-92-320.jpg)
![97
Anode Development
A SOFC anode consists of 30 to 40 vol% nickel with the balance YSZ and
approximately 20- 40 % porosity. The anode is processed with Ni in its oxide form and
reduced in situ as the cell begins operating in the fuel gas of 95% H2-5 % H2O at 1000C.
This process has been found to take place in a matter of minutes under these conditions
[18].
High temperature use of the hot press necessitates graphite as structural material
for the heating elements. The carbon environment was highly reducing, since only a
limited amount of oxygen was present (from the NiO). Therefore the atmosphere is
controlled by the presence of carbon monoxide, as described by eq. 5.2. The change in
Gibbs Free Energy, at 1100C, for this reaction is -68.943 kJ and equilibrium constant is
shown in eq. 5.3 [51].
C+CO2 (g) =2CO (g) (5.2)
k equilibrium = P2
CO / P CO2 = 419.6 (5.3)
Thermodynamically, the graphite environment caused reduction of the NiO
through the formation of carbon dioxide, as shown in eq. 5.4. The change in Gibbs Free
Energy, at 1100C, for this reaction was -160 kJ and equilibrium constant is shown in eq.
5.5 [51]. The negative change in Gibbs Free Energy for this reaction above 300C,](https://image.slidesharecdn.com/bumsthesisschumacherjan2003-180904230629/85/ONE-STEP-PROCESS-FOR-SOLID-OXIDE-FUEL-CELL-FABRICATION-97-320.jpg)
![98
resulted in a driving force for the reduction of NiO through a solid state reaction over the
entire hot pressing experimental regime.
2NiO + C = 2 Ni +CO2 (g) (5.4)
k equilibrium = P CO2 = 1.39 x 10 6
(5.5)
After this reduction took place, the Ni metal that formed physically separated the
C and NiO. There was no longer intimate contact between the graphite and the NiO.
Any further reduction took place though the gas phase reaction of NiO and CO as
described in eq. 5.6. The change in Gibbs Free Energy, at 1100C, for this reaction was
-46 kJ and the equilibrium constant is shown in eq. 5.7 [51].
NiO + CO (g)= Ni +CO2 (g) (5.6)
k equilibrium = P CO2 / P CO = 57.4 (5.7)
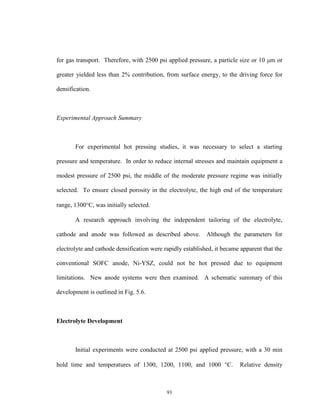
The equilibrium of Ni and NiO was controlled by the temperature and the oxygen
partial pressure of the atmosphere at which the equilibrium took place. Any CO2 which
formed reacted with the carbon components of the hot press according to eq. 5.2. At all
temperatures, the equilibrium oxygen partial pressure in the hot press was controlled by
the reaction in eq. 5.2 as discussed above. The log of the equilibrium oxygen partial
pressure (see Appendix A) of this reaction is plotted versus the Ni/ NiO equilibrium
oxygen partial pressure in Fig. 5.10. In an analogous manner to an Ellingham Diagram,](https://image.slidesharecdn.com/bumsthesisschumacherjan2003-180904230629/85/ONE-STEP-PROCESS-FOR-SOLID-OXIDE-FUEL-CELL-FABRICATION-98-320.jpg)
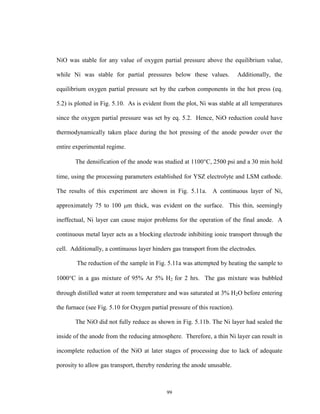
![100
Figure 5.10: Equilibrium Oxygen Partial Pressure of Ni/ and NiO as a Function of
Temperature.
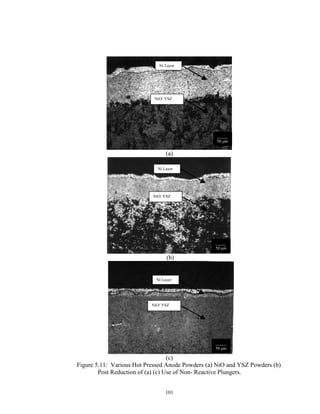
Elimination of Ni Reaction Layer
Experimental modifications were made to reduce the driving force and kinetics
for NiO reduction during hot pressing. This was accomplished by attempting to control
the oxygen partial pressure where the reaction takes place, at the sample surface.
YSZ discs were used to isolate the NiO from the carbon environment during hot
pressing. With NiO sandwiched between these plungers, the compact was hot pressed at
1100C, 2500 psi, with a 30 min hold. Hot pressed samples processed using a carbon
sleeve and YSZ plungers are shown in Fig. 5.11a and Fig. 5.11c, respectively.
Substantial reduction in the thickness of the Ni reaction layer was evident. However,
even after this modification, a thin layer of Ni was still present at the sample surface.
1E-30
1E-24
1E-18
1E-12
1E-06
1
500 600 700 800 900 1000 1100 1200 1300 1400 1500
Temperature [C]
PartialPressureofOxygen
2Ni + O2(g) = 2NiO 2CO(g) + O2(g) = 2CO2(g) 2H2(g) + O2(g) = 2H2O(g)
NiO Stable
Ni Stable](https://image.slidesharecdn.com/bumsthesisschumacherjan2003-180904230629/85/ONE-STEP-PROCESS-FOR-SOLID-OXIDE-FUEL-CELL-FABRICATION-100-320.jpg)
![102
Further extension of this isolation concept incorporates fully inert die and sleeves.
Elimination of the carbon sleeve and plunger was accomplished using an alumina tube
and discs. By hot pressing in an environment without any direct contact between NiO
and carbon, the thickness of the Ni layer could be further reduced. However the presence
of the low oxygen partial pressure around the die assembly still seemed to draw oxygen
from the NiO.
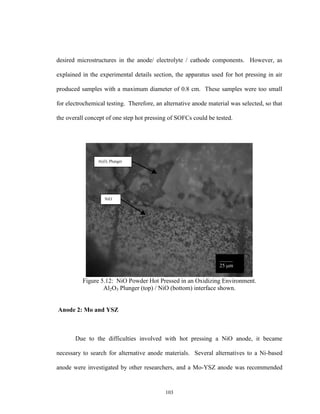
Oxidizing Environment
For NiO to remain stable (eq. 5.8), the partial pressure of oxygen must remain
above 1.17 x 10 -9
atm. at 1100C [52].
2 NiO = 2 Ni + O2(g) (5.8)
Therefore, hot pressing NiO in an oxidizing partial pressure should not allow any
reduction of the oxide. NiO was hot pressed in air at 1100C, 2500 psi, 30 min hold in an
alumina die and sleeve. Results of this experiment are shown in Fig. 5.12. Notice that no
elemental Ni is found in the cross section or at the die/ powder compact interface. The
NiO reduction problem can be eliminated if an oxidizing environment is used.
Since the LSM cathode operates in an oxidizing atmosphere while the YSZ
electrolyte is stable in both oxidizing and reducing environments [18], the oxidizing
atmosphere results confirm that SOFCs can be hot pressed in a single step to produce the](https://image.slidesharecdn.com/bumsthesisschumacherjan2003-180904230629/85/ONE-STEP-PROCESS-FOR-SOLID-OXIDE-FUEL-CELL-FABRICATION-102-320.jpg)
![104
[52]. Mo was found to offer stability in the reducing SOFC fuel mixture environment
and formed no insulating phases with YSZ. Additionally, Molybdenum’s electrical
resistivity compares favorably with Ni, Mo = 5.20 -cm while Ni = 6.84 -cm [50].
To evenly distribute the YSZ phase throughout the anode, 0.2 um YSZ powder
was used. This resulted in an even, uniform and controlled microstructure with greater
than 40% porosity. The uniformly distributed YSZ cannot be distinguished optically as a
second phase.
The Mo based anode was then hot pressed with the YSZ electrolyte. However,
the Mo anode did not adhere to the electrolyte resulting in poor interfacial contact. This
micrograph is shown in Fig. 5.13. The use of this anode would result in increased charge
transfer resistance and unsatisfactory performance. Therefore the development of a new
anode system was explored.
Figure 5.13: Hot Pressed Mo/ YSZ Anode and YSZ Electrolyte.
YSZ Electrolyte
Mo/ YSZ Anode
Poor Interfacial Contact
_______
25 m](https://image.slidesharecdn.com/bumsthesisschumacherjan2003-180904230629/85/ONE-STEP-PROCESS-FOR-SOLID-OXIDE-FUEL-CELL-FABRICATION-104-320.jpg)
![105
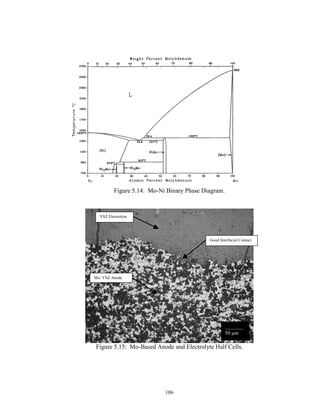
Anode 3: Mo/ 3% Ni and YSZ
An adherence problem between Molybdenum based anodes and YSZ electrolyte
has been encountered before [52]. The solution pursued by these researchers was to
change the surface properties and/or increase diffusive flux through the addition of 3 wt%
Ni to the pure Mo. Examination of the Mo-Ni phase diagram, Fig. 5.14 [52], shows a
maximum 3 wt% nickel solubility before the formation of a Mo-Ni intermetallic. At three
percent Ni, the temperature at which a liquid phase first appears is about 1100C lower
than in pure Mo.
Although the formation of the liquid phase was still 200C higher than the
processing temperature, the proximity to this temperature resulted in much greater
diffusion kinetics. As explained in the Theoretical Aspects section, the rate of
densification in a sintering compact is a function of the rate of diffusion (See eq. 3.19 and
3.20). Since the rate of diffusion increases as the materials melting temperature is
approached, the Mo-3wt% Ni composition is expected to sinter more readily than Mo
alone.
The Mo/ YSZ anode and YSZ electrolyte powders were layered and hot pressed
at 1100°C, 2500 psi, with a 30 min hold time. The resultant microstructure represents a
good balance of uniformity, distribution and pore size (Fig. 5.15). The relative density of
the electrolyte remains the same as when pressed alone. The anode, when pressed in
tandem, showed adequate porosity and pore distribution for a SOFC electrode.
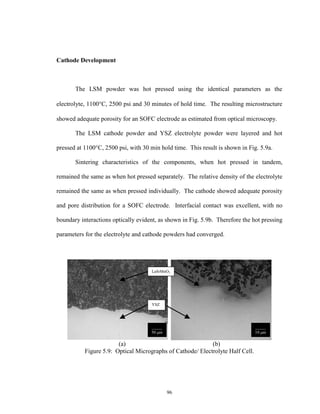
Interfacial contact was excellent, with no boundary interactions evident.](https://image.slidesharecdn.com/bumsthesisschumacherjan2003-180904230629/85/ONE-STEP-PROCESS-FOR-SOLID-OXIDE-FUEL-CELL-FABRICATION-105-320.jpg)

![113
Appendix B
MOLYBDENUM BASED ANODE MAXIMUM FUEL UTILIZATION
Fuel Utilization (U) refers to the fraction of the total fuel or oxidant introduced
into a fuel cell that reacts electrochemically, it is described in eq. B.1. For a
Molybdenum based anode the maximum amount of hydrogen consumed is controlled by
the oxidation limit of water vapor in the surrounding atmosphere before Molybdenum
dioxide forms. Therefore this was first determined.
In
Consumed
In
OutsIn
f
H
H
H
HH
U
,2
,2
,2
,,2
(B.1)
The oxidation limit of Molybdenum was found according to eq. B.2. The
maximum water vapor content of the surrounding atmosphere was found using eq. B.4
eq. B.5 and eq. B.6.
Mo + 2 H2O (g) = MoO2 + 2 H2 (g) (B.2)
OH
H
P
P
K
2
2
2
2
1 = 1.589 (at 1000C [52] (B.3)
2
1
2
2 *7933.0 H
H
OH P
K
P
P (B.4)](https://image.slidesharecdn.com/bumsthesisschumacherjan2003-180904230629/85/ONE-STEP-PROCESS-FOR-SOLID-OXIDE-FUEL-CELL-FABRICATION-113-320.jpg)


This thesis by Christian Robert Schumacher presents a one-step fabrication process for solid oxide fuel cells (SOFCs) that aims to reduce costs and improve production efficiency. It addresses the challenges of commercialization, specifically the need for mass production techniques and optimizing processing parameters to enhance performance and reduce losses. The work develops fundamental knowledge in ceramic processing and provides a novel approach to create SOFCs efficiently while maintaining high functional standards.


