Download to read offline


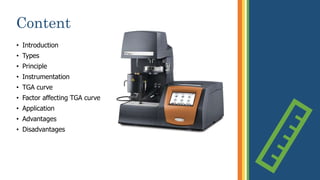


Thermogravimetric analysis (TGA) is a technique that measures the weight changes that a material undergoes as a function of temperature or time under a controlled atmosphere. There are three main types of TGA: static, dynamic, and quasi-static. The basic principle is that a sample is heated at a controlled rate and the change in weight is recorded as a function of temperature or time. This produces a thermogravimetric curve or thermogram. TGA is used to determine characteristics such as thermal stability, decomposition temperature, and reaction kinetics of materials.


