M PHARMACY MPAT NOTES ON THERMOGRAVIMETRIC ANAYSIS
1.
1
Thermogravimetric Analysis (TGA)
&
Differentialthermal analysis (DTA)
Presentation on
Presented by –
F.Y M.Pharm
Department of Pharmacognosy
Guided by –
Dr. R. Godge
Pravara Rural College Of Pharmacy, Pravaranagar
3
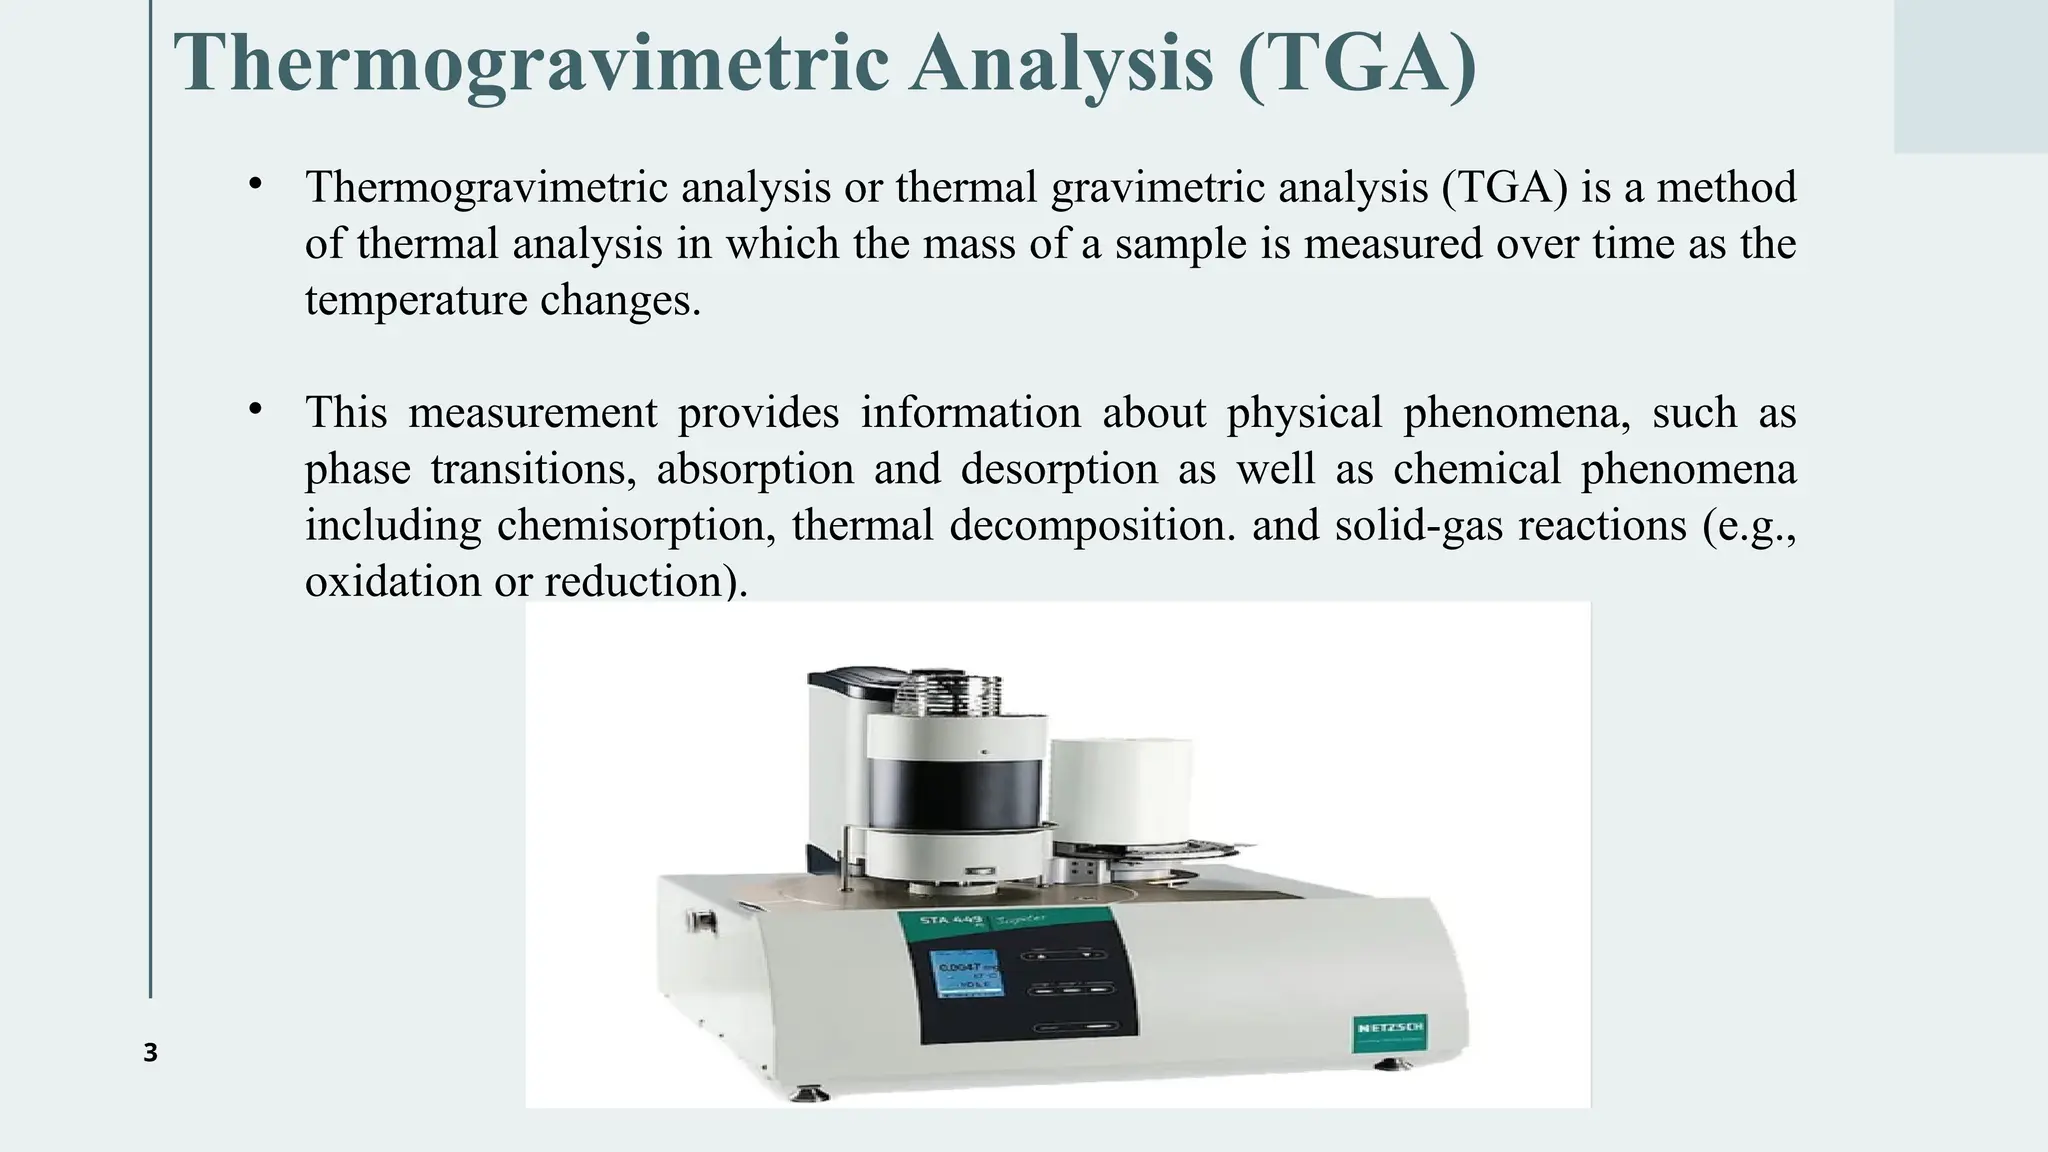
Thermogravimetric Analysis (TGA)
•Thermogravimetric analysis or thermal gravimetric analysis (TGA) is a method
of thermal analysis in which the mass of a sample is measured over time as the
temperature changes.
• This measurement provides information about physical phenomena, such as
phase transitions, absorption and desorption as well as chemical phenomena
including chemisorption, thermal decomposition. and solid-gas reactions (e.g.,
oxidation or reduction).
4.
Principle of TGA
•In thermo-gravimetric analysis, the sample is heated in a given environment (air,
N2, CO2, He, Ar, etc.) at controlled rate. The change in the weight of the
substance is recorded as a function of temperature or time.
• The temperature is increased at a constant rate for a known initial weight of the
substance and the changes in weights are recorded as a function of temperature at
different time interval.
• This plot of weight change against temperature is called thermo-gravimetric
curve or thermo-gram, this is the basic principle of TGA.
5.
Three types ofthermogravimetry
1. Isothermal or static thermogravimetry: In this technique the sample
weight is recorded as function of time at constant temperature.
2. Quasistatic thermogravimetry: In this technique the sample is heated to
constant weight at each of series of increasing temperatures.
3. Dynamic thermogravimetry: In this technique the sample is heated in an
environment whose temperature is changing in a pre determined manner
generally at linear rate. This type is generally used.
6.
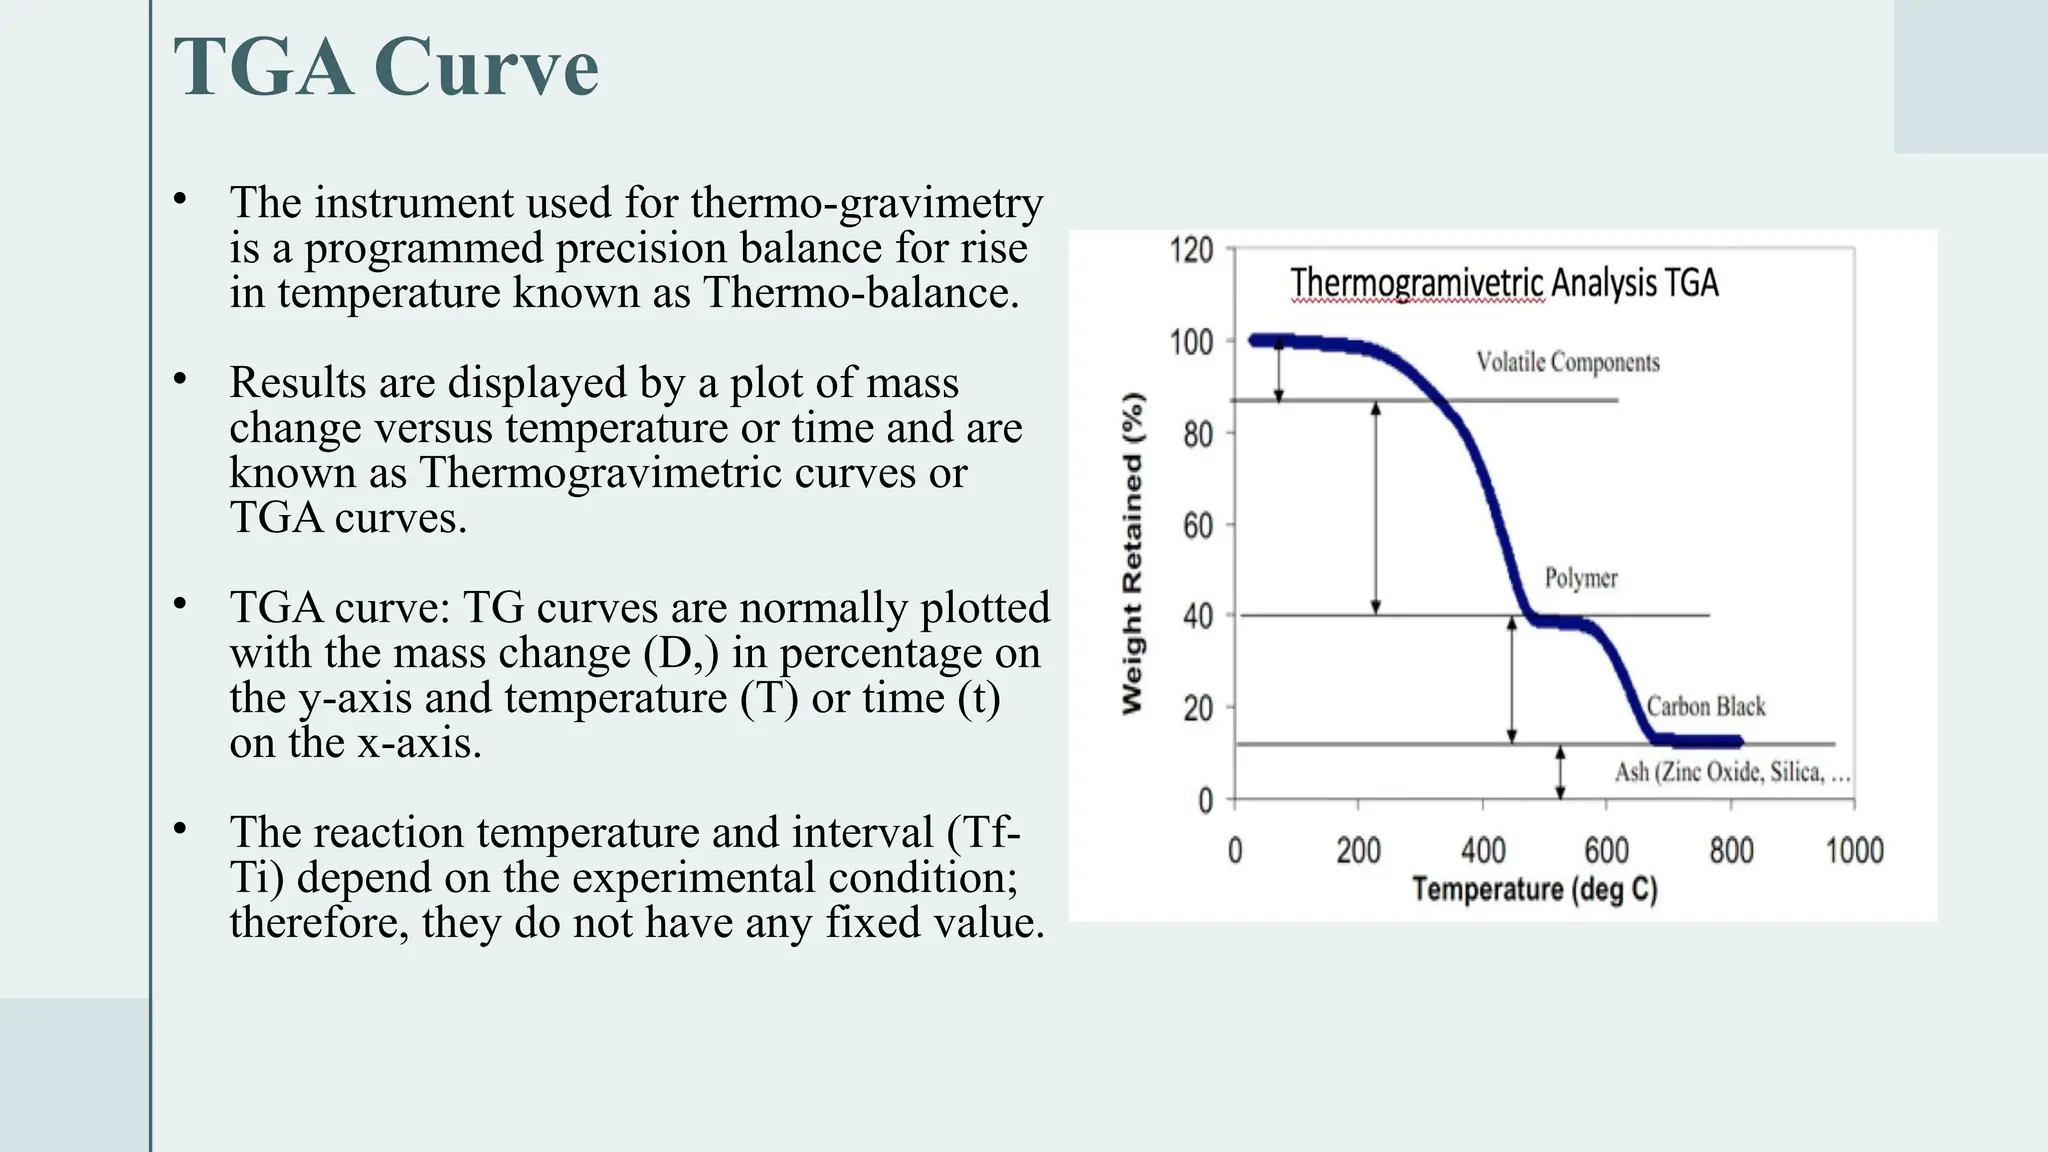
• The instrumentused for thermo-gravimetry
is a programmed precision balance for rise
in temperature known as Thermo-balance.
• Results are displayed by a plot of mass
change versus temperature or time and are
known as Thermogravimetric curves or
TGA curves.
• TGA curve: TG curves are normally plotted
with the mass change (D,) in percentage on
the y-axis and temperature (T) or time (t)
on the x-axis.
• The reaction temperature and interval (Tf-
Ti) depend on the experimental condition;
therefore, they do not have any fixed value.
TGA Curve
7.
7
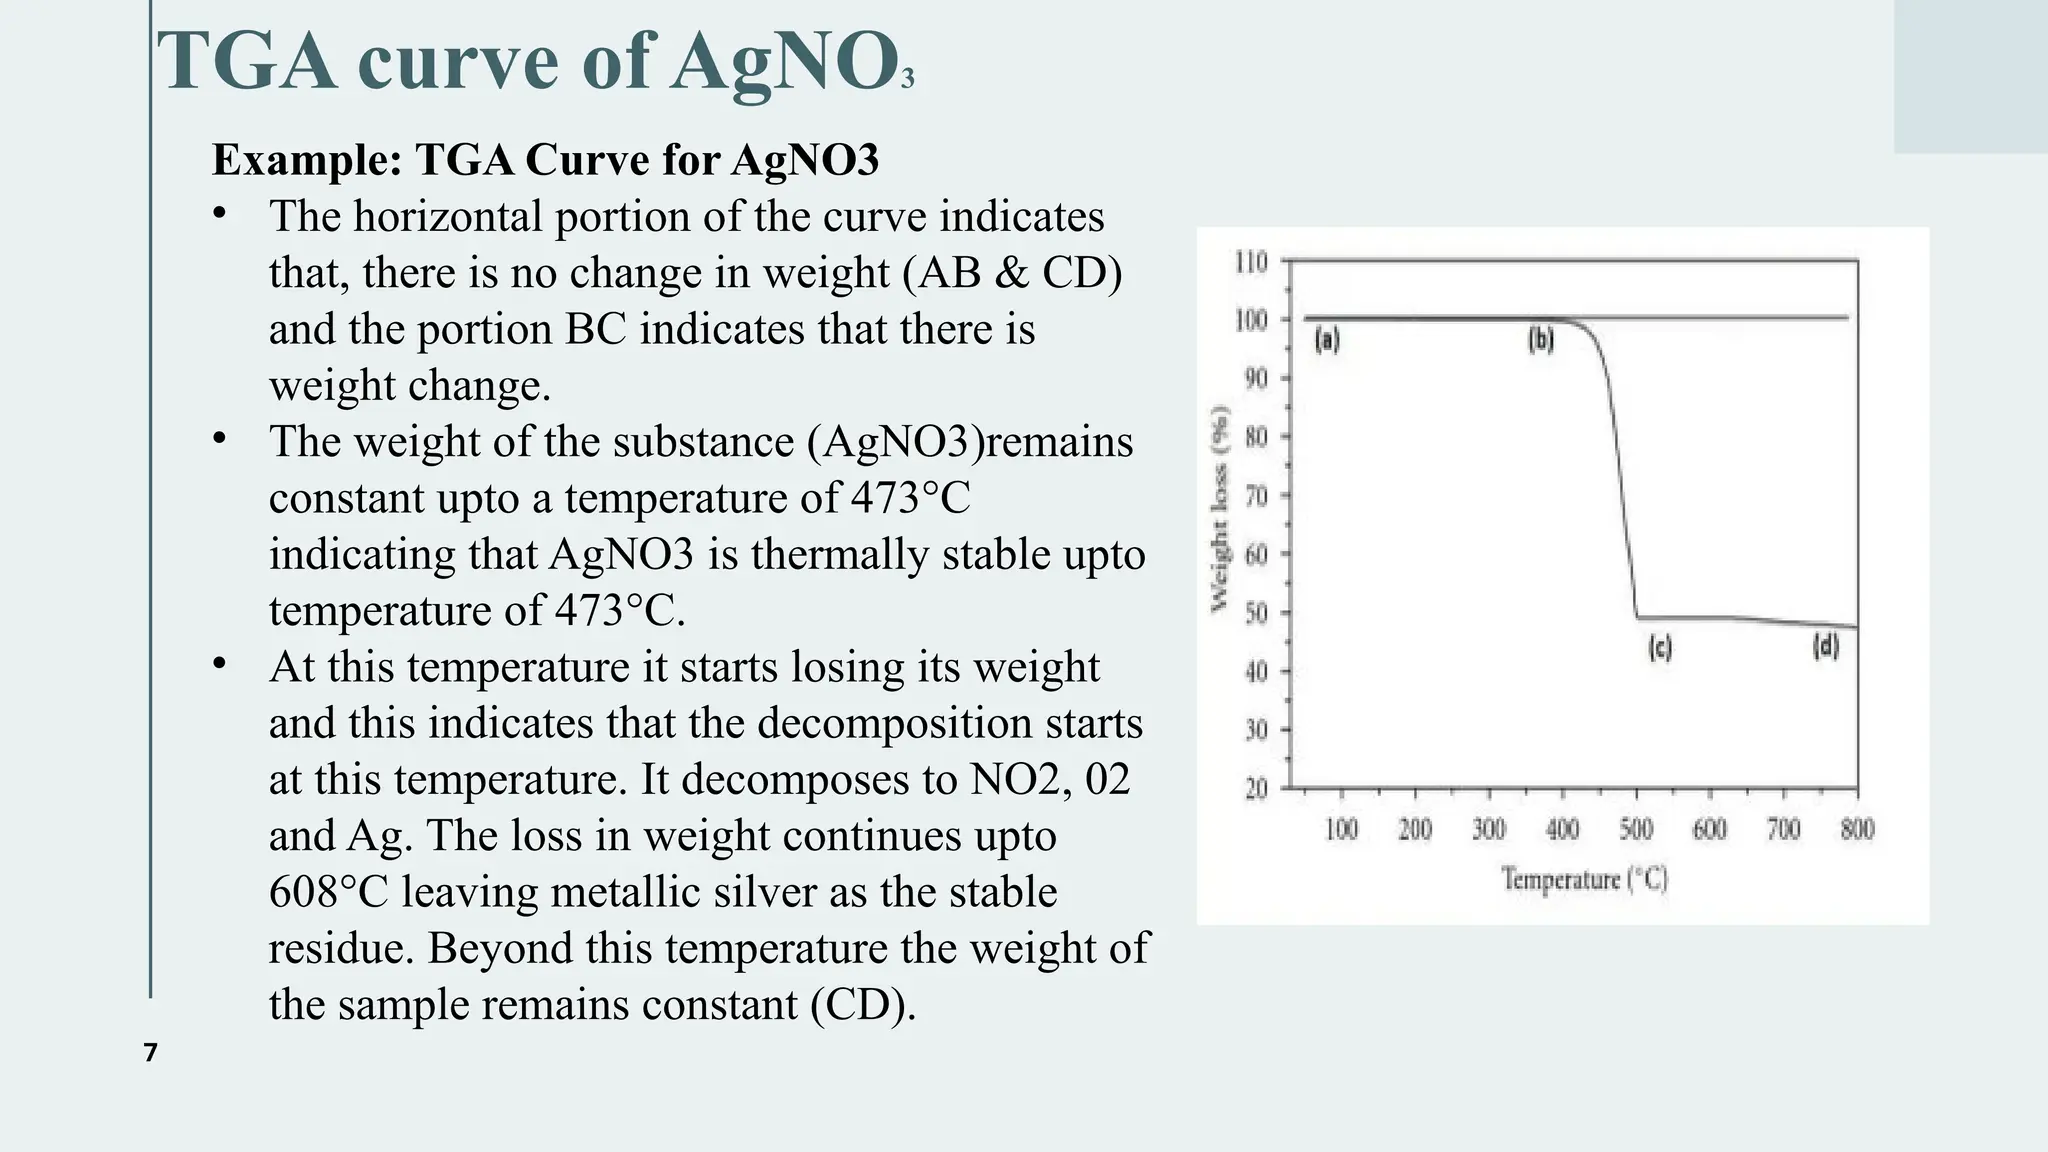
TGA curve ofAgNO3
Example: TGA Curve for AgNO3
• The horizontal portion of the curve indicates
that, there is no change in weight (AB & CD)
and the portion BC indicates that there is
weight change.
• The weight of the substance (AgNO3)remains
constant upto a temperature of 473°C
indicating that AgNO3 is thermally stable upto
temperature of 473°C.
• At this temperature it starts losing its weight
and this indicates that the decomposition starts
at this temperature. It decomposes to NO2, 02
and Ag. The loss in weight continues upto
608°C leaving metallic silver as the stable
residue. Beyond this temperature the weight of
the sample remains constant (CD).
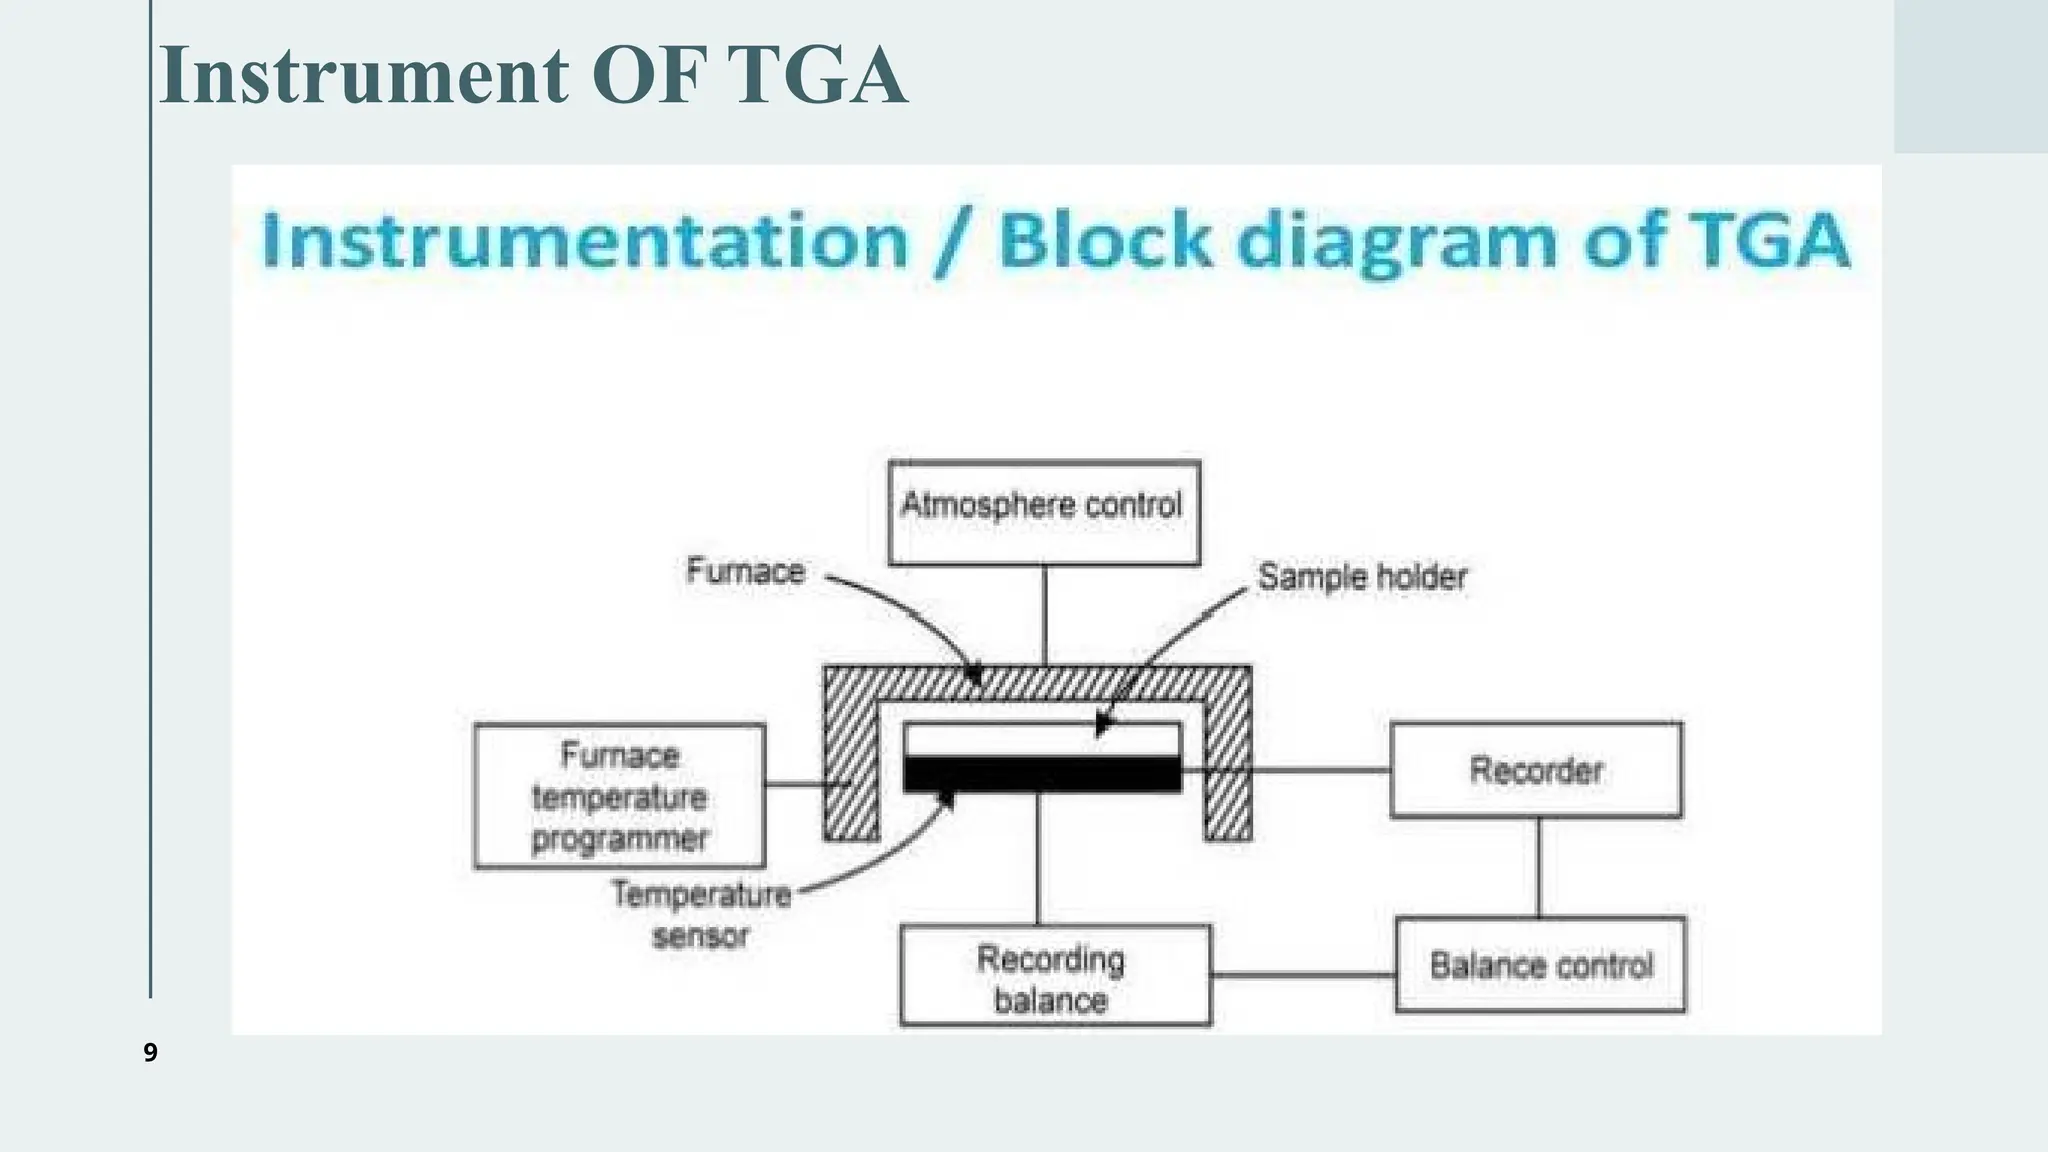
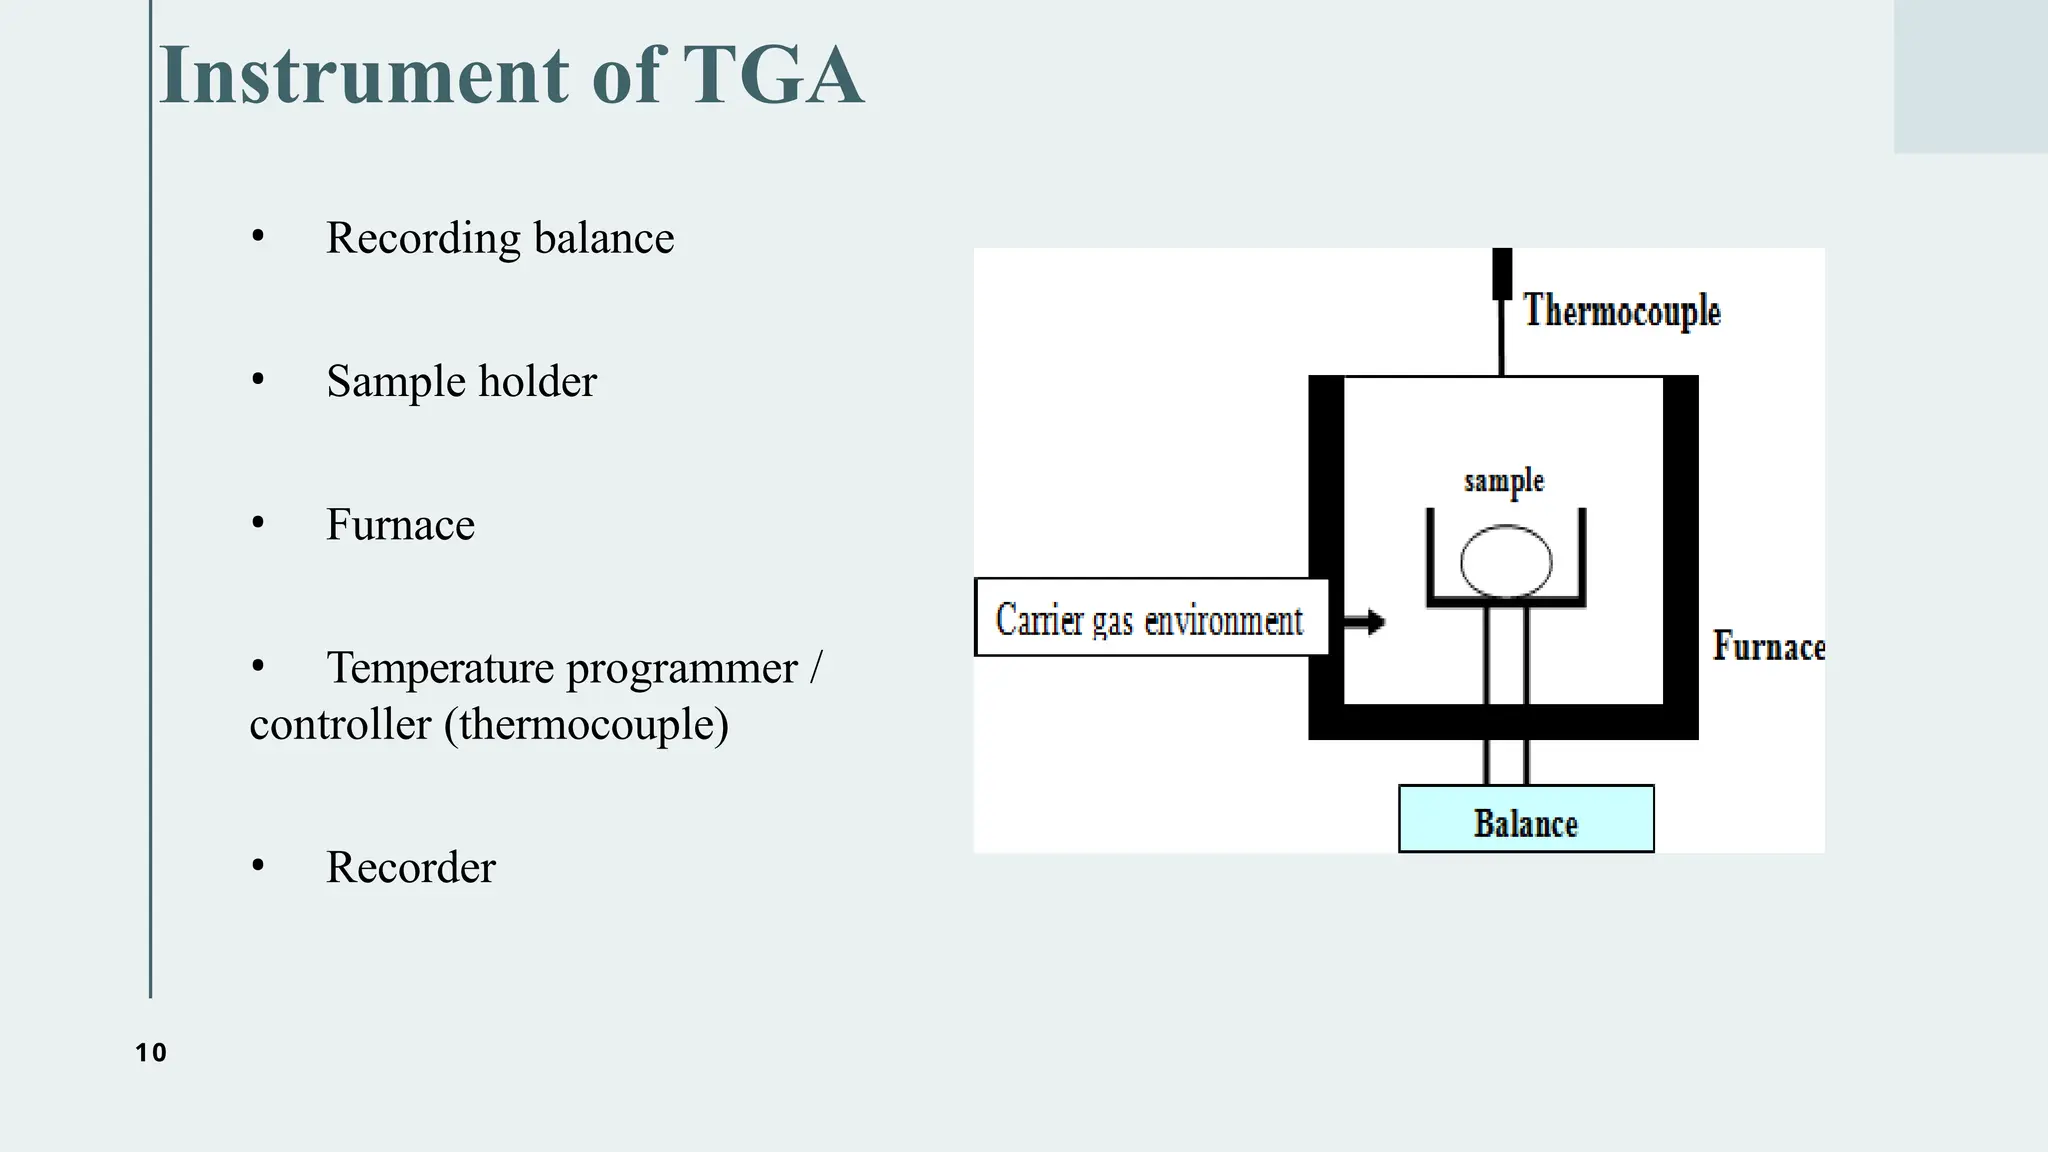
10
• Recording balance
•Sample holder
• Furnace
• Temperature programmer /
controller (thermocouple)
• Recorder
Instrument of TGA
11.
11
1. Recording Balance
Amicrobalance is used to record a change in mass of sample/ substance.
An ideal microbalance must possess following features:
• It should accurately and reproducibly record the change in mass of sample in
ideal ranges of atmospheric conditions and temperatures.
• It should provide electronic signals to record the change in mass using a
recorder.
• The electronic signals should provide rapid response to change in mass.
• It should be stable at high ranges, mechanically and electrically.
• Its operation should be user friendly.
• After the sample has been placed on microbalance, it is left for 10-15min to
stabilize.
- Recorder balances are of to types:
I. Deflection-type instruments and
II. Null-type instruments
12.
12
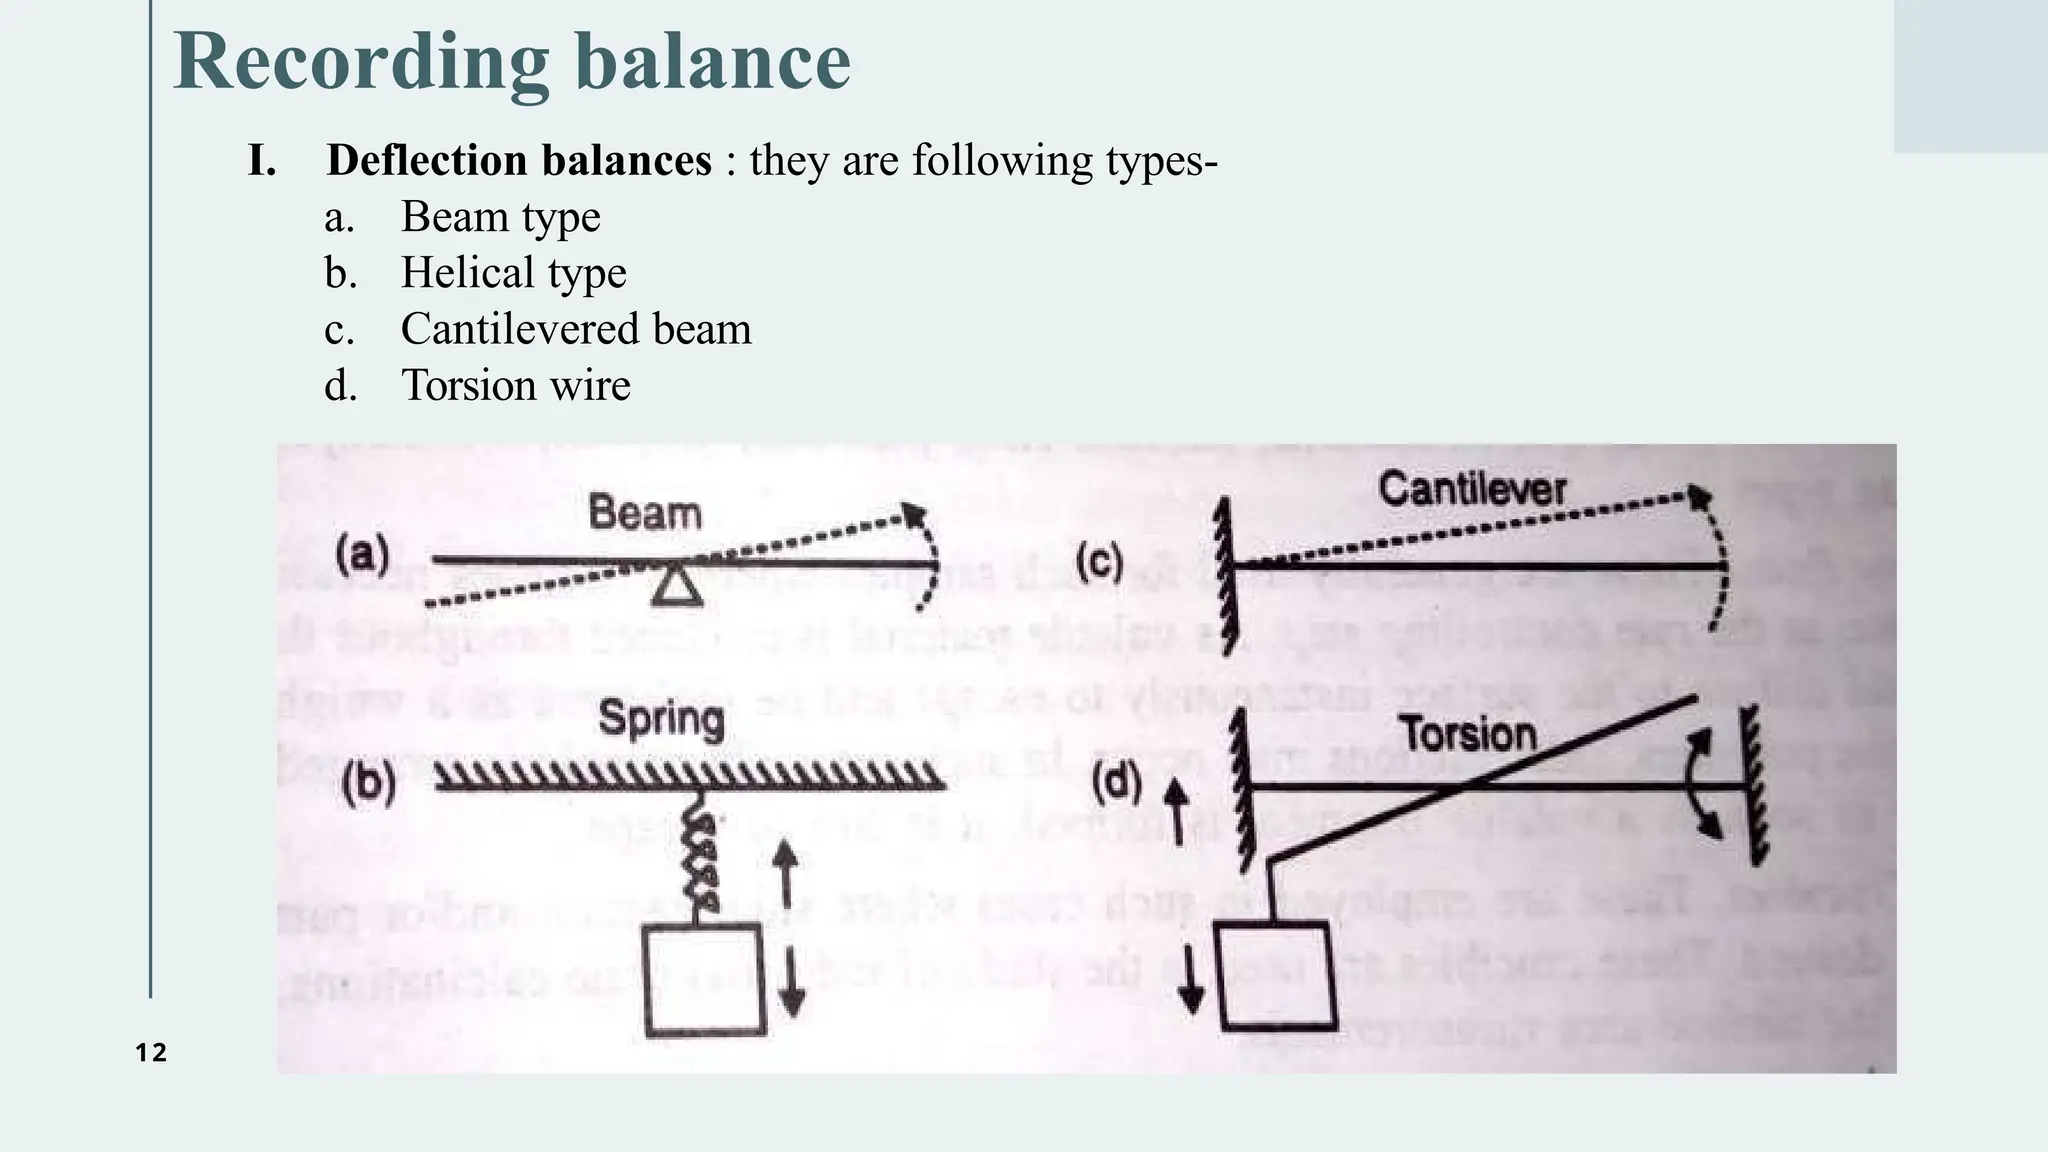
Recording balance
I. Deflectionbalances : they are following types-
a. Beam type
b. Helical type
c. Cantilevered beam
d. Torsion wire
13.
13
Recording balance
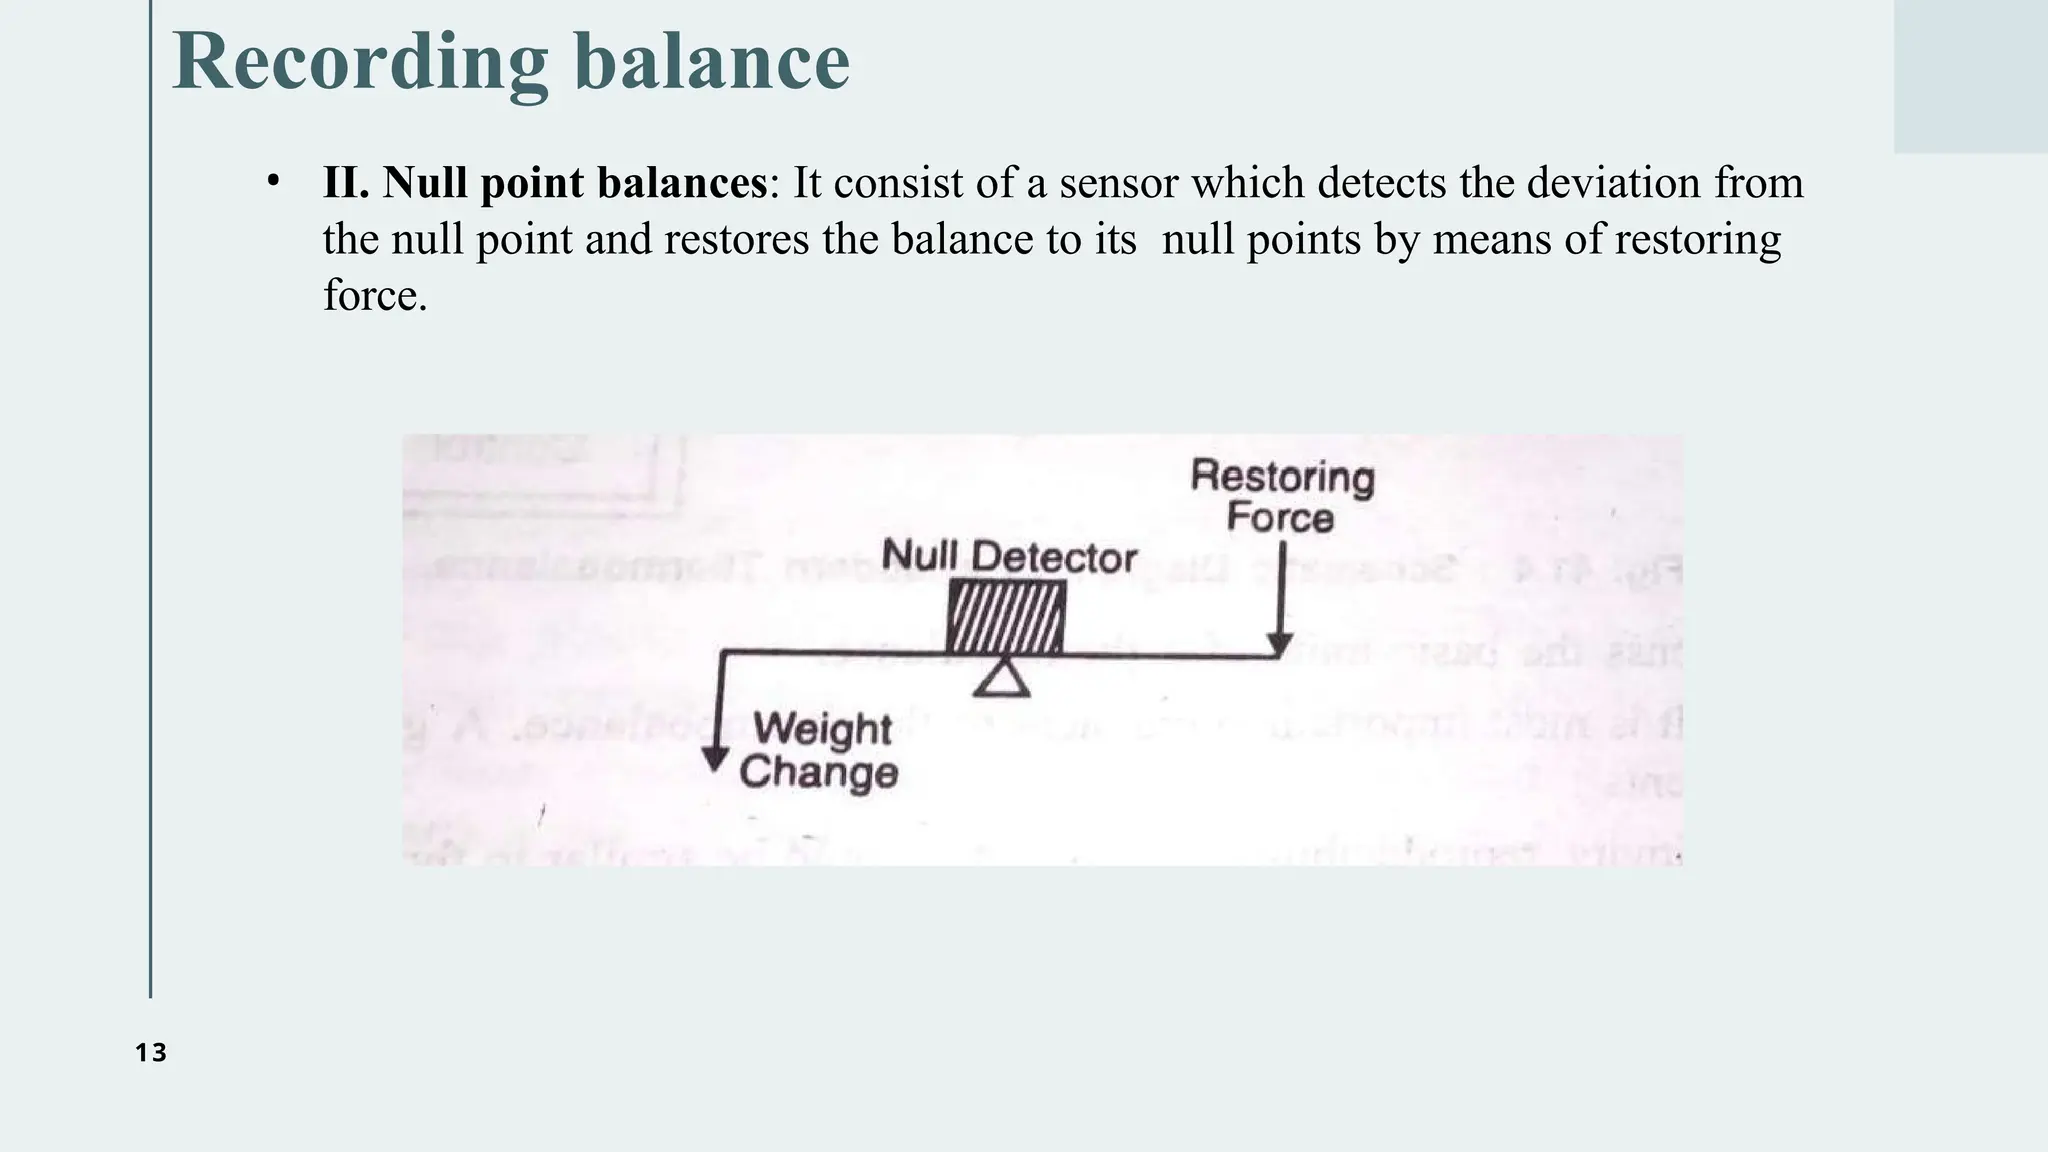
• II.Null point balances: It consist of a sensor which detects the deviation from
the null point and restores the balance to its null points by means of restoring
force.
14.
14
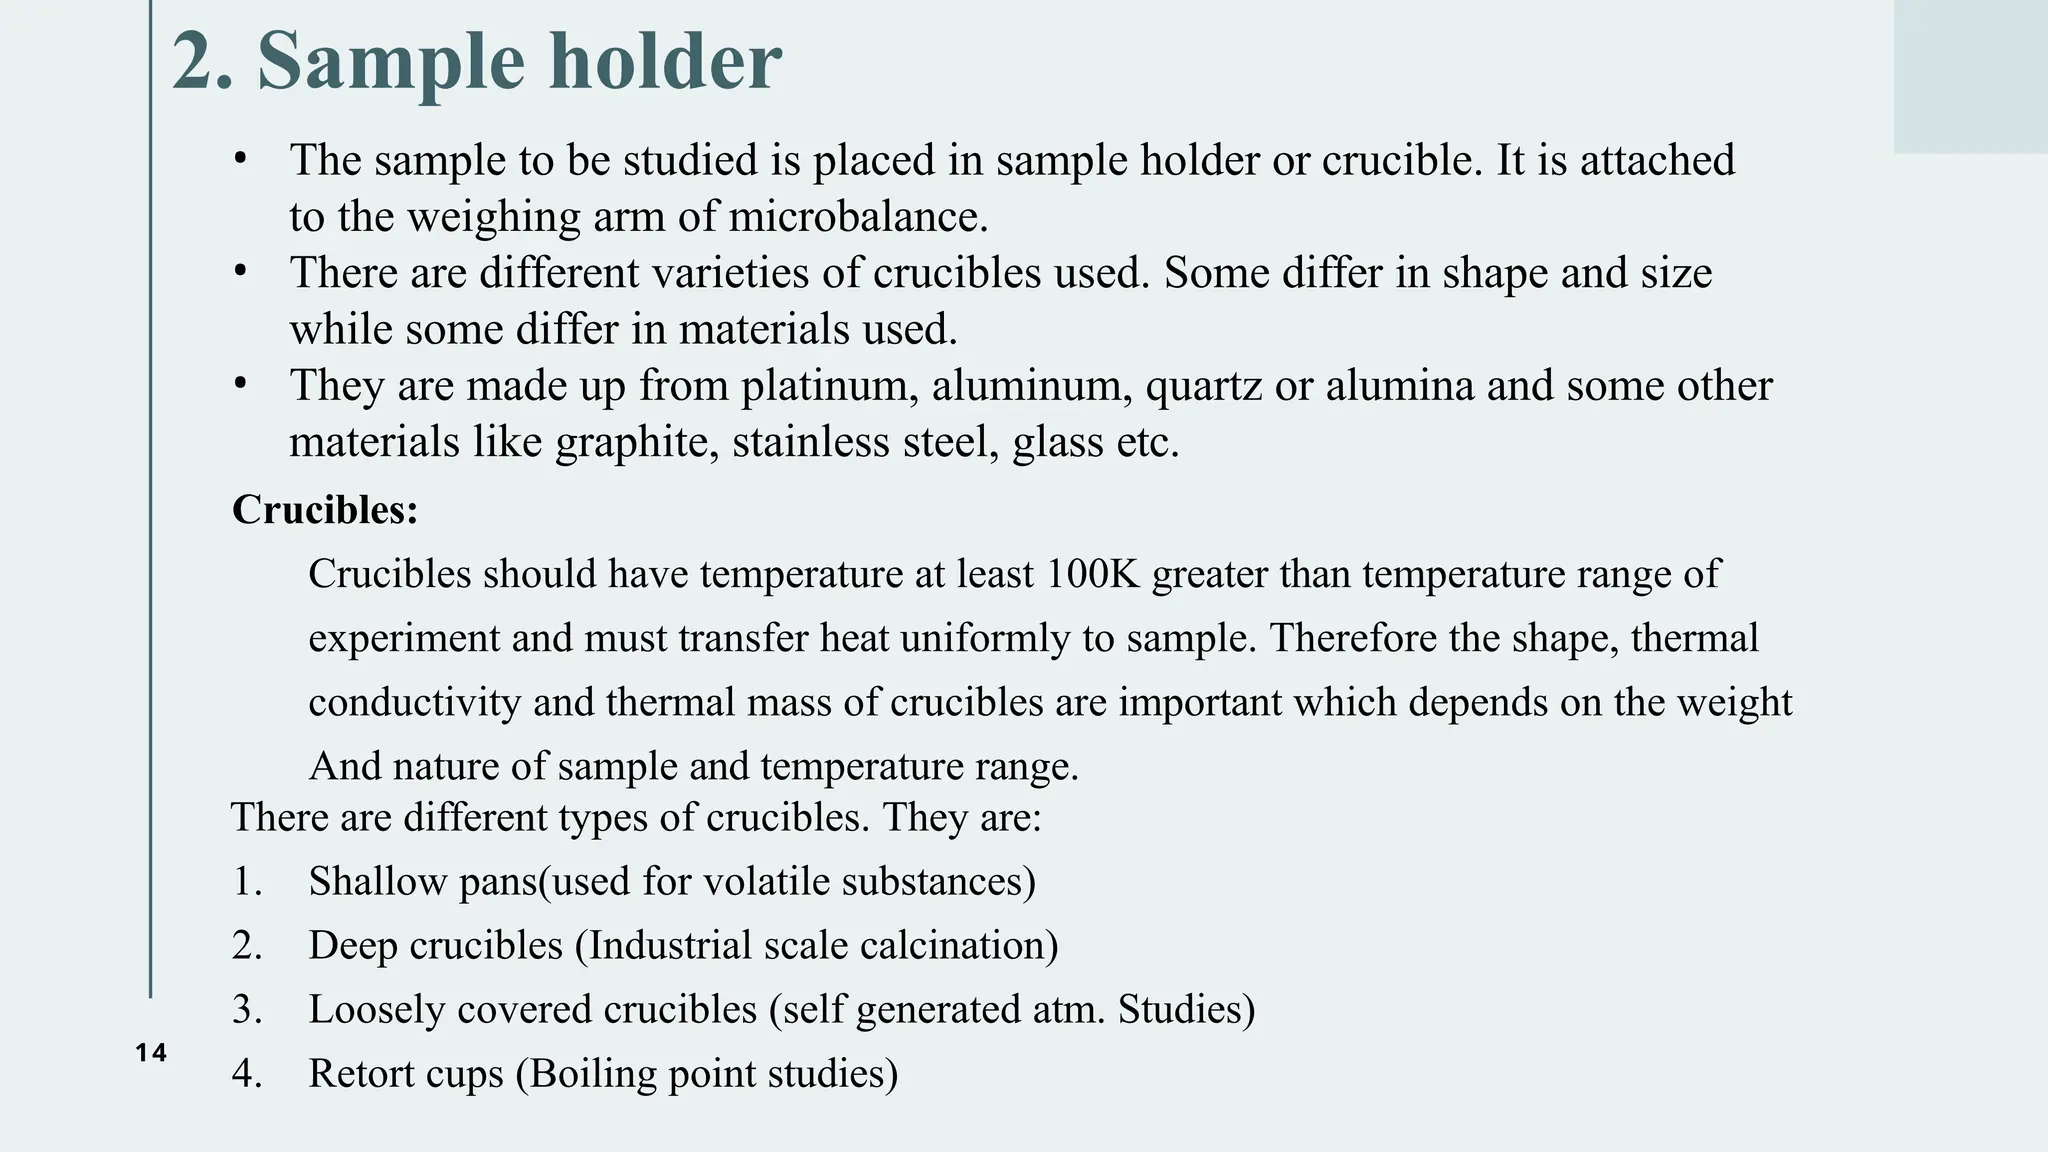
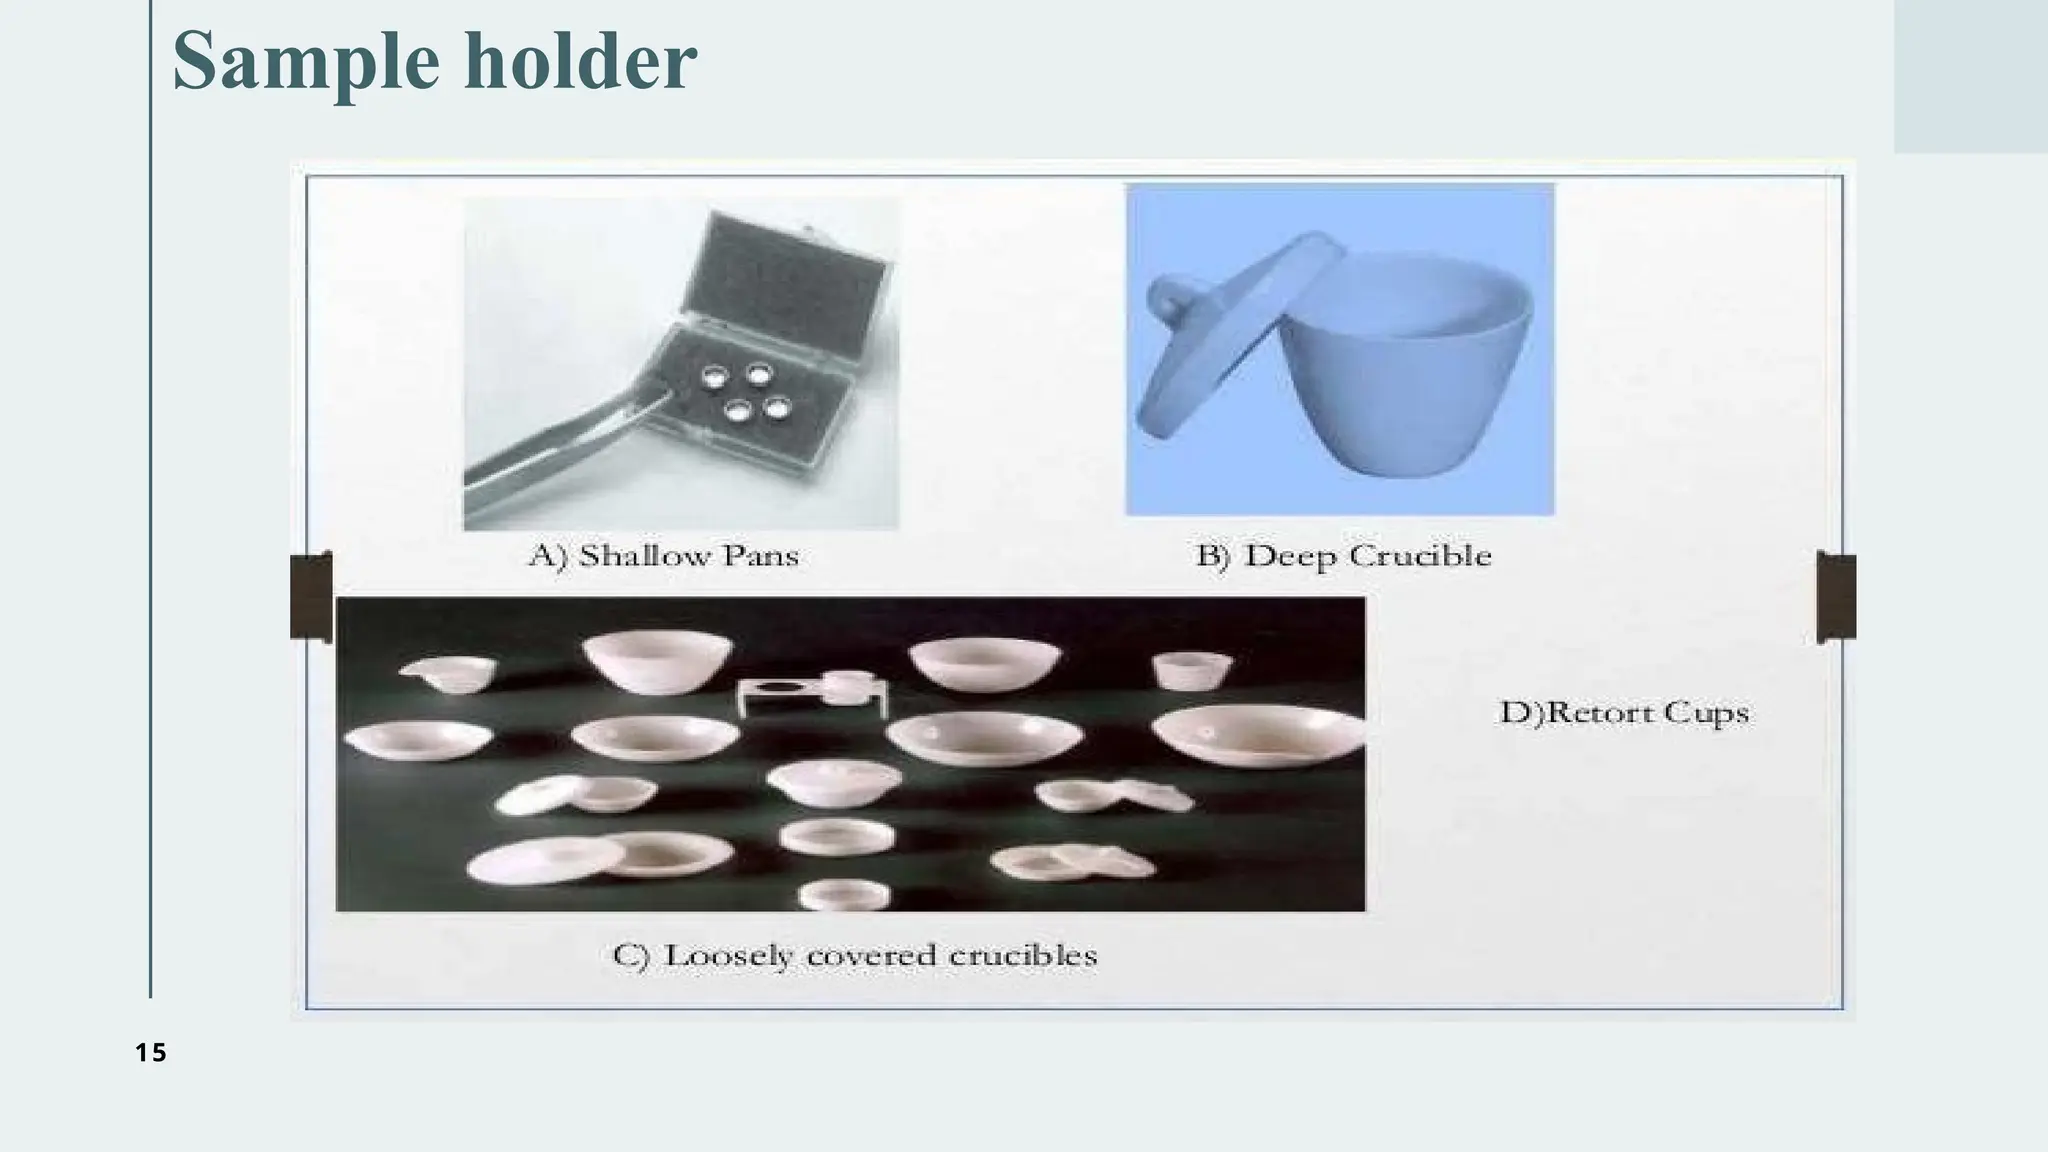
2. Sample holder
•The sample to be studied is placed in sample holder or crucible. It is attached
to the weighing arm of microbalance.
• There are different varieties of crucibles used. Some differ in shape and size
while some differ in materials used.
• They are made up from platinum, aluminum, quartz or alumina and some other
materials like graphite, stainless steel, glass etc.
Crucibles:
Crucibles should have temperature at least 100K greater than temperature range of
experiment and must transfer heat uniformly to sample. Therefore the shape, thermal
conductivity and thermal mass of crucibles are important which depends on the weight
And nature of sample and temperature range.
There are different types of crucibles. They are:
1. Shallow pans(used for volatile substances)
2. Deep crucibles (Industrial scale calcination)
3. Loosely covered crucibles (self generated atm. Studies)
4. Retort cups (Boiling point studies)
16
3. Furnace
• Thefurnace should be designed in such way that it produces a linear heating
range.
• It should have a hot zone which can hold sample and crucible and its
temperature corresponds to the temperature of furnace.
• There are different combinations of microbalance and furnace available. The
furnace heating coil should be wound in such a way that there is no magnetic
interaction between coil and sample or there can cause apparent mass change
17.
17
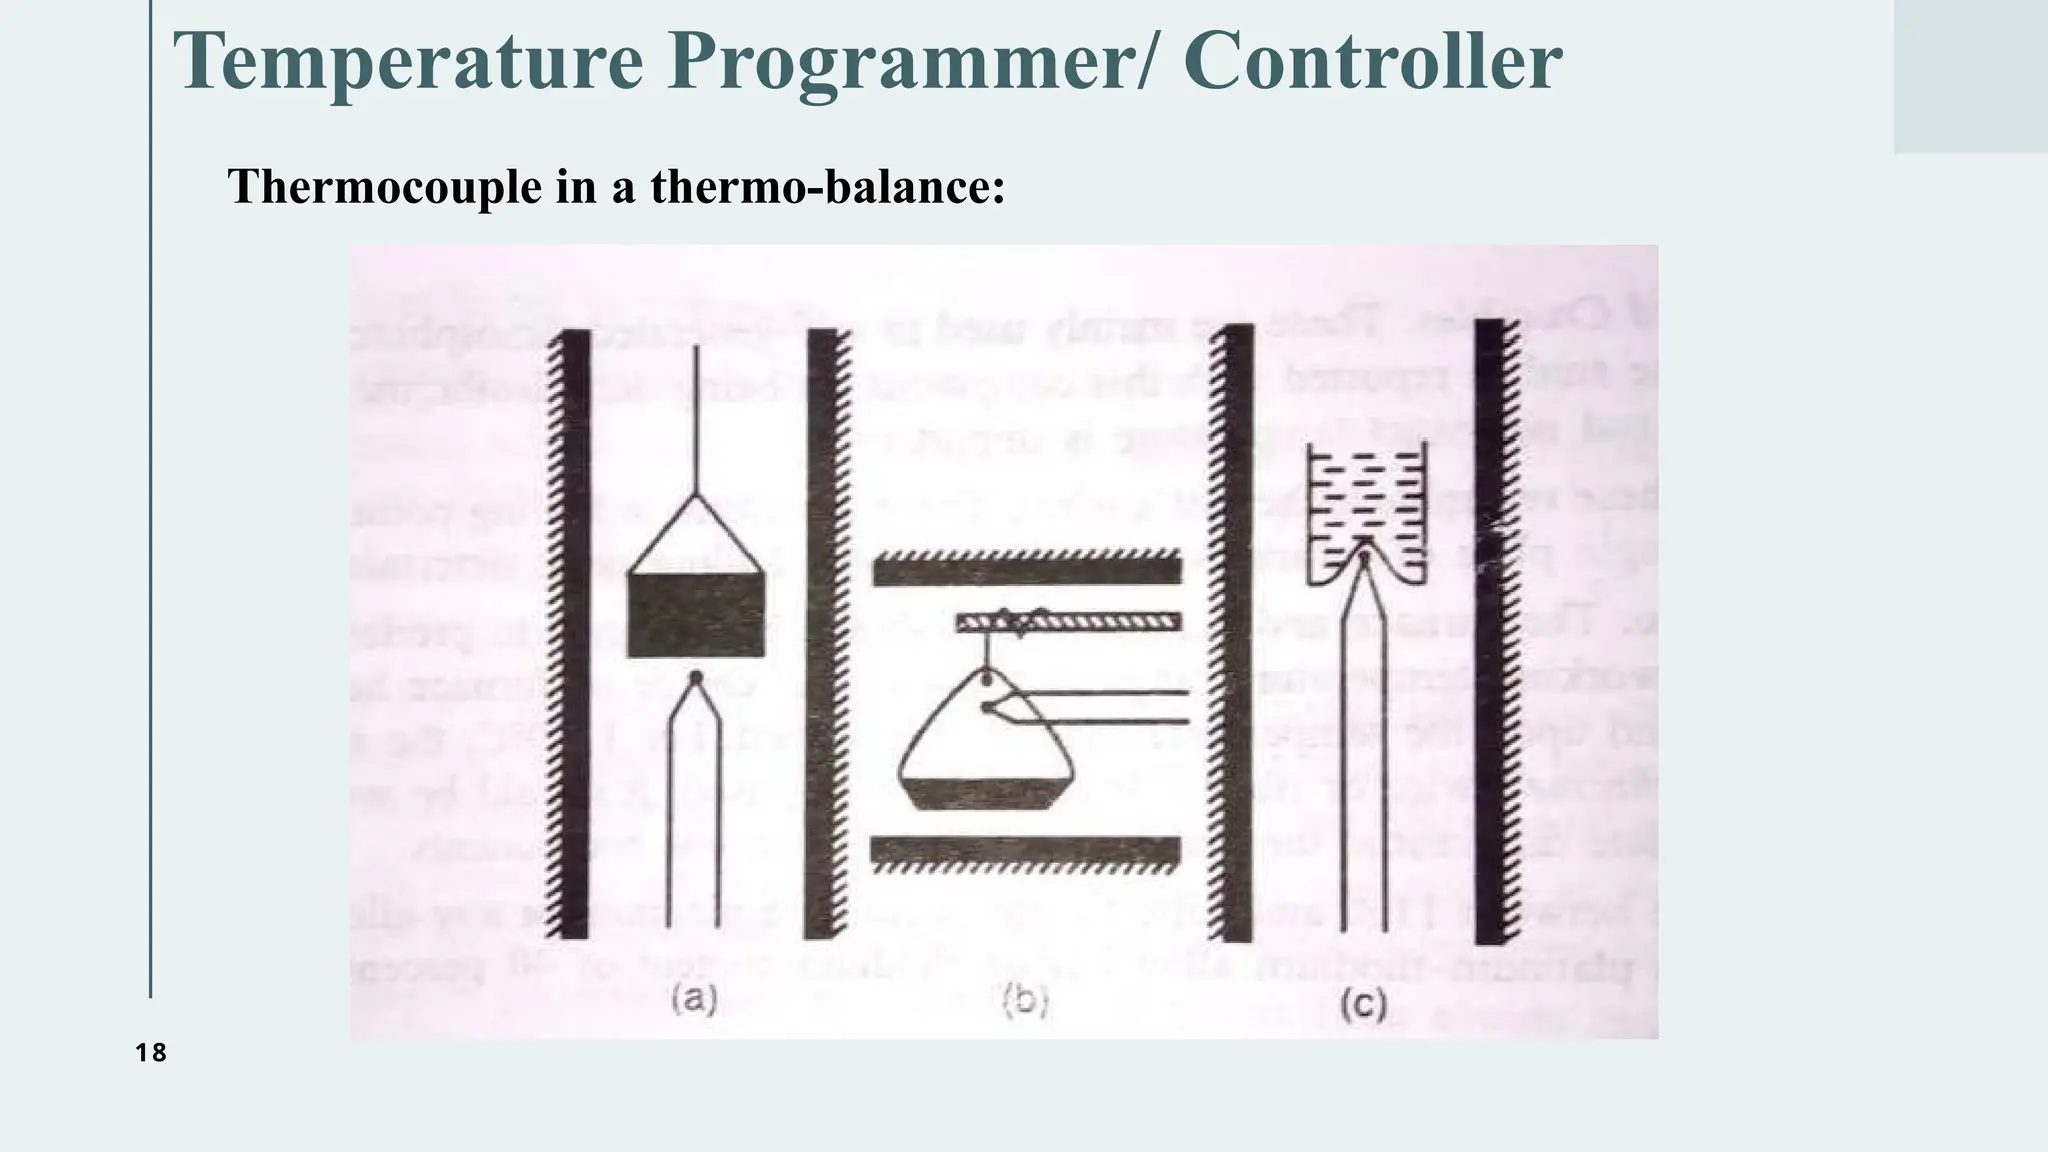
4. Temperature Programmer/Controller
• Temperature measurement is done in no. of ways thermocouple is
most common technique.
• The position of the temperature measuring device relative to the sample is very
important.
• The major types are:
a) The thermocouple is placed near the sample container and it has no contact
with the sample container. This isn’t a good arrangement where low-pressure
are employed.
b) The sample is kept inside the sample holder but not in contact with it. This
arrangement is better than that of (a) because it responds to small
temperature changes.
c) The thermocouple is placed either in contact with sample or with the sample
container. This is the best arrangement of sample temperature detection.
19
5. Recorder
The recordingsystems are mainly of 2types
1. Time-base potentiometric strip chart recorder.
2. X-Y recorder.
• In some instruments, light beam galvanometer, photographic
paper recorders or one recorder with two or more pens are
also used.
• In the X-Y recorder, we get curves having plot of
weights directly against temperatures.
• However, the percentage mass change against temperature
or time would be more useful.
21
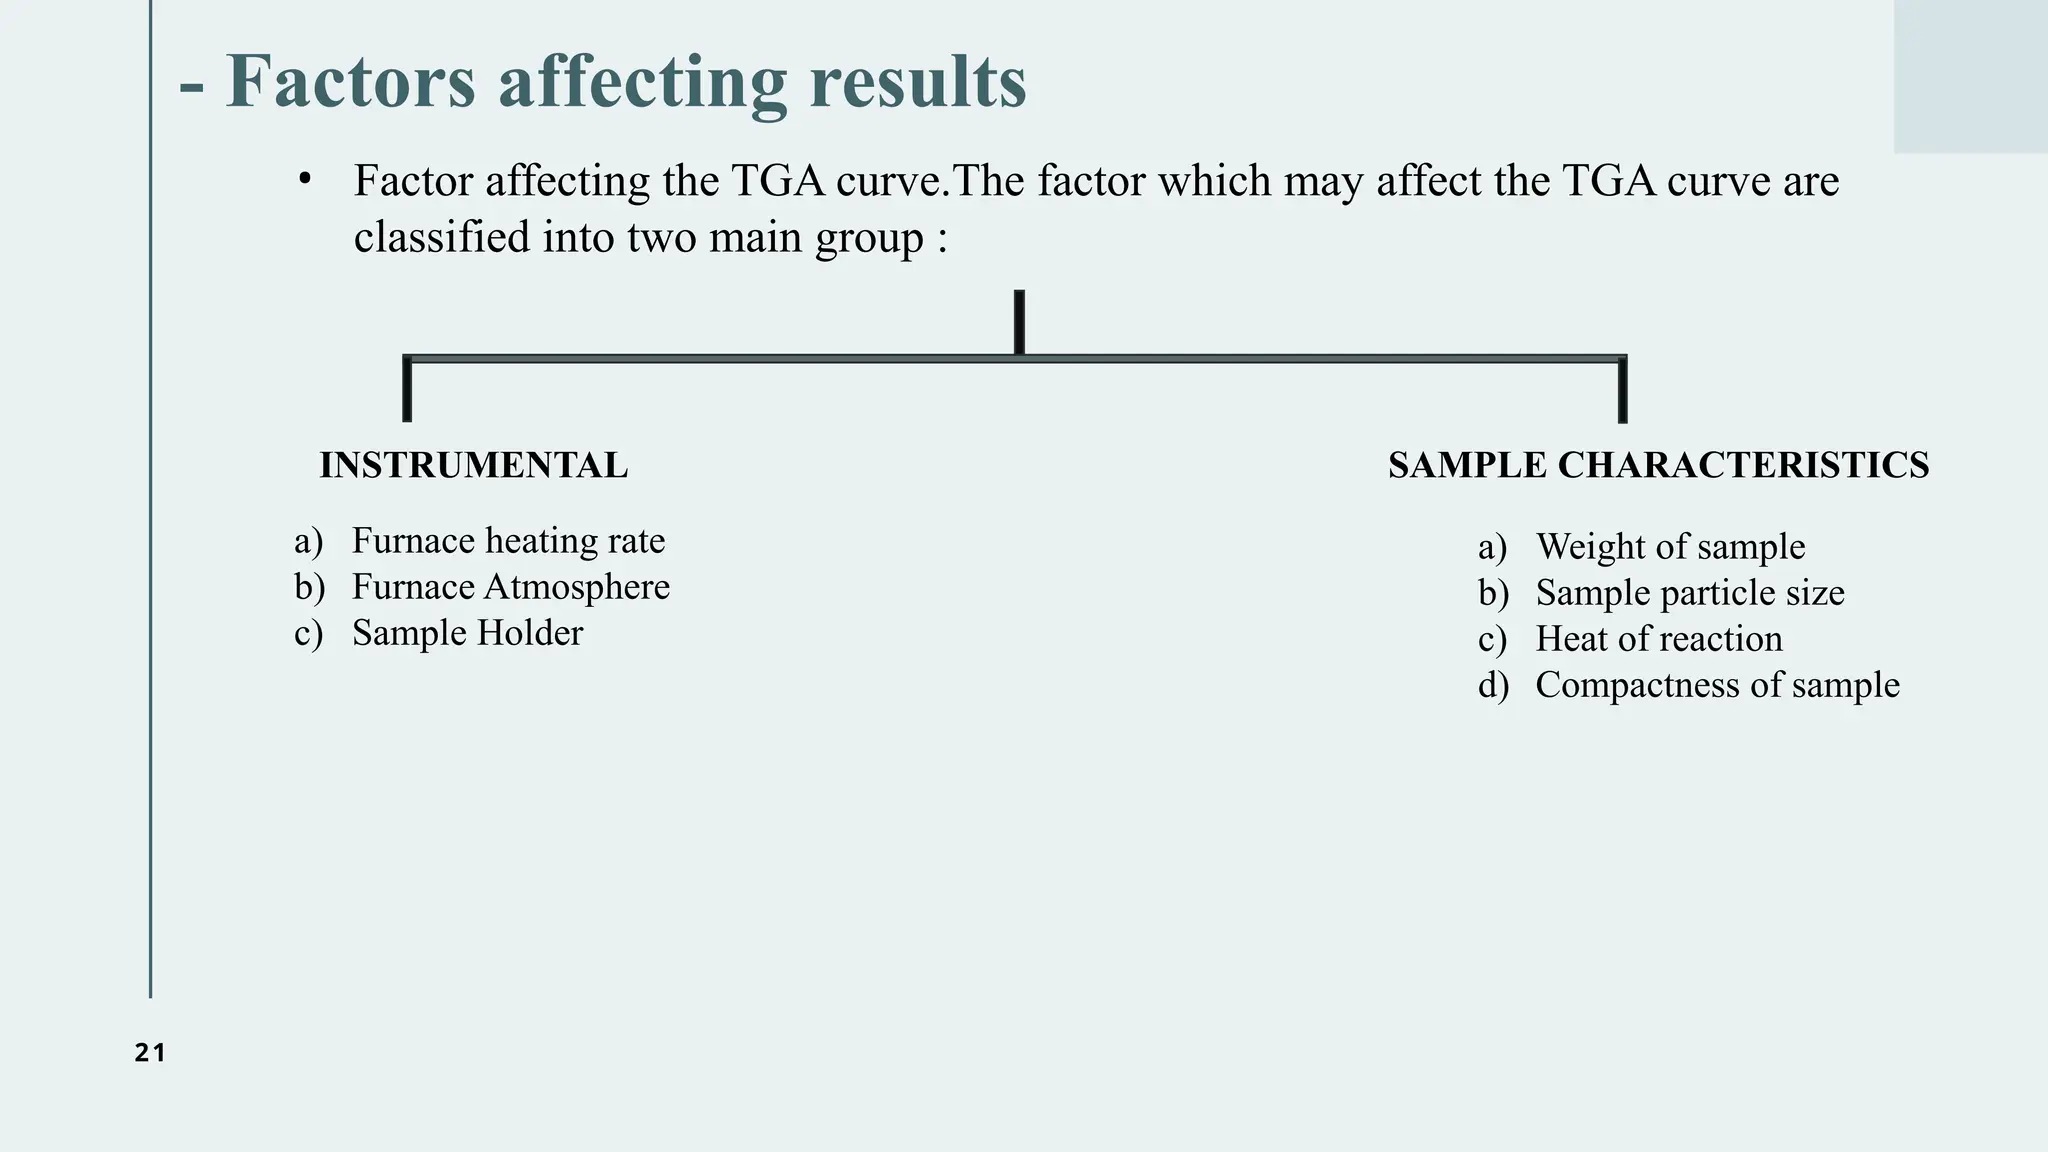
- Factors affectingresults
• Factor affecting the TGA curve.The factor which may affect the TGA curve are
classified into two main group :
a) Furnace heating rate
b) Furnace Atmosphere
c) Sample Holder
a) Weight of sample
b) Sample particle size
c) Heat of reaction
d) Compactness of sample
INSTRUMENTAL SAMPLE CHARACTERISTICS
22.
22
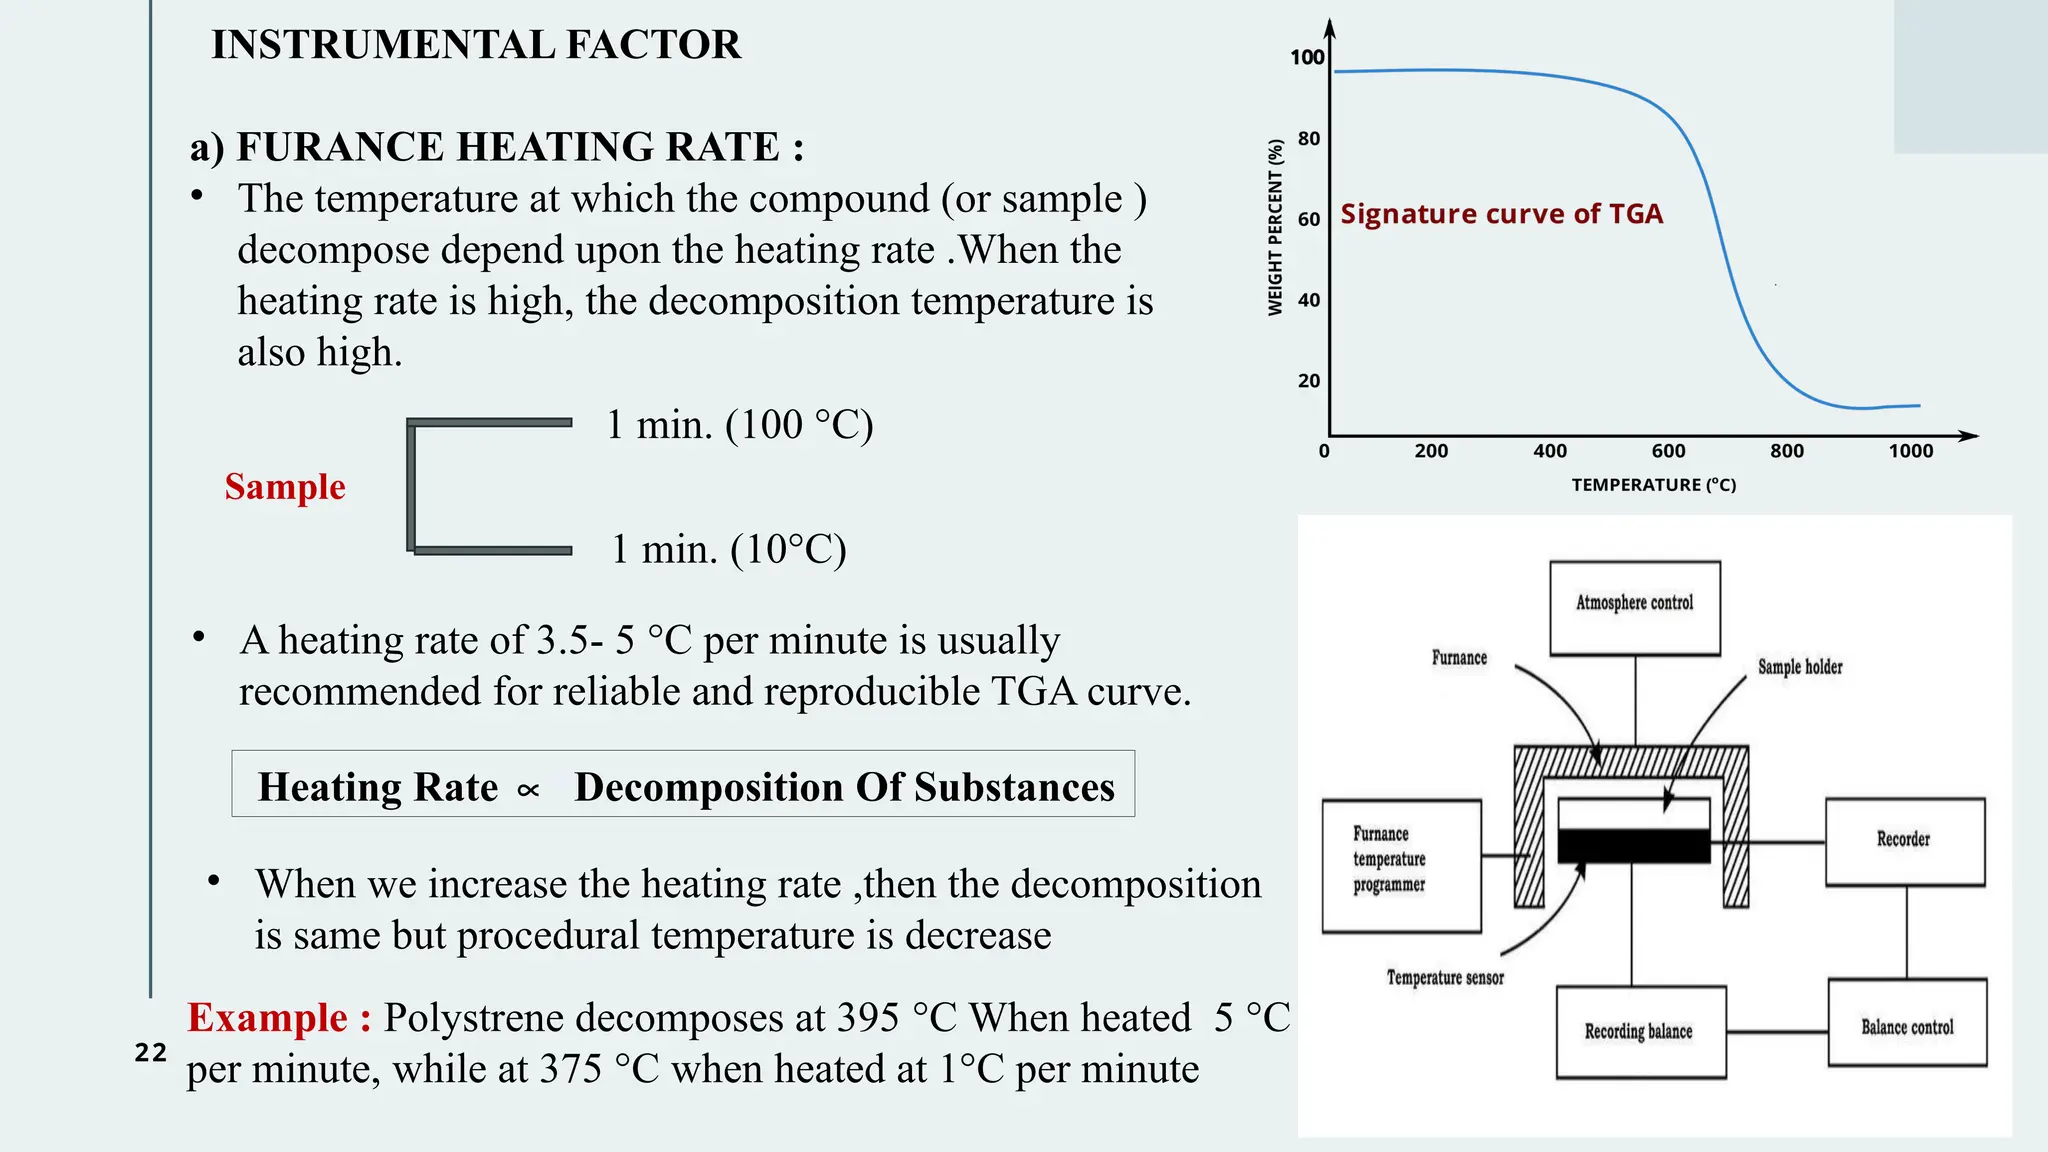
INSTRUMENTAL FACTOR
a) FURANCEHEATING RATE :
• The temperature at which the compound (or sample )
decompose depend upon the heating rate .When the
heating rate is high, the decomposition temperature is
also high.
Sample
1 min. (100 °C)
1 min. (10°C)
• A heating rate of 3.5- 5 °C per minute is usually
recommended for reliable and reproducible TGA curve.
Heating Rate ∝“Decomposition Of Substances
Example : Polystrene decomposes at 395 °C When heated 5 °C
per minute, while at 375 °C when heated at 1°C per minute
• When we increase the heating rate ,then the decomposition
is same but procedural temperature is decrease
23.
23
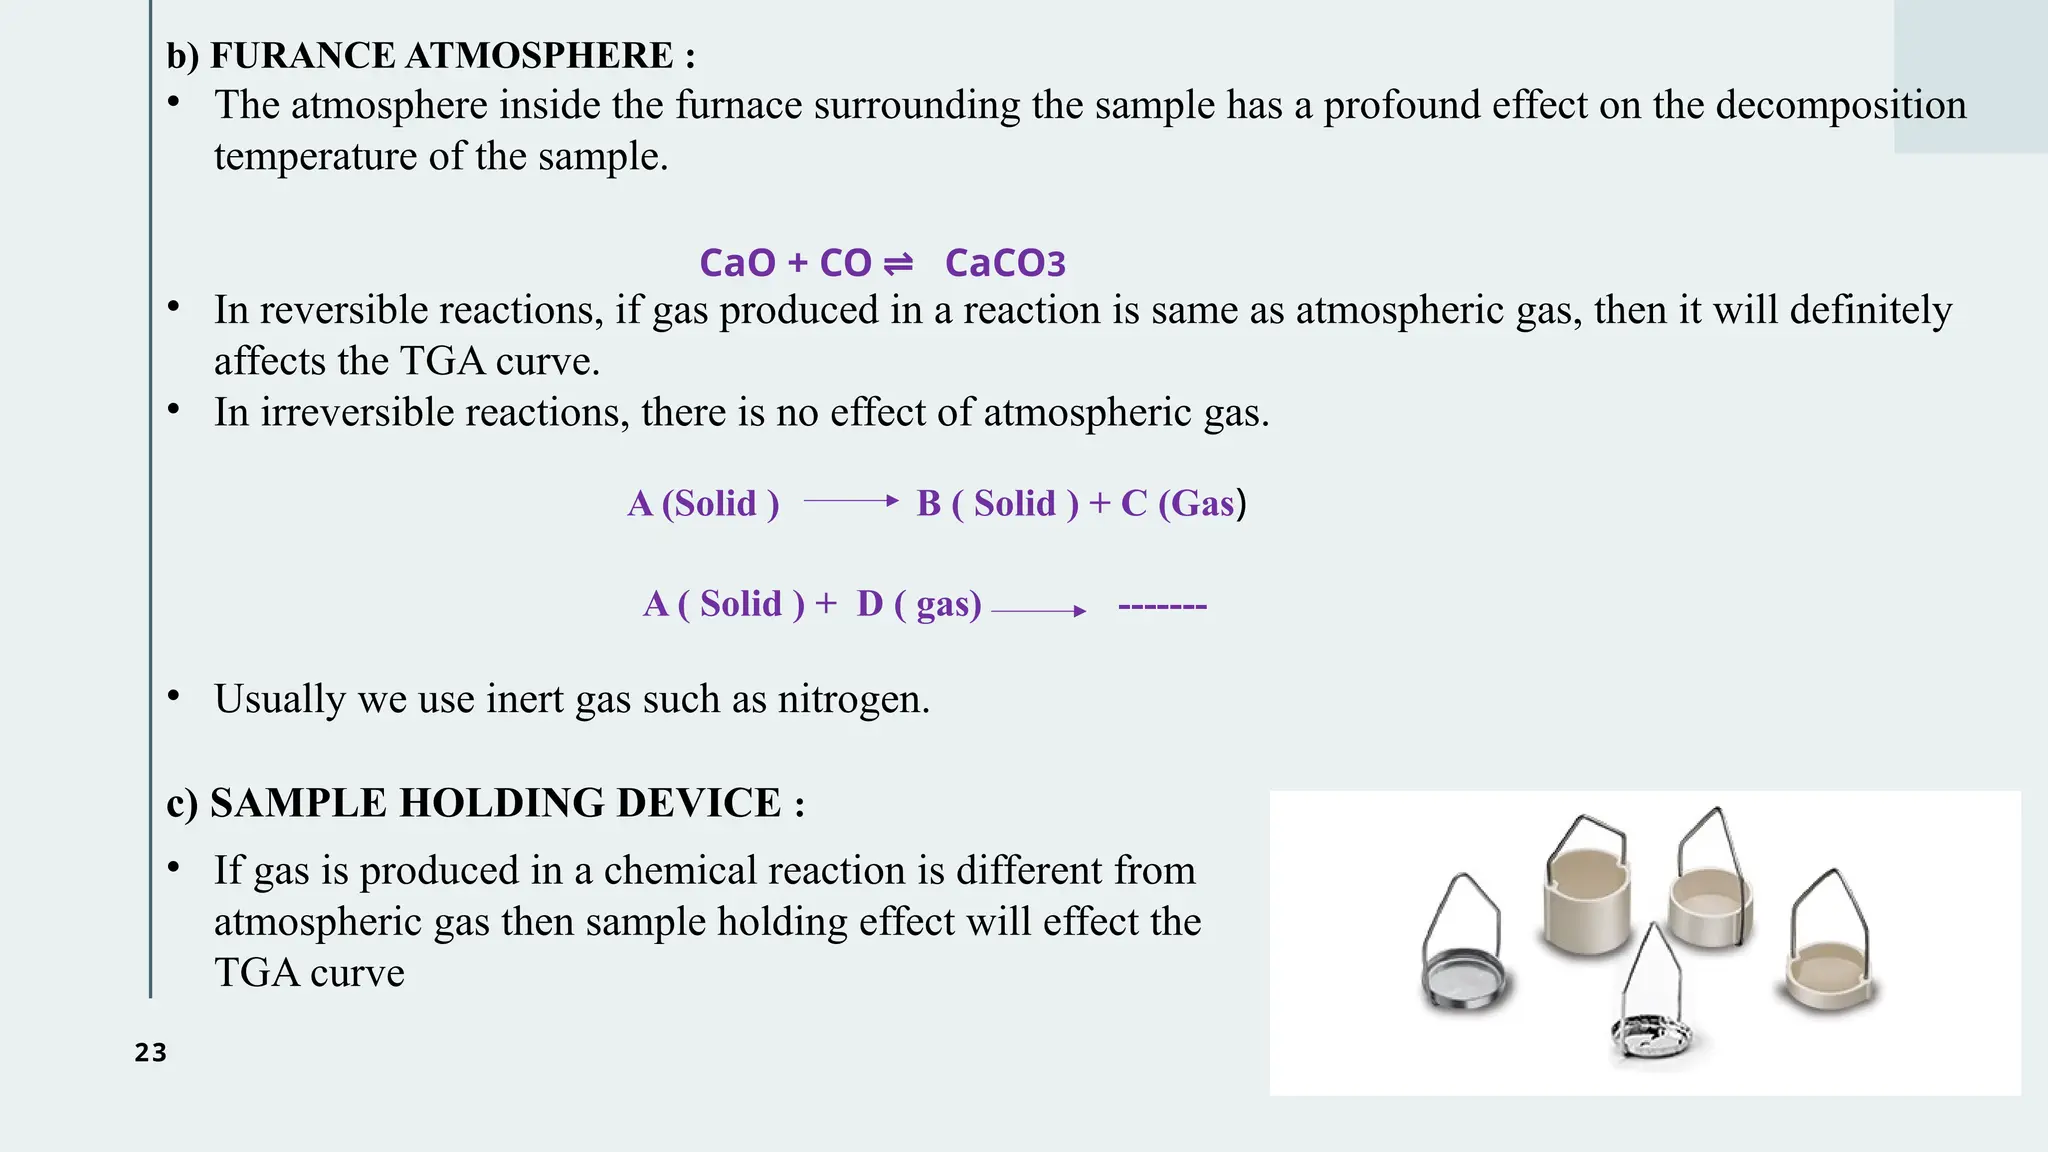
b) FURANCE ATMOSPHERE:
• The atmosphere inside the furnace surrounding the sample has a profound effect on the decomposition
temperature of the sample.
• In reversible reactions, if gas produced in a reaction is same as atmospheric gas, then it will definitely
affects the TGA curve.
• In irreversible reactions, there is no effect of atmospheric gas.
A ( Solid ) + D ( gas) -------
• Usually we use inert gas such as nitrogen.
CaO + CO CaCO
⇌ 3
A (Solid ) B ( Solid ) + C (Gas)
c) SAMPLE HOLDING DEVICE :
• If gas is produced in a chemical reaction is different from
atmospheric gas then sample holding effect will effect the
TGA curve
24.
24
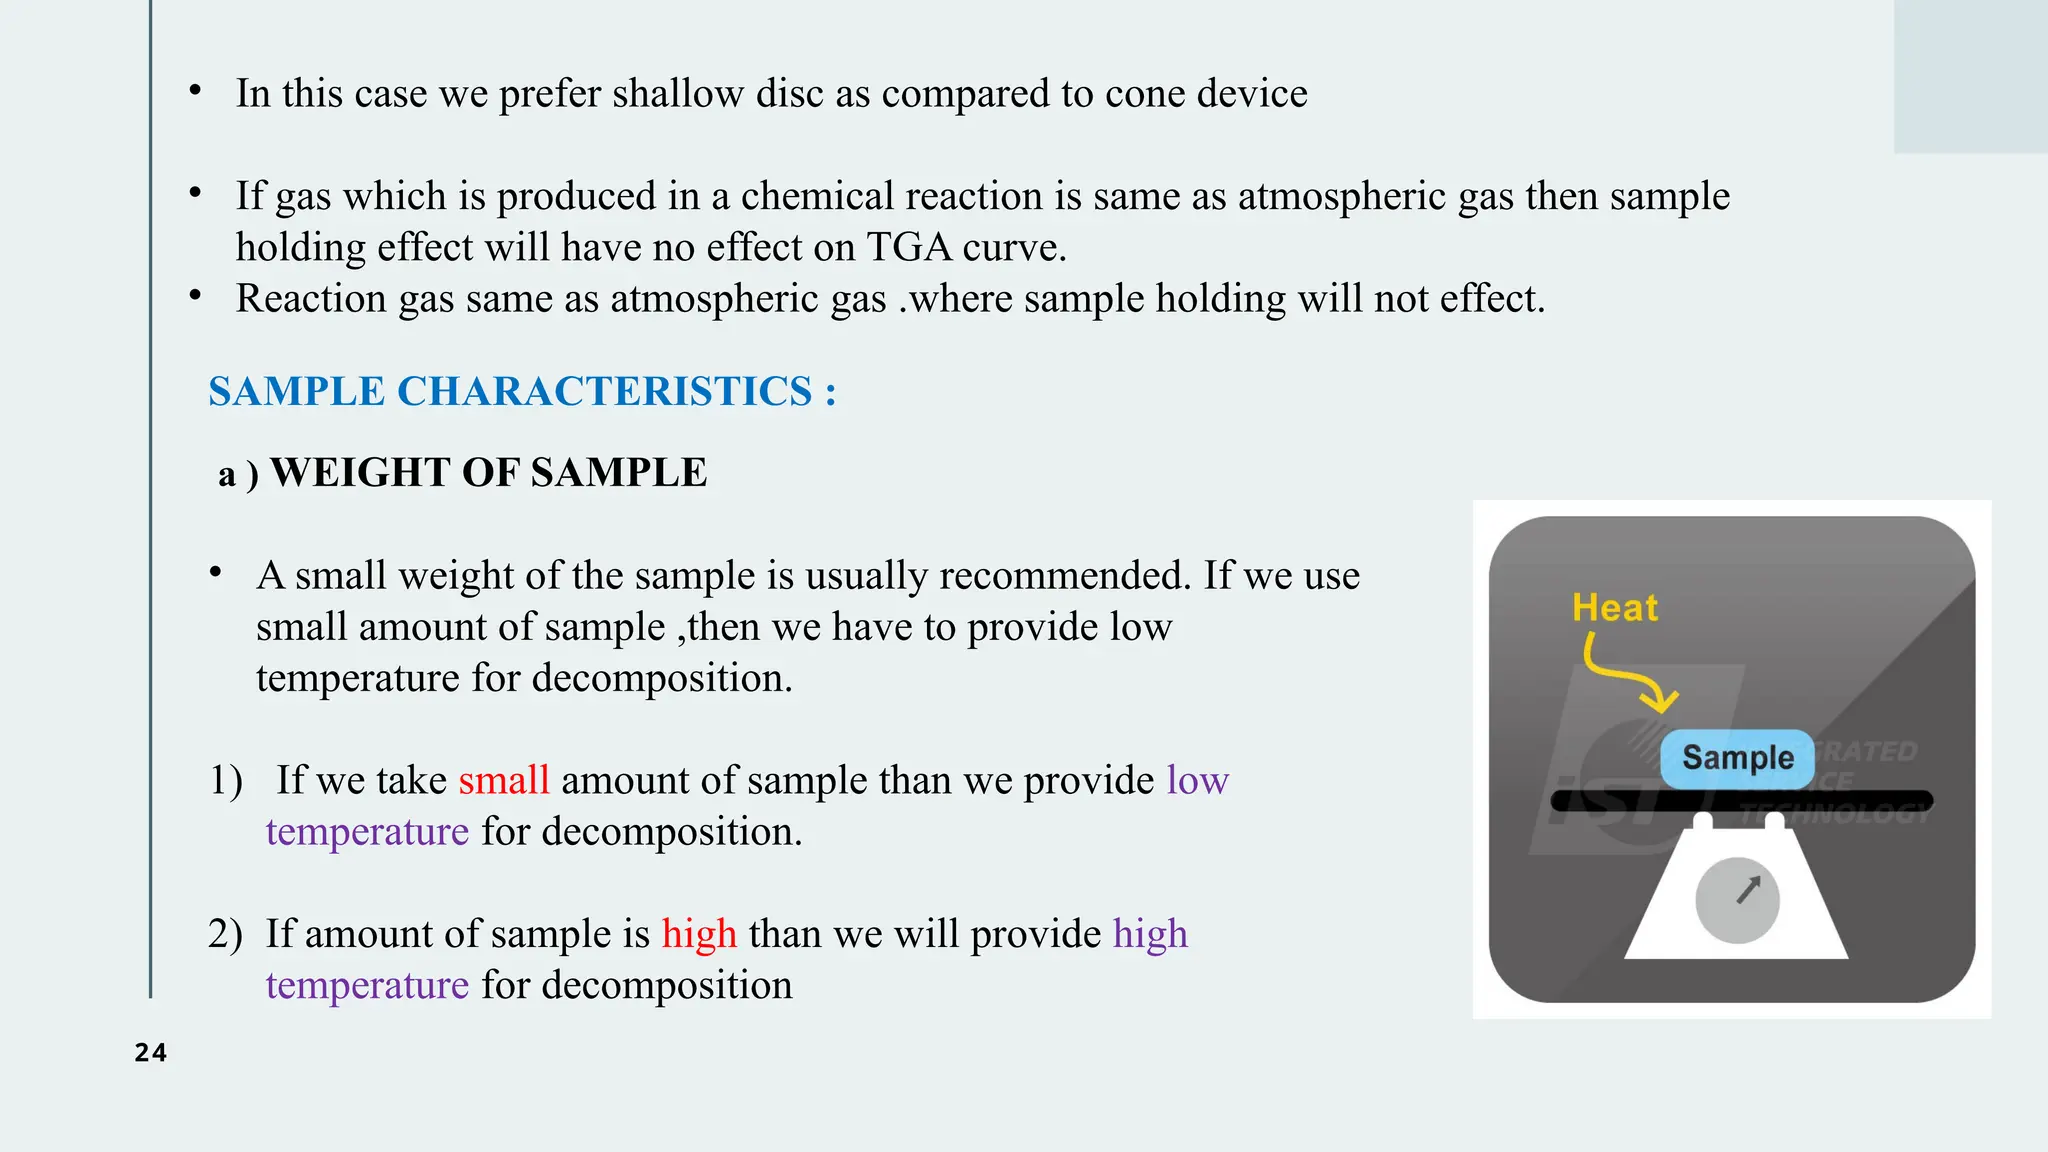
• In thiscase we prefer shallow disc as compared to cone device
• If gas which is produced in a chemical reaction is same as atmospheric gas then sample
holding effect will have no effect on TGA curve.
• Reaction gas same as atmospheric gas .where sample holding will not effect.
SAMPLE CHARACTERISTICS :
a ) WEIGHT OF SAMPLE
• A small weight of the sample is usually recommended. If we use
small amount of sample ,then we have to provide low
temperature for decomposition.
1) If we take small amount of sample than we provide low
temperature for decomposition.
2) If amount of sample is high than we will provide high
temperature for decomposition
25.
25
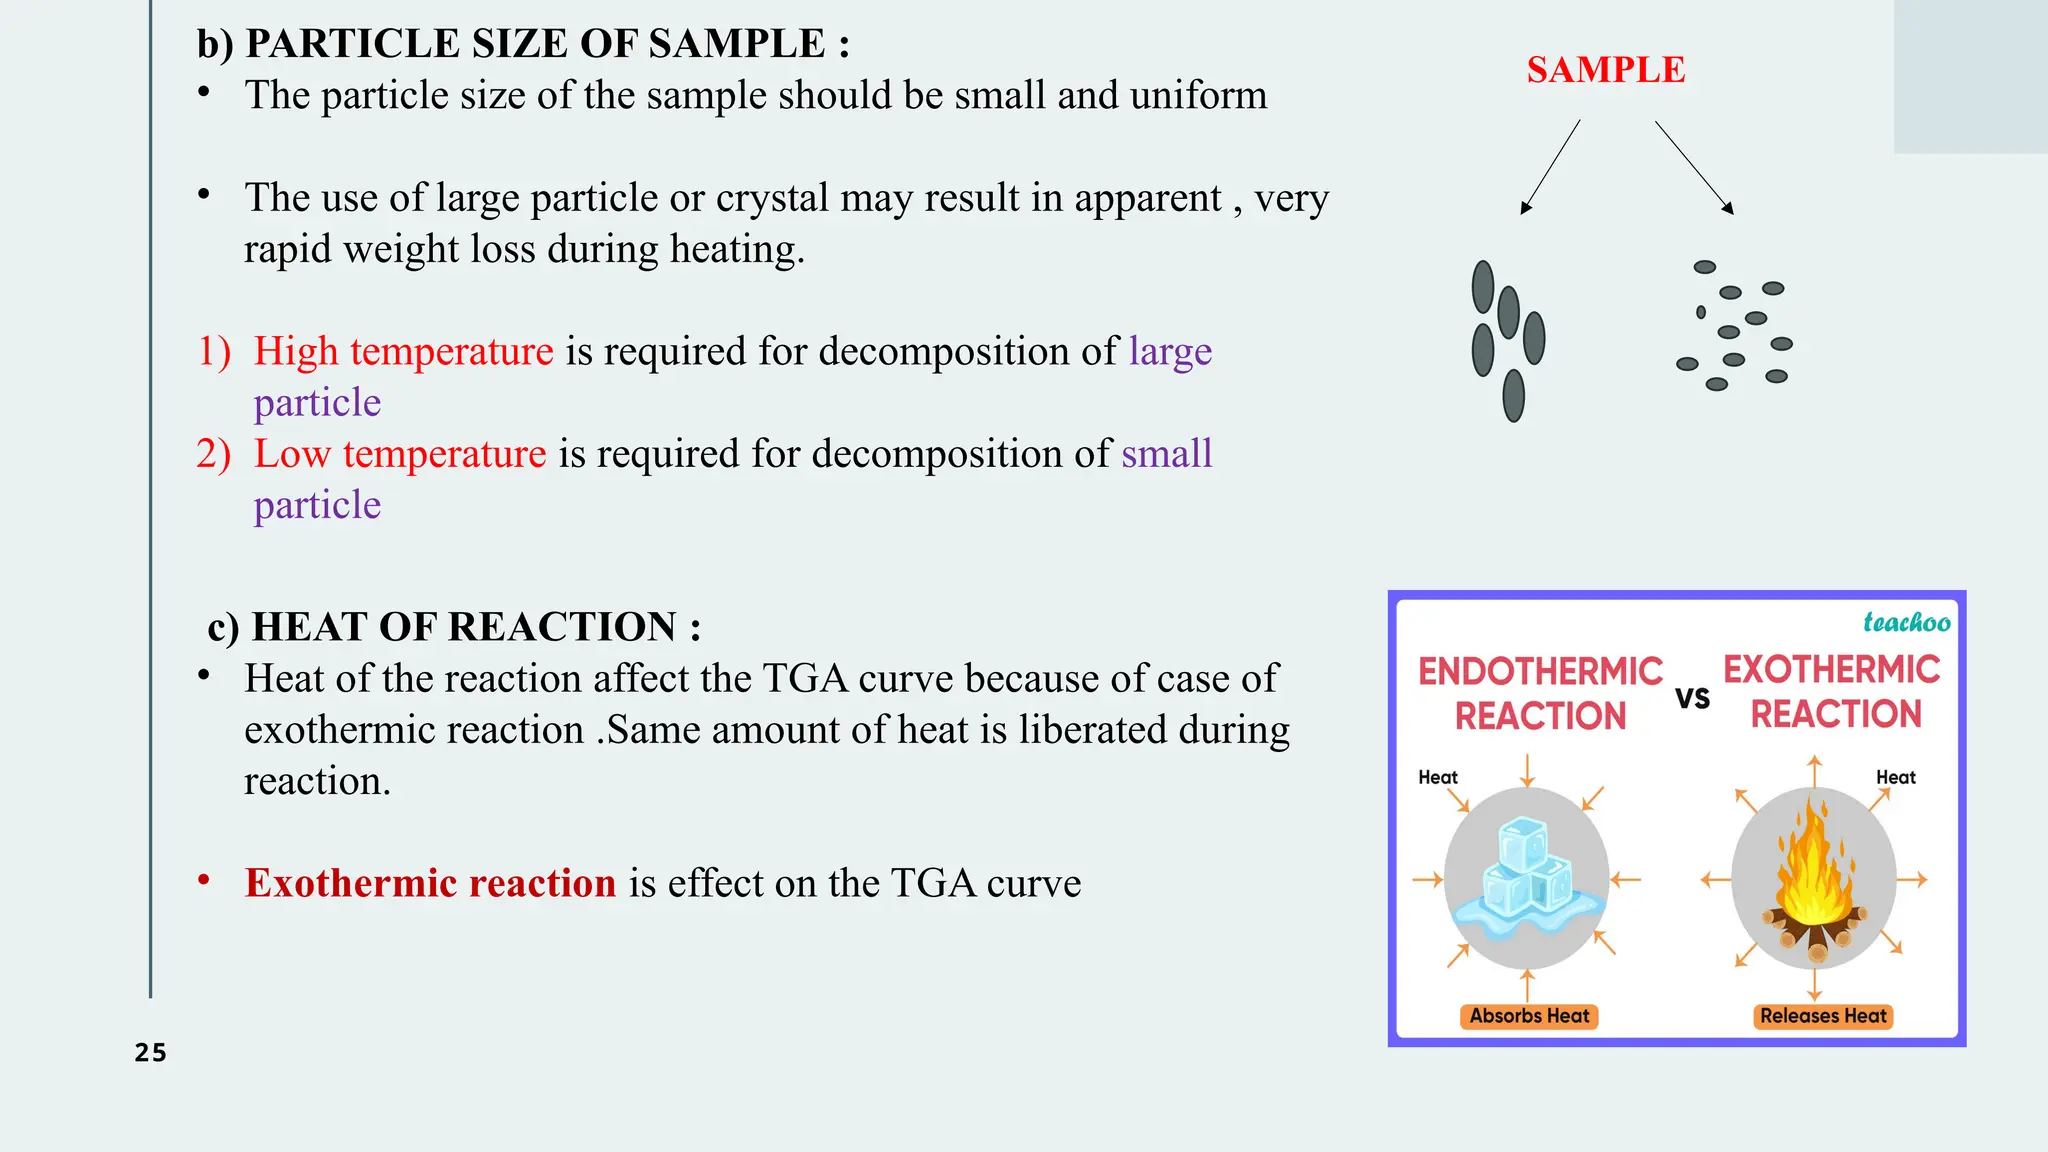
b) PARTICLE SIZEOF SAMPLE :
• The particle size of the sample should be small and uniform
• The use of large particle or crystal may result in apparent , very
rapid weight loss during heating.
1) High temperature is required for decomposition of large
particle
2) Low temperature is required for decomposition of small
particle
SAMPLE
c) HEAT OF REACTION :
• Heat of the reaction affect the TGA curve because of case of
exothermic reaction .Same amount of heat is liberated during
reaction.
• Exothermic reaction is effect on the TGA curve
28
- Advantages
1)High Precision:Can detect minute weight changes, offering detailed thermal stability
analysis.
2)Comprehensive Data: Provides insights into material decomposition, composition, and
phase transitions.
3)Versatile: Applicable to solids, liquids, and powders.
4)Rapid Analysis: Suitable for high-throughput testing in research and quality control.
5)No Need for Sample Preparation: Minimal sample preparation is required.
6)Wide Temperature Range: Can be used to analyze a variety of temperature-sensitive
materials.
7) Cooling time is very short therefore Thermogram can be recorded
8)TGA is a rapid process.
9) Easy sample changing and easy change of sample holder.
10)Fast heating rate with good resolution can be maintained.
29.
29
- Disadvantages
1)Complex Interpretation:Requires expert knowledge to interpret complex TGA curves
accurately.
2)Destructive: The sample undergoes thermal degradation, making it unsuitable for materials
that cannot be destroyed.
3)Sample Size Limitations: Small samples are needed, which may not represent bulk
properties.
4)Limited to Thermal Analysis: Cannot provide full compositional information on its own.
5)High Cost: The equipment and operational costs can be expensive.
6)Environmental Sensitivity: The results can be influenced by atmospheric conditions like
humidity or gas type
31
Applications of TGA
•Material Characterization: Used in polymers, pharmaceuticals, metals, and
ceramics.
• Decomposition Studies: Identifying components in mixtures.
• Heat Stability Tests: Studying how materials perform under high temperatures.
• Determining Moisture Content: In powders or bulk solids.
• Environmental Studies: Analysing waste or carbon content.
36
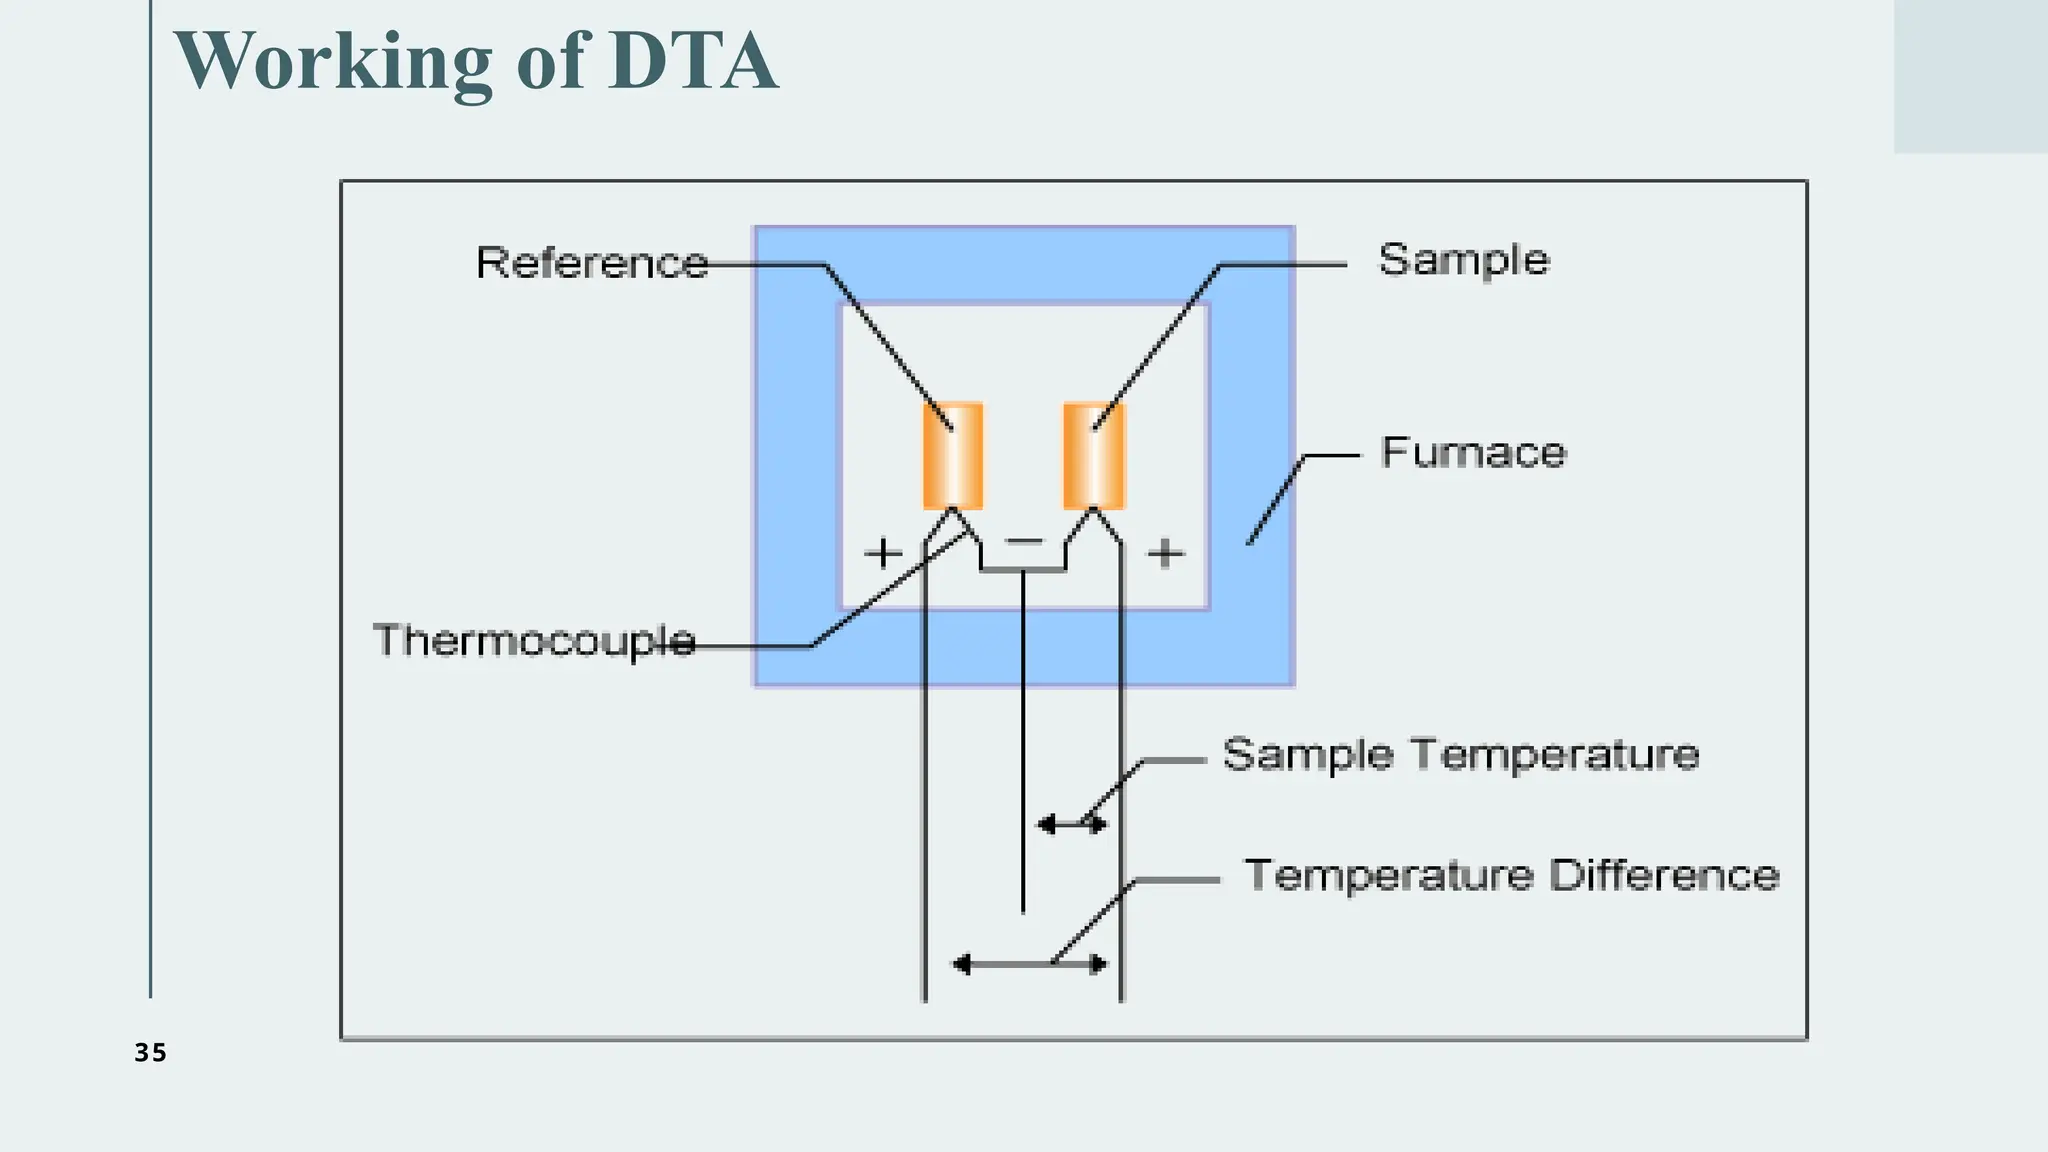
Working of DTA
•Sample preparation (2- sample and reference material)
• Load in container or holders
• Later holders placed in a compartment.
• Place thermocouple in this 2 sample.
• Heat the sample and reference material.
• The metal block which surrounds compartment act as heat sink contain internal heater
which is increase temperature and heat the sample.
• Thermocouple attached with the amplifier which converts the heat signal into electric
signal send this results to read out unit which display the results as thermogram.
• E.g. – Metal oxide decomposed and produce carbon dioxide which is a endothermic
reaction where heat absorbed and the sample temperature decreased. Now the sample
temperature is less than the reference temperature. This temperature difference between
both material produces net signal, which is then recorded.
38
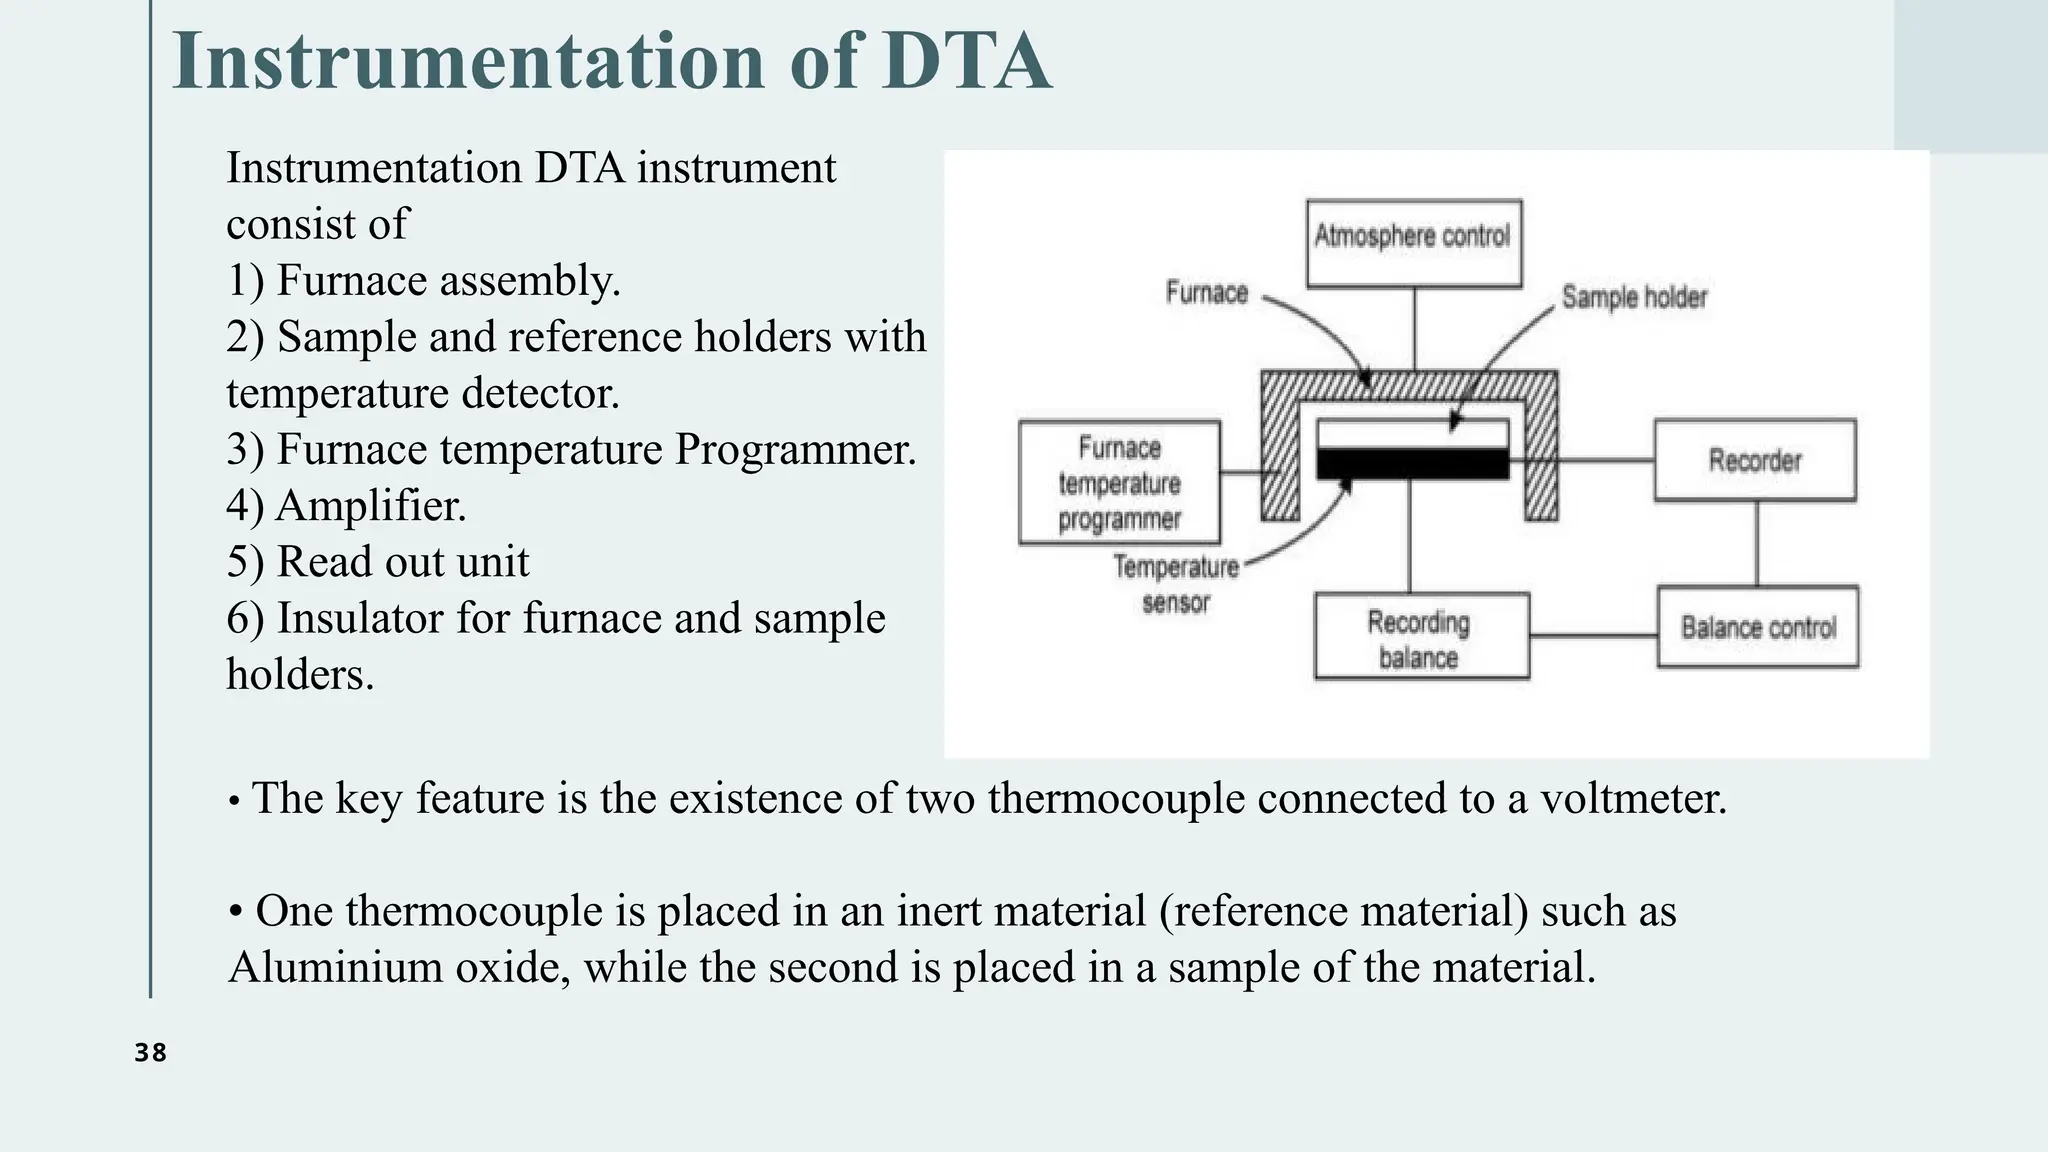
Instrumentation of DTA
InstrumentationDTA instrument
consist of
1) Furnace assembly.
2) Sample and reference holders with
temperature detector.
3) Furnace temperature Programmer.
4) Amplifier.
5) Read out unit
6) Insulator for furnace and sample
holders.
• The key feature is the existence of two thermocouple connected to a voltmeter.
• One thermocouple is placed in an inert material (reference material) such as
Aluminium oxide, while the second is placed in a sample of the material.
39.
39
1) Furnace assembly
Itworks as a temperature Programmer.
• There are many furnaces which are used ,depending upon the sample material
and the rate of heating.
• In DTA apparatus, one always prefers a tubular furnace.
• This is constructed with an appropriate material(9-1 1/30or ribbon) wound on
a refractory tube.
• These are fairly inexpensive.
• Generally, the choice of the resistance material as well that of refractory is
decided from the internal maximum temperature of operation and
gaseous environments.
• E.g. -
I. nichrome furnace made up of nickel and chromium alloy used when rate
of heating is up to 1300°C.
II. Platinum furnace – 1750°C
III. Molybdenum furnace – 2000°C
40.
40
2) Sample &reference holder with temperature detector
• In DTA apparatus, two compartments are present, one for the sample and other for
reference material. The holders are designed in a manner that they can accommodate
even a small sample quantity for both material and give maximum thermal effect.
• Holders are made up of Platinum, stainless steel, nickel, silver and alloy
Temperature detector
• The holders are connected with the temperature detector which measures the sample
and reference material temperature.
• In order to control temperature, the three basic elements are required Sensor , on/off
control and heater.
• In this device the Sensor signal indicates the temperature has become greater then the
set point the heater is immediately get stop
41.
41
3) Furnace TemperatureProgrammer
• Electronic temperature regulators are used to ensure constant rate of heating
of the furnace for temperature regulation.
• It provides smooth heating or a cooling at a linear rate by changing the
voltage through heating components.
• Modern DTA instrument incorporate electronic temperature controller in
which the signal from thermocouple in furnace is compared against reference
potential which can be Programmed to corresponds to a variety of heating
modes and heating rates
42.
42
4) Amplifier
• Itis used to display the results in the form of thermogram. Nowadays, the read-
out devices have microprocessors that delivers interpreted thermogram or
output compatible with computer and printer thus minimizing the risk of
operator errors.
5) Read out unit
• Amplifier It is used for signal amplification. It converts heat signal into electric
signal.
• It is low noise circuit.
43.
43
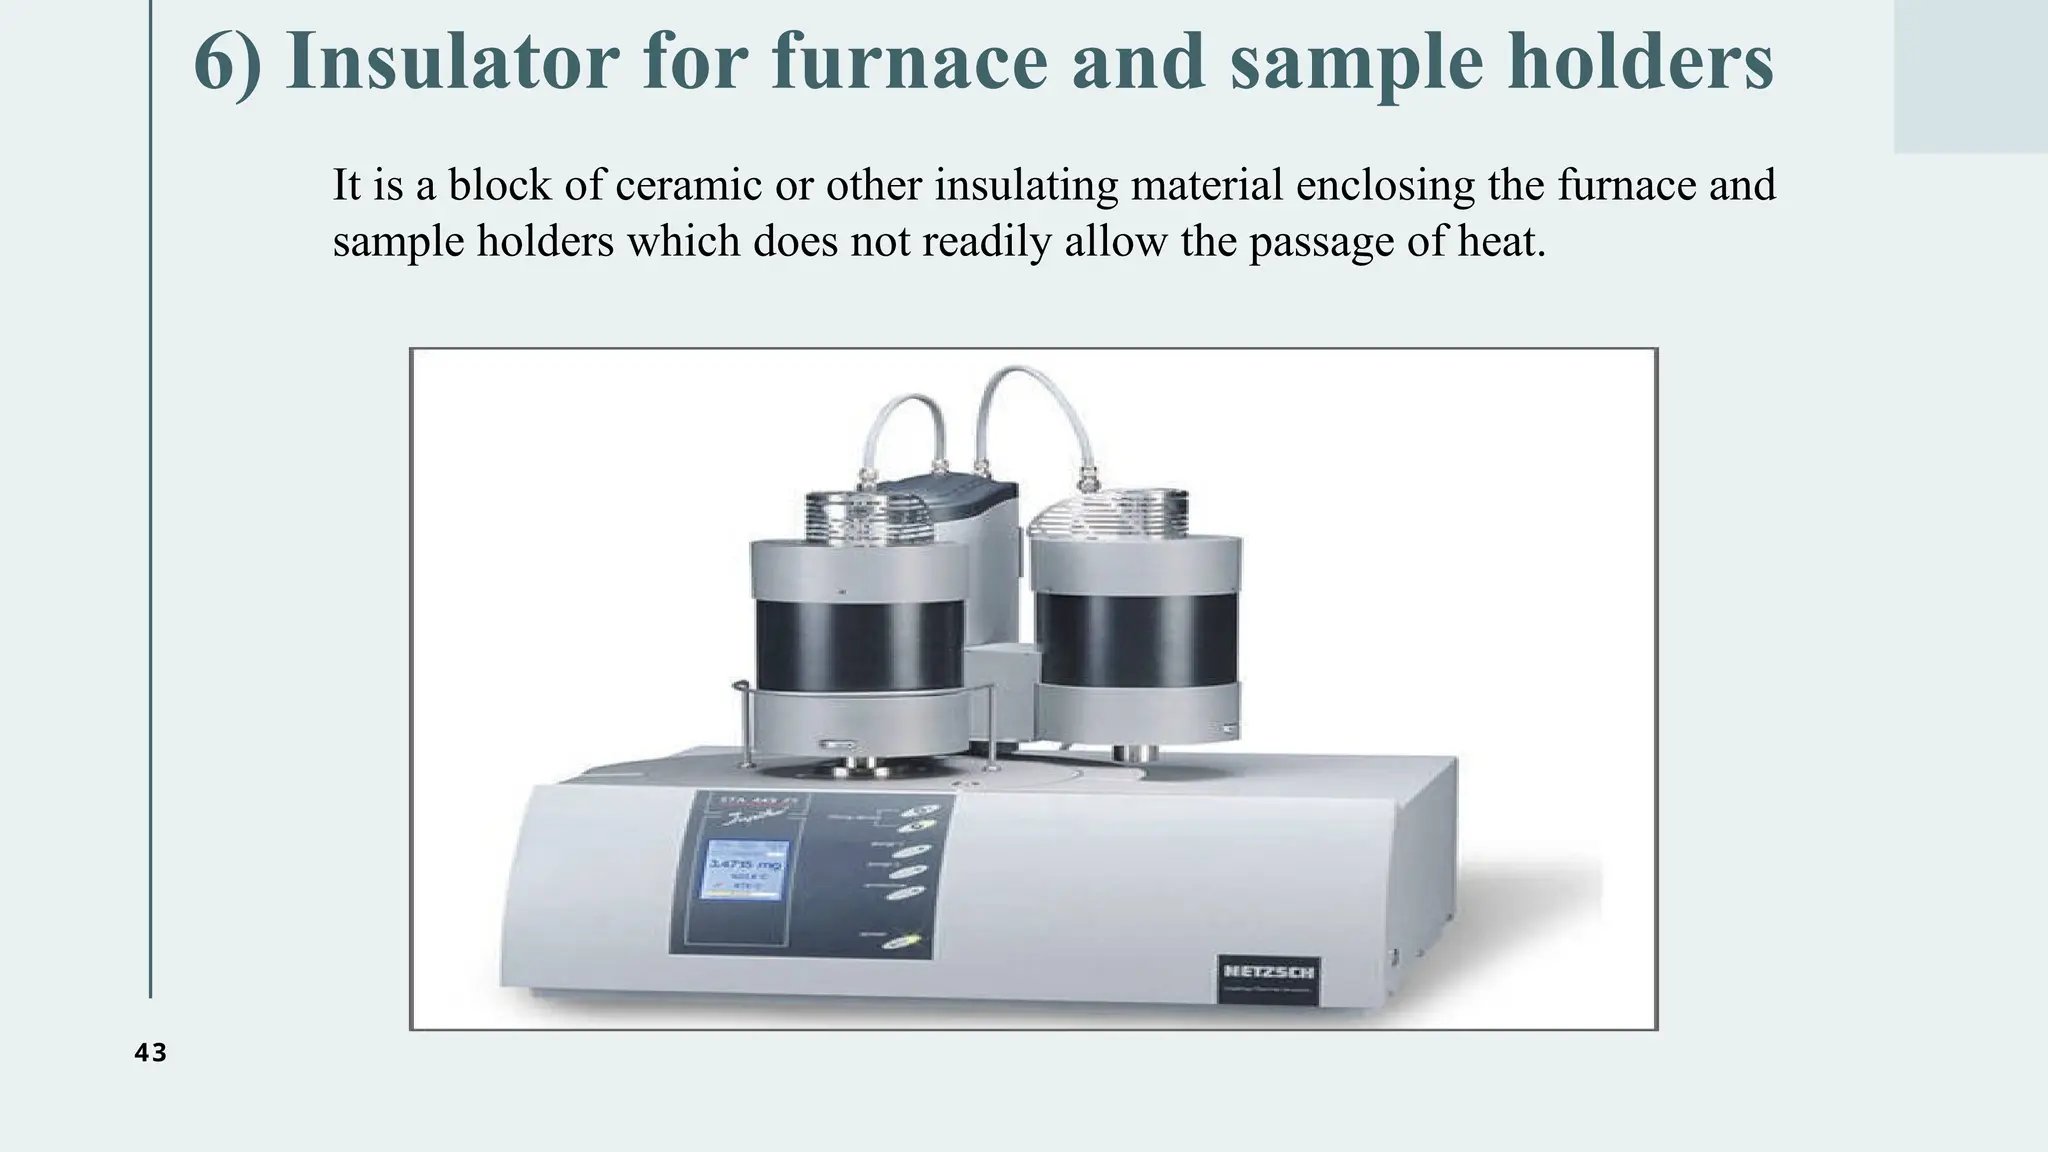
6) Insulator forfurnace and sample holders
It is a block of ceramic or other insulating material enclosing the furnace and
sample holders which does not readily allow the passage of heat.
44.
44
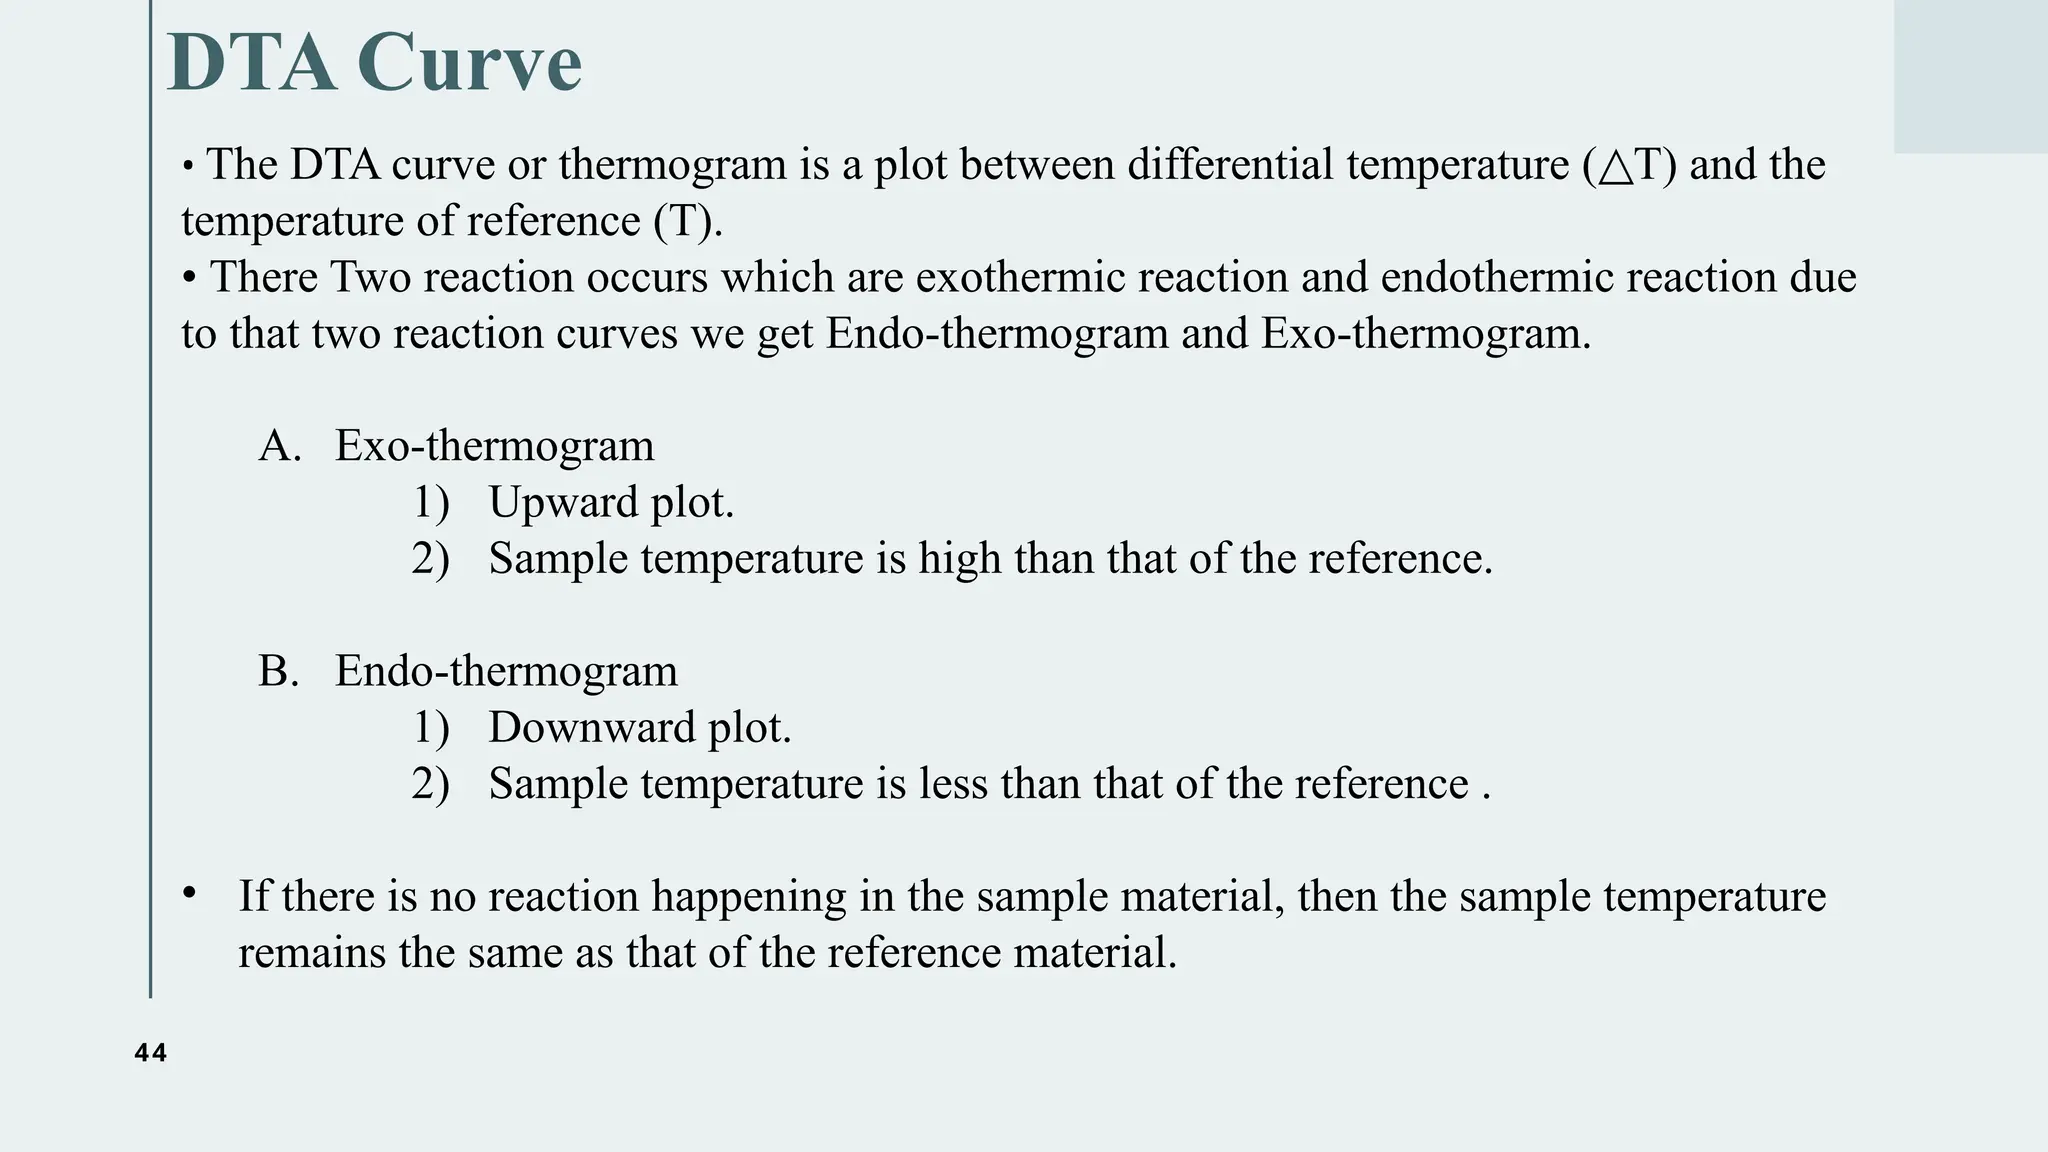
DTA Curve
• TheDTA curve or thermogram is a plot between differential temperature ( T) and the
△
temperature of reference (T).
• There Two reaction occurs which are exothermic reaction and endothermic reaction due
to that two reaction curves we get Endo-thermogram and Exo-thermogram.
A. Exo-thermogram
1) Upward plot.
2) Sample temperature is high than that of the reference.
B. Endo-thermogram
1) Downward plot.
2) Sample temperature is less than that of the reference .
• If there is no reaction happening in the sample material, then the sample temperature
remains the same as that of the reference material.
45.
45
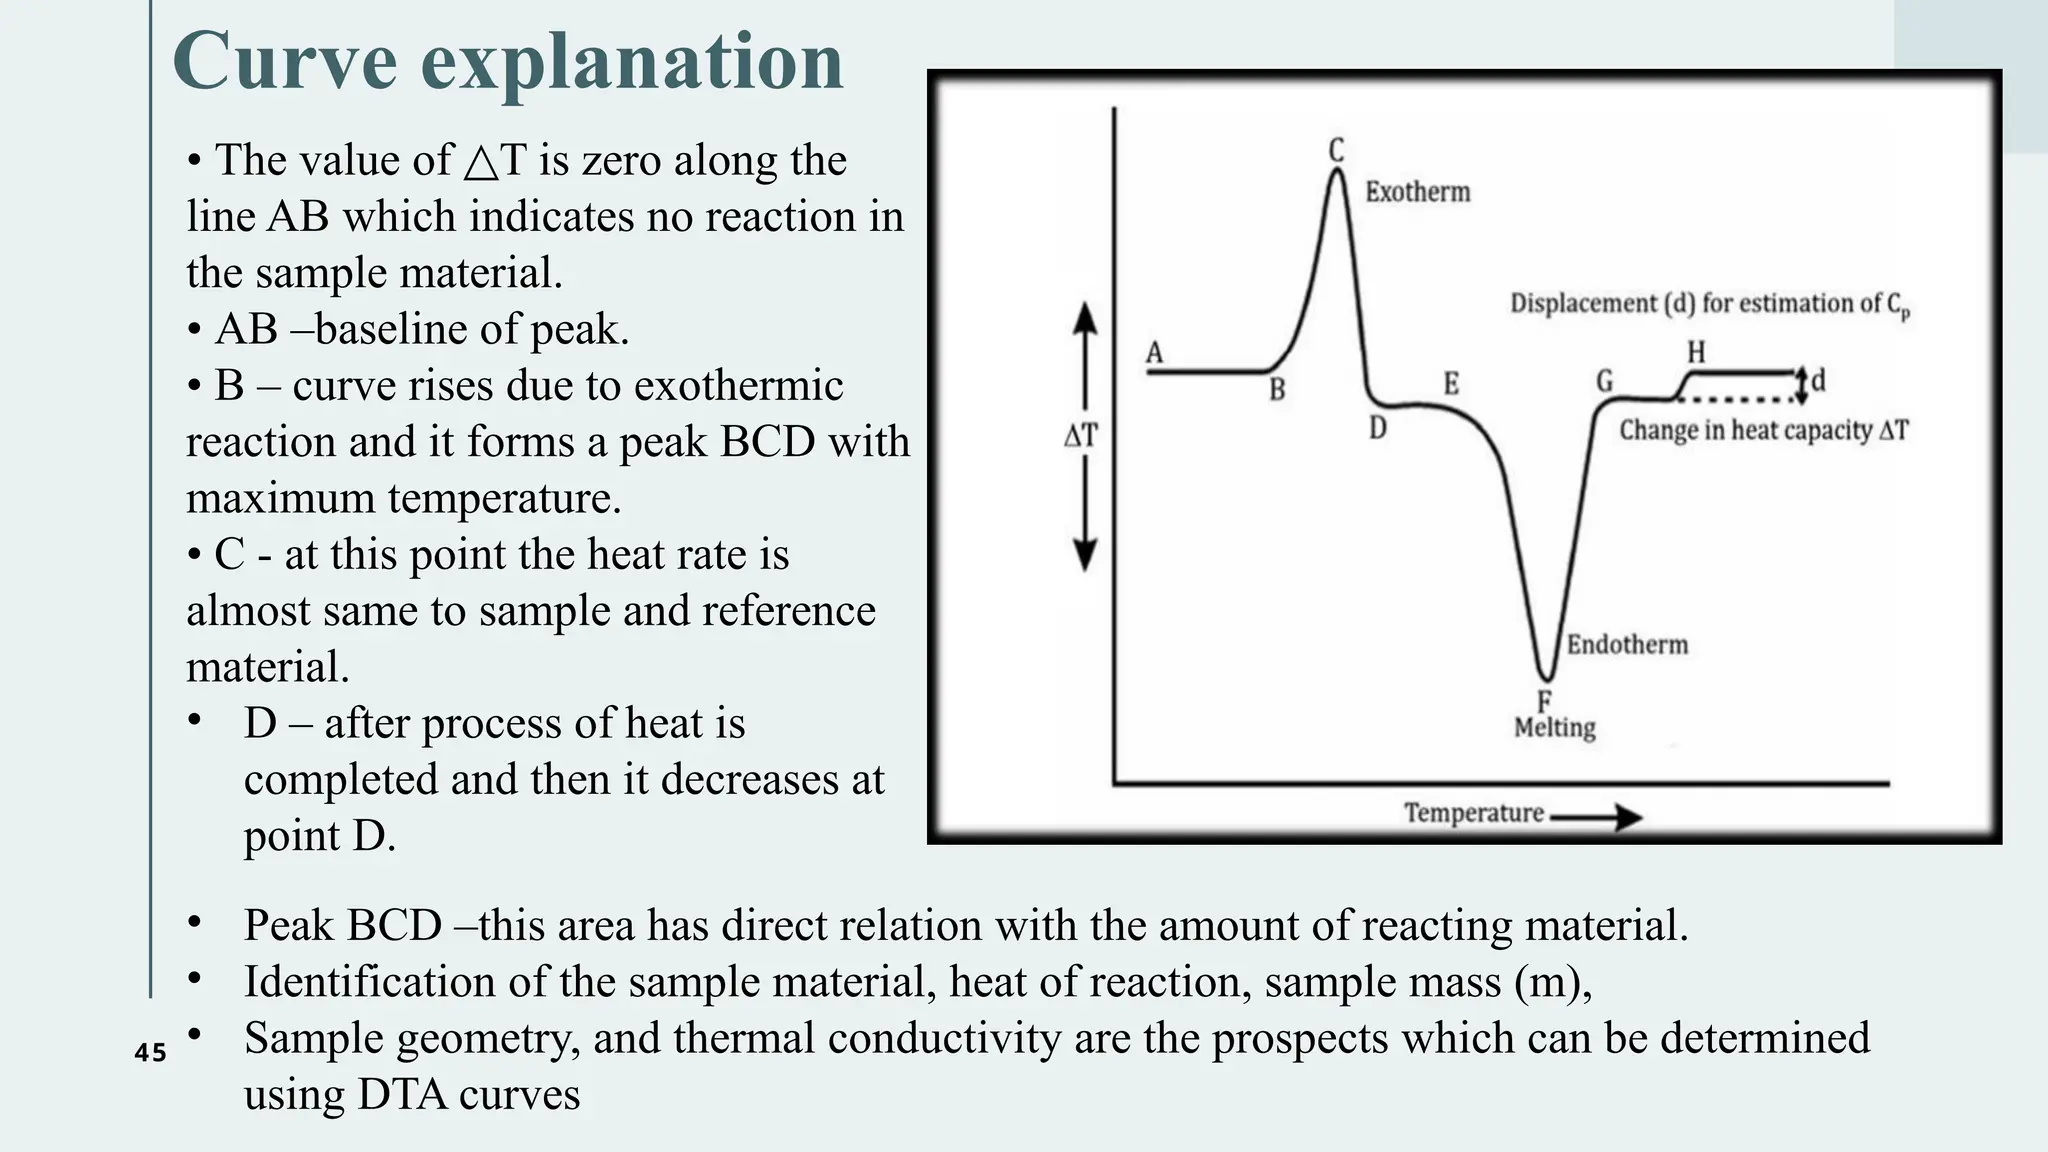
Curve explanation
• Thevalue of T is zero along the
△
line AB which indicates no reaction in
the sample material.
• AB –baseline of peak.
• B – curve rises due to exothermic
reaction and it forms a peak BCD with
maximum temperature.
• C - at this point the heat rate is
almost same to sample and reference
material.
• D – after process of heat is
completed and then it decreases at
point D.
• Peak BCD –this area has direct relation with the amount of reacting material.
• Identification of the sample material, heat of reaction, sample mass (m),
• Sample geometry, and thermal conductivity are the prospects which can be determined
using DTA curves
47
Factors affecting DTAcurve
Differential thermal analysis is not a dynamic thermal analytical technique due to
that it’s value can derivate because of many factors which can be divided into four
major groups.
A) Sample factor
B) Instrumental factors
C) Physical factors
D) Chemical factors
A) Sample factor
• Amount of the sample
• Packing density
• Particle size of the sample material
• Degree of crystallinity.
• Heat capacity
• Thermal conductivity.
• Dilutes of the diluent
• Swelling of the sample.
• Shrinkage of the sample.
48.
48
Factors affecting DTAcurve
B) Instrumental factors
• Size or shape of the sample holders.
• Material of the sample holders.
• Recording system sensitivity.
• Rate of heating of the sample.
• Atmosphere around the sample.
• Thermocouple location in the sample.
• Instrumental design.
C) Physical factors – They further divided into two groups. Some
will affect the endo thermogram curve and some will affect exo-
thermogram curve.
1) Exo-thermogram factors
• Adsorption
• Change in crystal structure
• Crystallization.
49.
49
Factors affecting DTAcurve
2) Endo-thermogram factors
• Desorption.
• Change in crystal structure.
• Melting.
• Vaporization.
• Sublimation.
D) Chemical factors – They further divided into two groups. Some will affect the
endothermic reaction and some will affect exothermic reaction.
1) Exothermic reaction factors
1) • Oxidation
2) • Break down reaction
3) • Chemisorption.
4) • Solid state reaction.
2) Endothermic reaction factors
1) • Reduction.
2) • Break down reaction.
• Solid state reaction
51
Advantages
1)Broad Applicability –useful for studying phase transition ,decomposition ,
oxidation, and other thermal properties of materials
2) Simple and versatile – can analyze solid liquids and powders with minimal sample
preparation .
3) High sensitivity – Detects even small thermal changes, making it useful for
identifying subtle materials transformation
4) wide temperature range – can be used across a broad temperature spectrum
depending on the instrument .
5) Provides Qualitative information – Helps identify chemical and physical changes
such as melting point , crystallization and decomposition .
6) Compatible with other techniques- can be combined with techniques like
thermogravimetric analysis (TGA) for more comprehensive material characterization .
52.
52
Disadvantages
1) Limited qualitativeanalysis- DTA provides Qualitative insight, it does not directly
measure mass loss like TGA.
2) Accuracy Depends on Experimental condition – variation in heating rate ,sample
size , or atmosphere can affect results .
3) Require calibration – reference material must be carefully chosen and calibrated
to ensure accurate results.
4) Potential Thermal lag – temp differences may not be recorded instantly, affecting
time sensitive studies.
5) Less precise than differential scanning calorimetry (DSC) – DSC provides more
accuracy the heat flow measurements, making it preferable in some applications
54
Application of DTA
•Qualitative and Quantitative Identification of Minerals: detection of any
minerals in a sample.
• PHA Polymeric Materials: DTA useful for the characterization of polymeric
materials in the light of identification of thermo physical, thermo chemical, thermo
mechanical and thermo elastic changes or transitions.
• Measurement of Crystalline: measurement of the mass fraction of crystalline
material.
• Analysis of Biological Materials: DTA curves are used to date bone remains or to
study archaeological materials.
• DTA is also widely used in the ceramics and metals industry. The technique is
capable of studying high-temperature processes (up to 2400°C for some units) and
relatively large sample sizes (hundreds of milligrams).
• DTA is used to study decomposition temperatures, phase transitions, melting and
crystallization points, and thermal stability.
• An important use of DTA is for the generation of phase diagrams and the study of
phase transitions
56
-Derivative Differential ThermalAnalysis
Derivative Differential Thermal Analysis (DDTA):
• In DDTA, the first derivative of the DTA curve is taken with respect to
temperature or time.
• The DDTA curve emphasizes changes in slope on the DTA curve and sharpens
peak detection, making it easier to identify onset points and transitions with
greater accuracy.
• It helps in the precise determination of peak maxima and onset temperatures, and
can differentiate between closely spaced thermal events that may appear as
overlapping peaks on the DTA curve.
Key uses of DDTA:
• More accurate determination of phase transition temperatures.
• Better resolution of overlapping peaks.
• Detection of subtle thermal events.
• Quantitative interpretation of reaction kinetics when combined with other
methods.
58
References
1) Dr. ChandanR. S., Dr. Sanjay G.W., Dr. Vinod M.T., Pharmaceutical analysis,
Nirali Prakashan, T. Y. Pharm. D book.
2) Andrew J Pasztor , the Dow chemical company, Handbook of Instrumental
technique for analytical chemistry.
3) Willard Merritt dean settle , Instrumental method of analysis, Seventh Edition.
4) Gurdeep R Chatwal, Instrumental method of chemical analysis


![THERMOGRAVIMETRY ANALYSIS [TGA] AS PER PCI[M.PHARM]](https://cdn.slidesharecdn.com/ss_thumbnails/49-191219085241-thumbnail.jpg?width=640&height=640&fit=bounds)


![THERMOGRAVIMETRY ANALYSIS [TGA] AS PER PCI](https://cdn.slidesharecdn.com/ss_thumbnails/30tga-191218113650-thumbnail.jpg?width=640&height=640&fit=bounds)


