Download to read offline
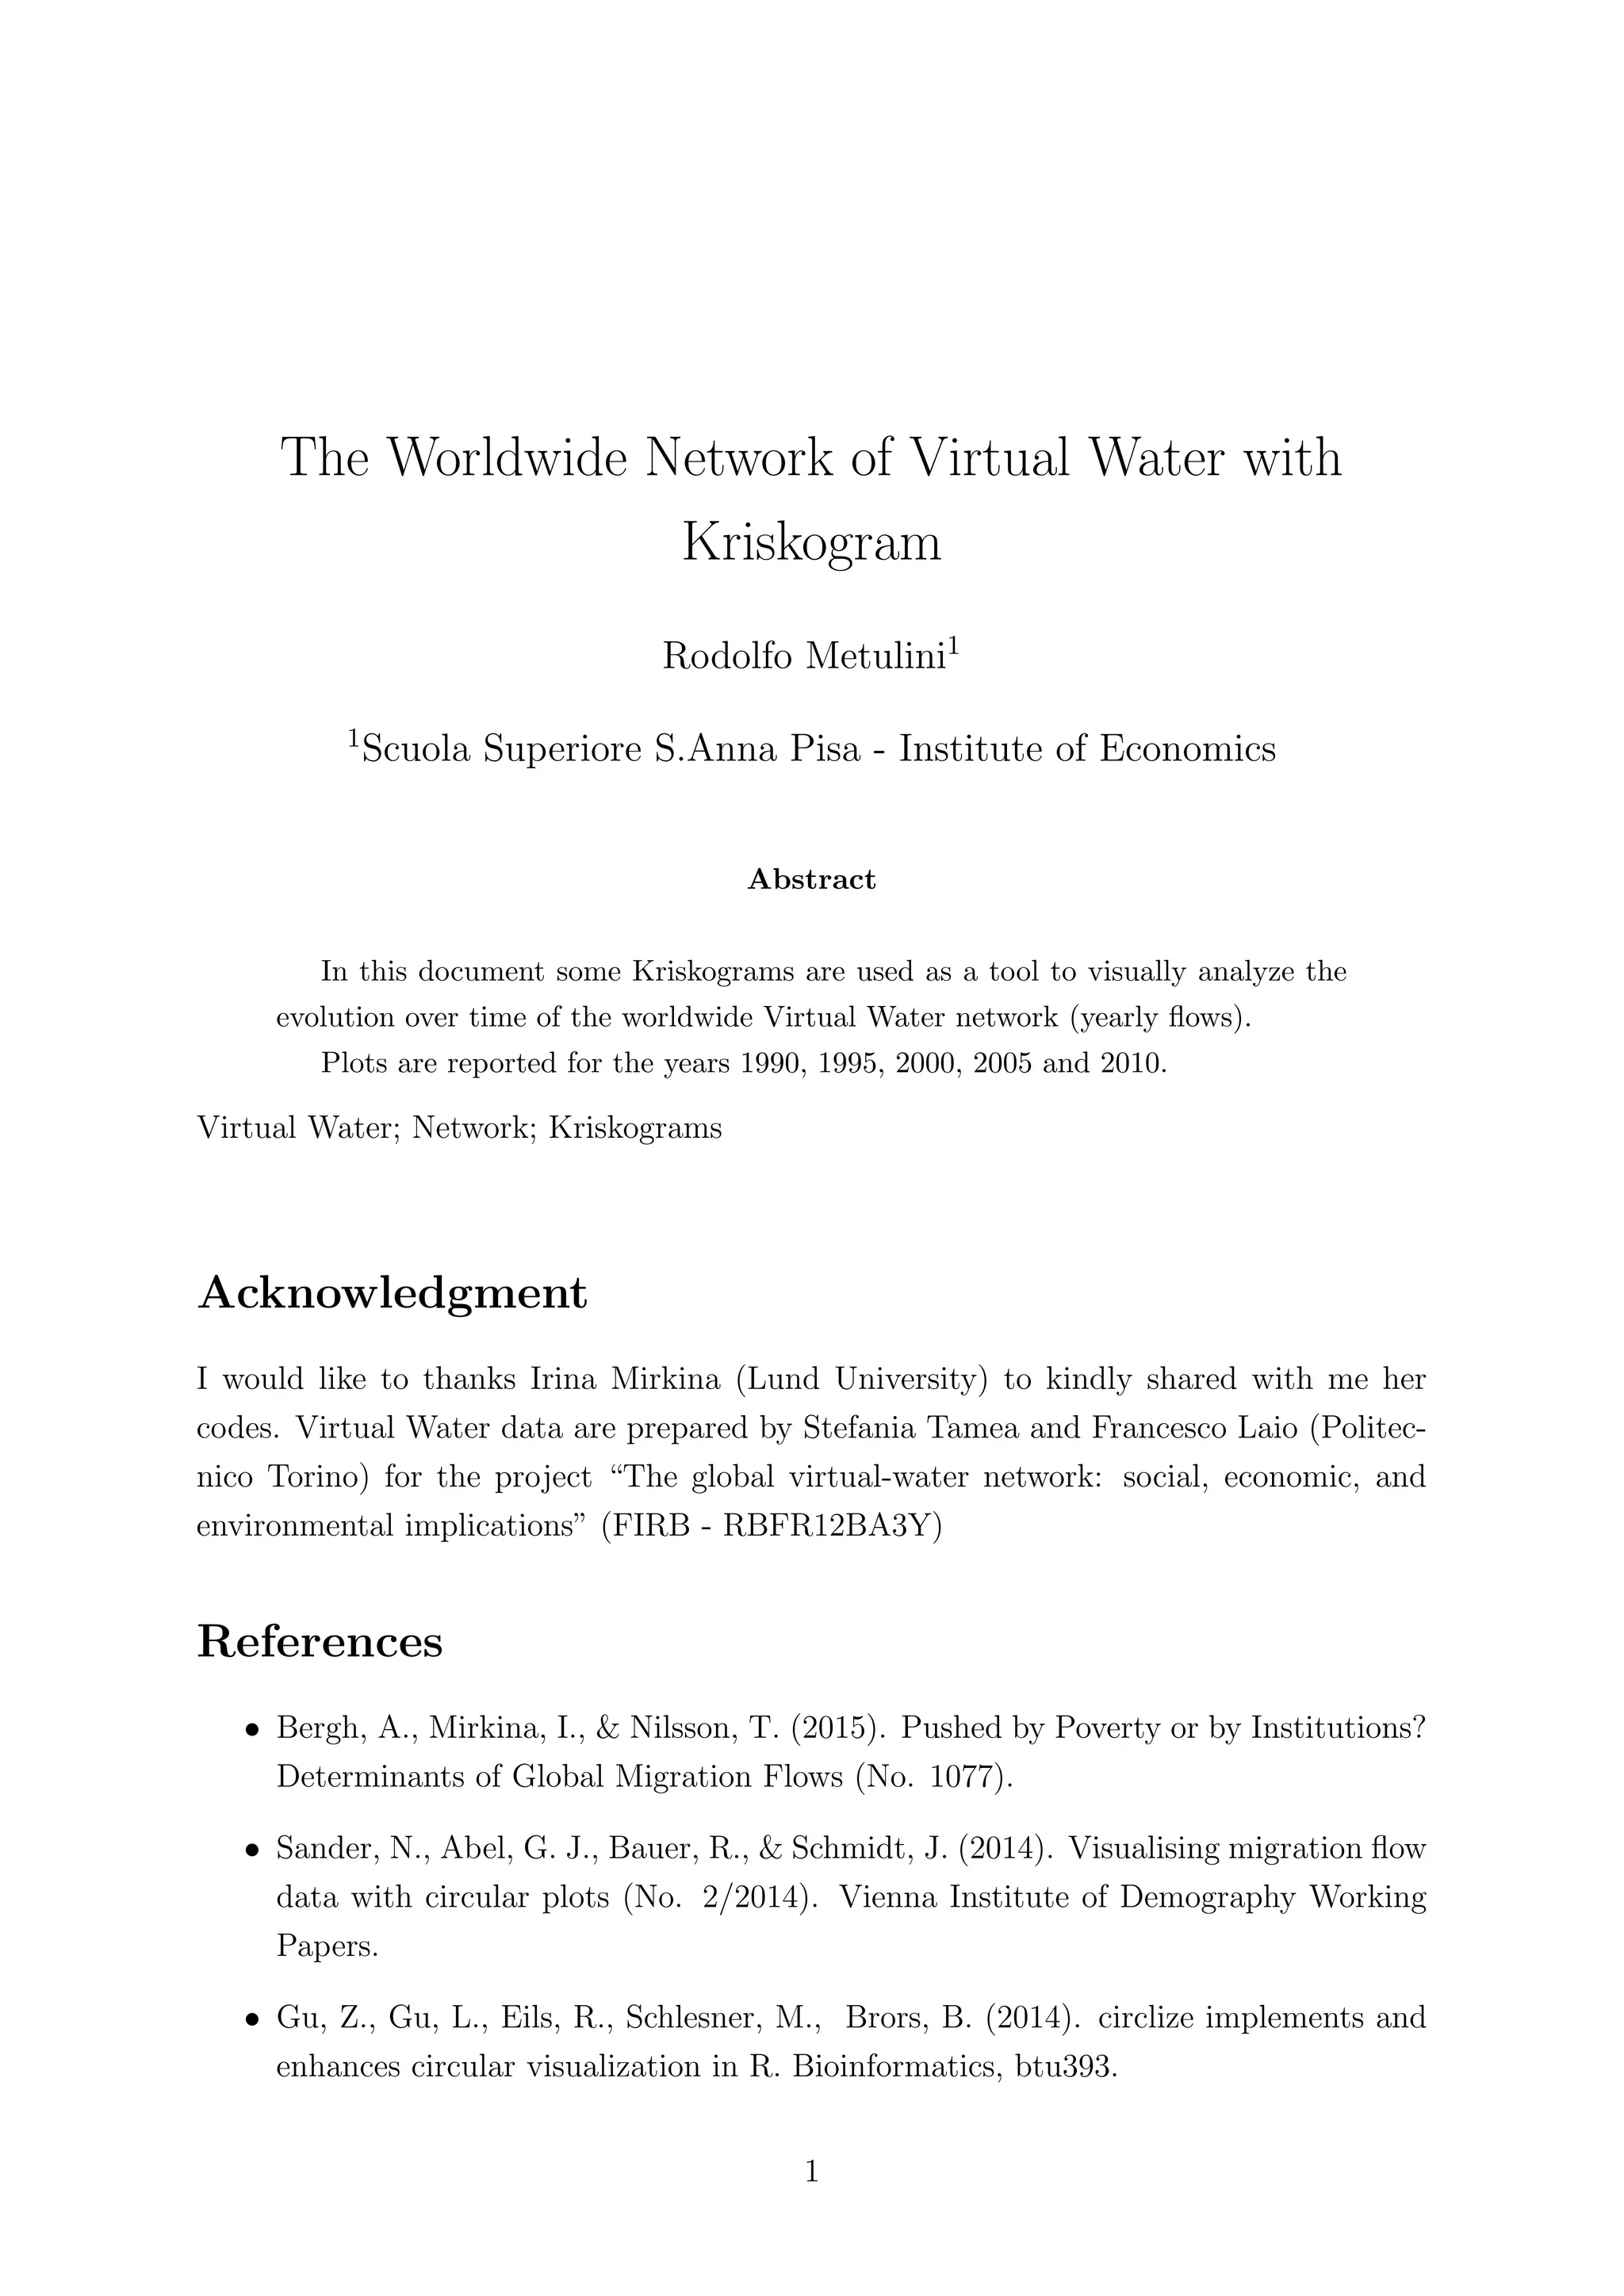
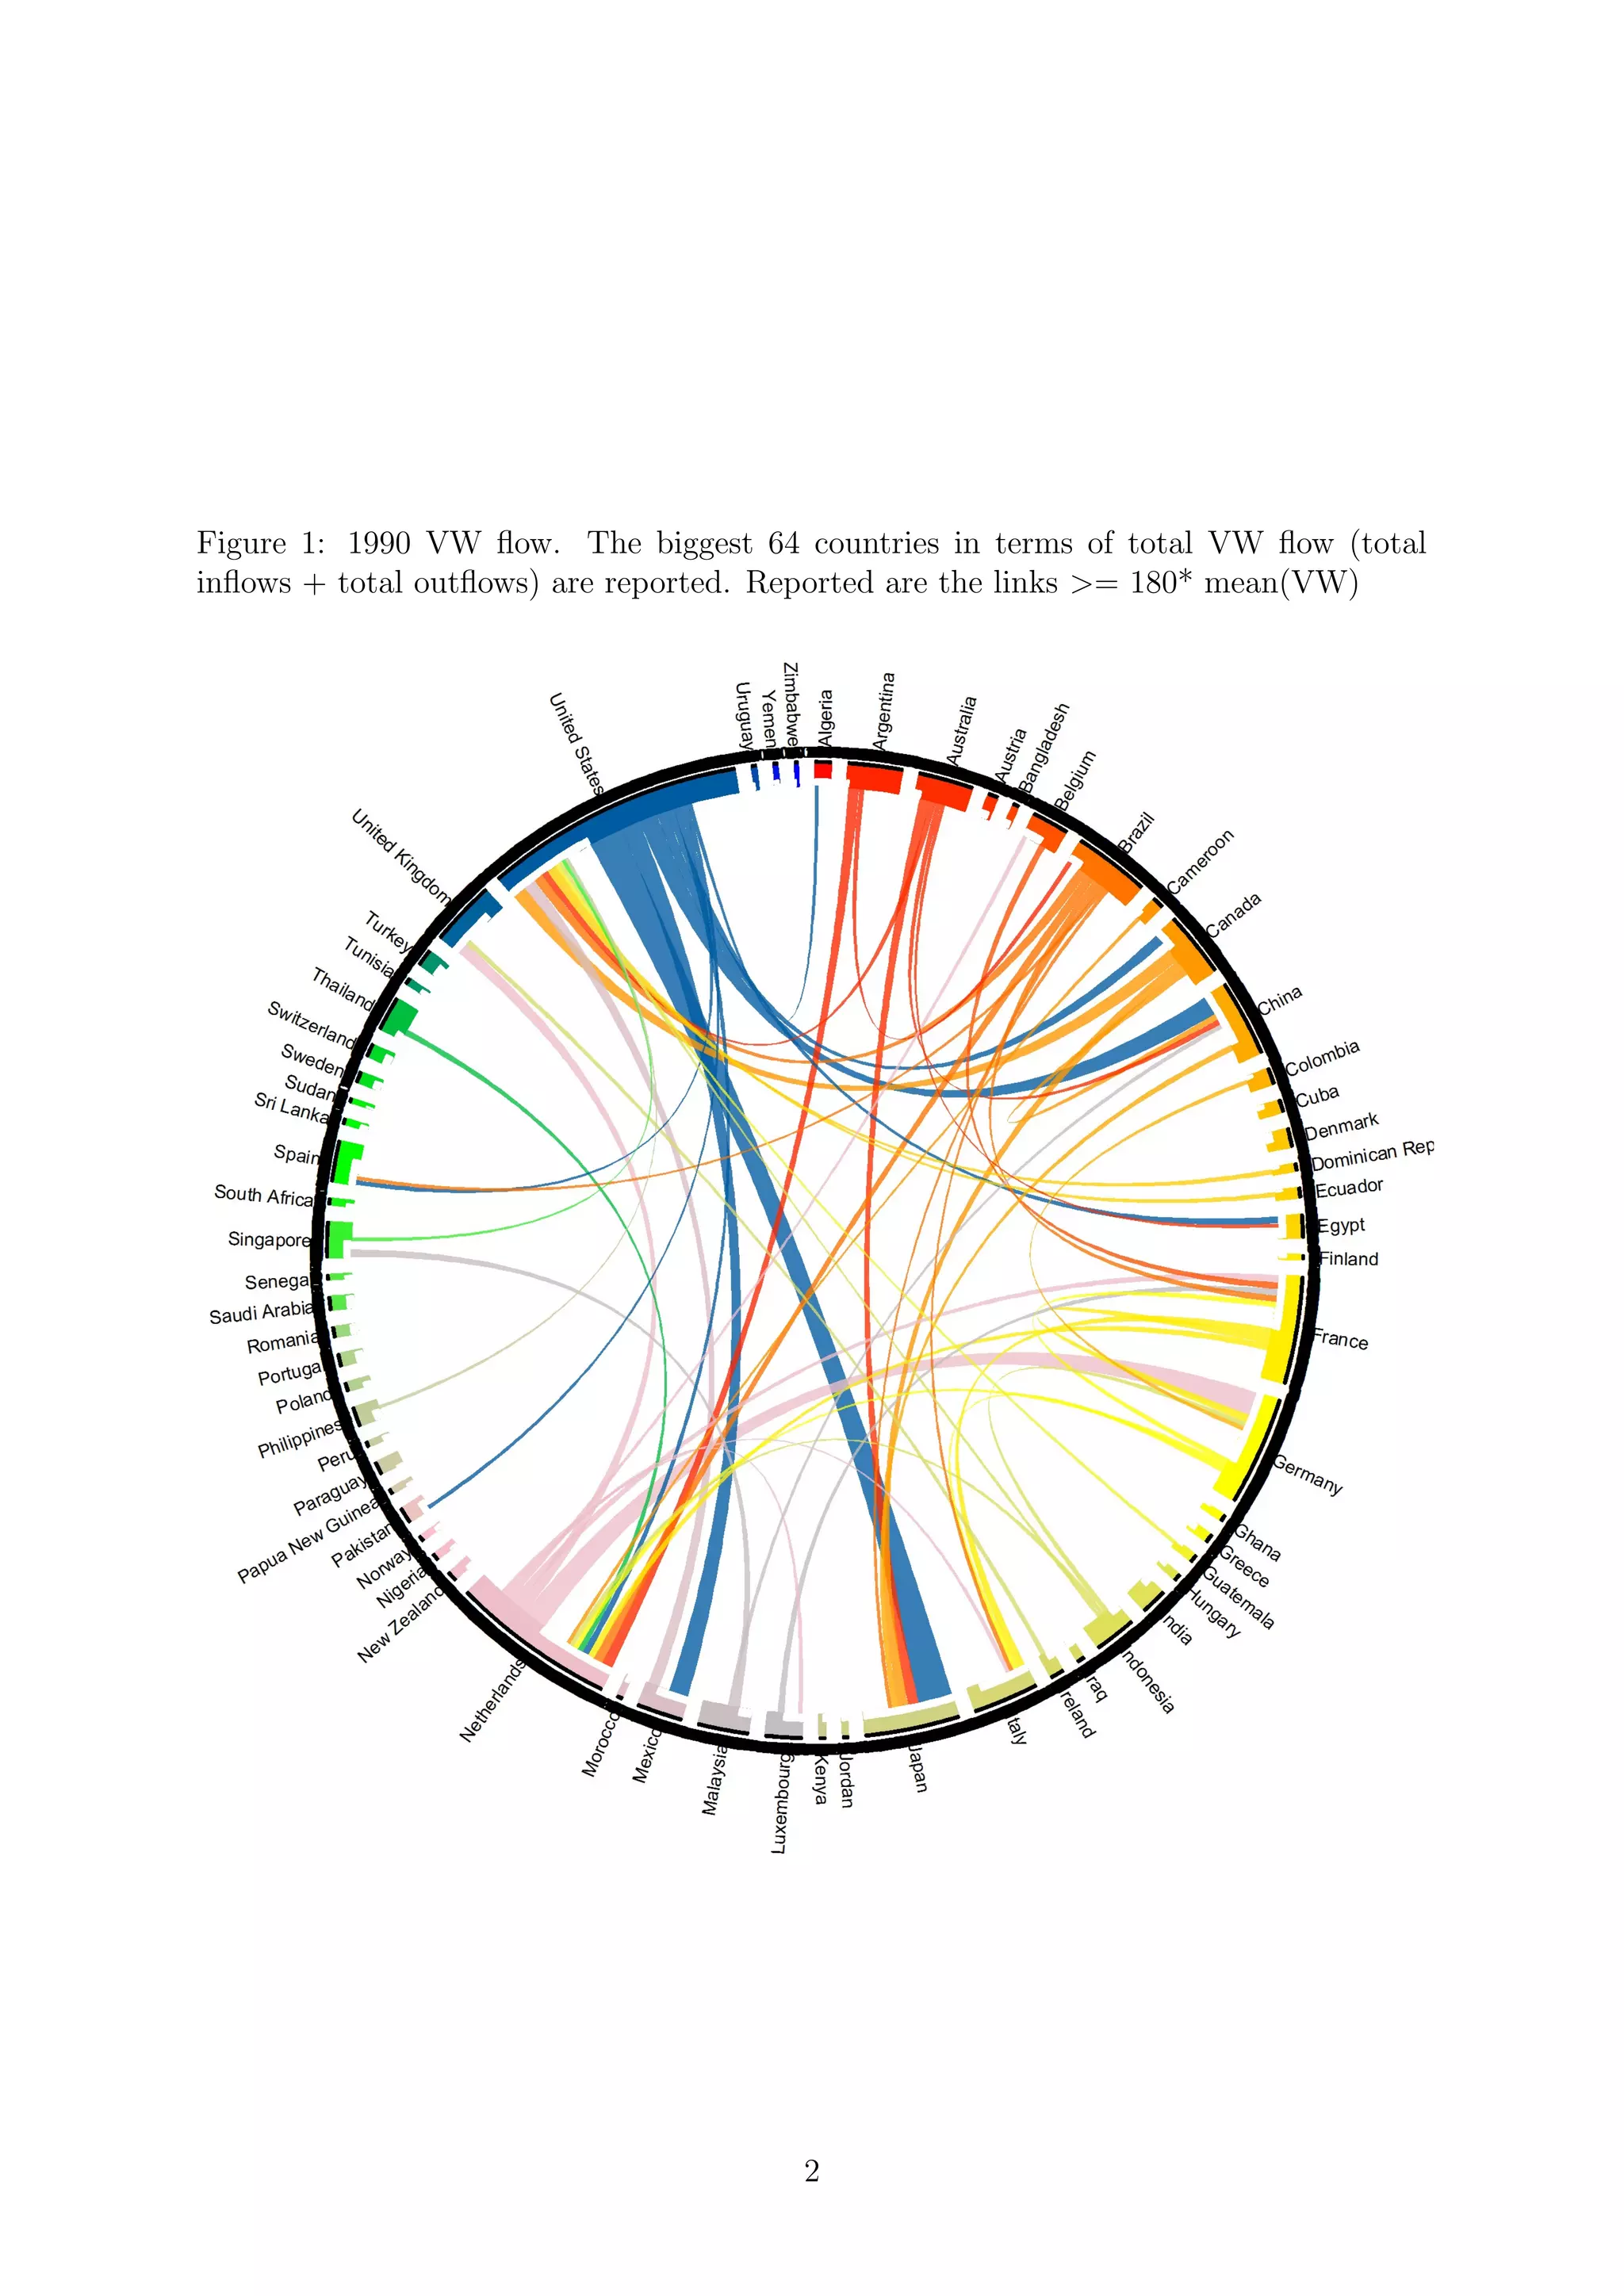
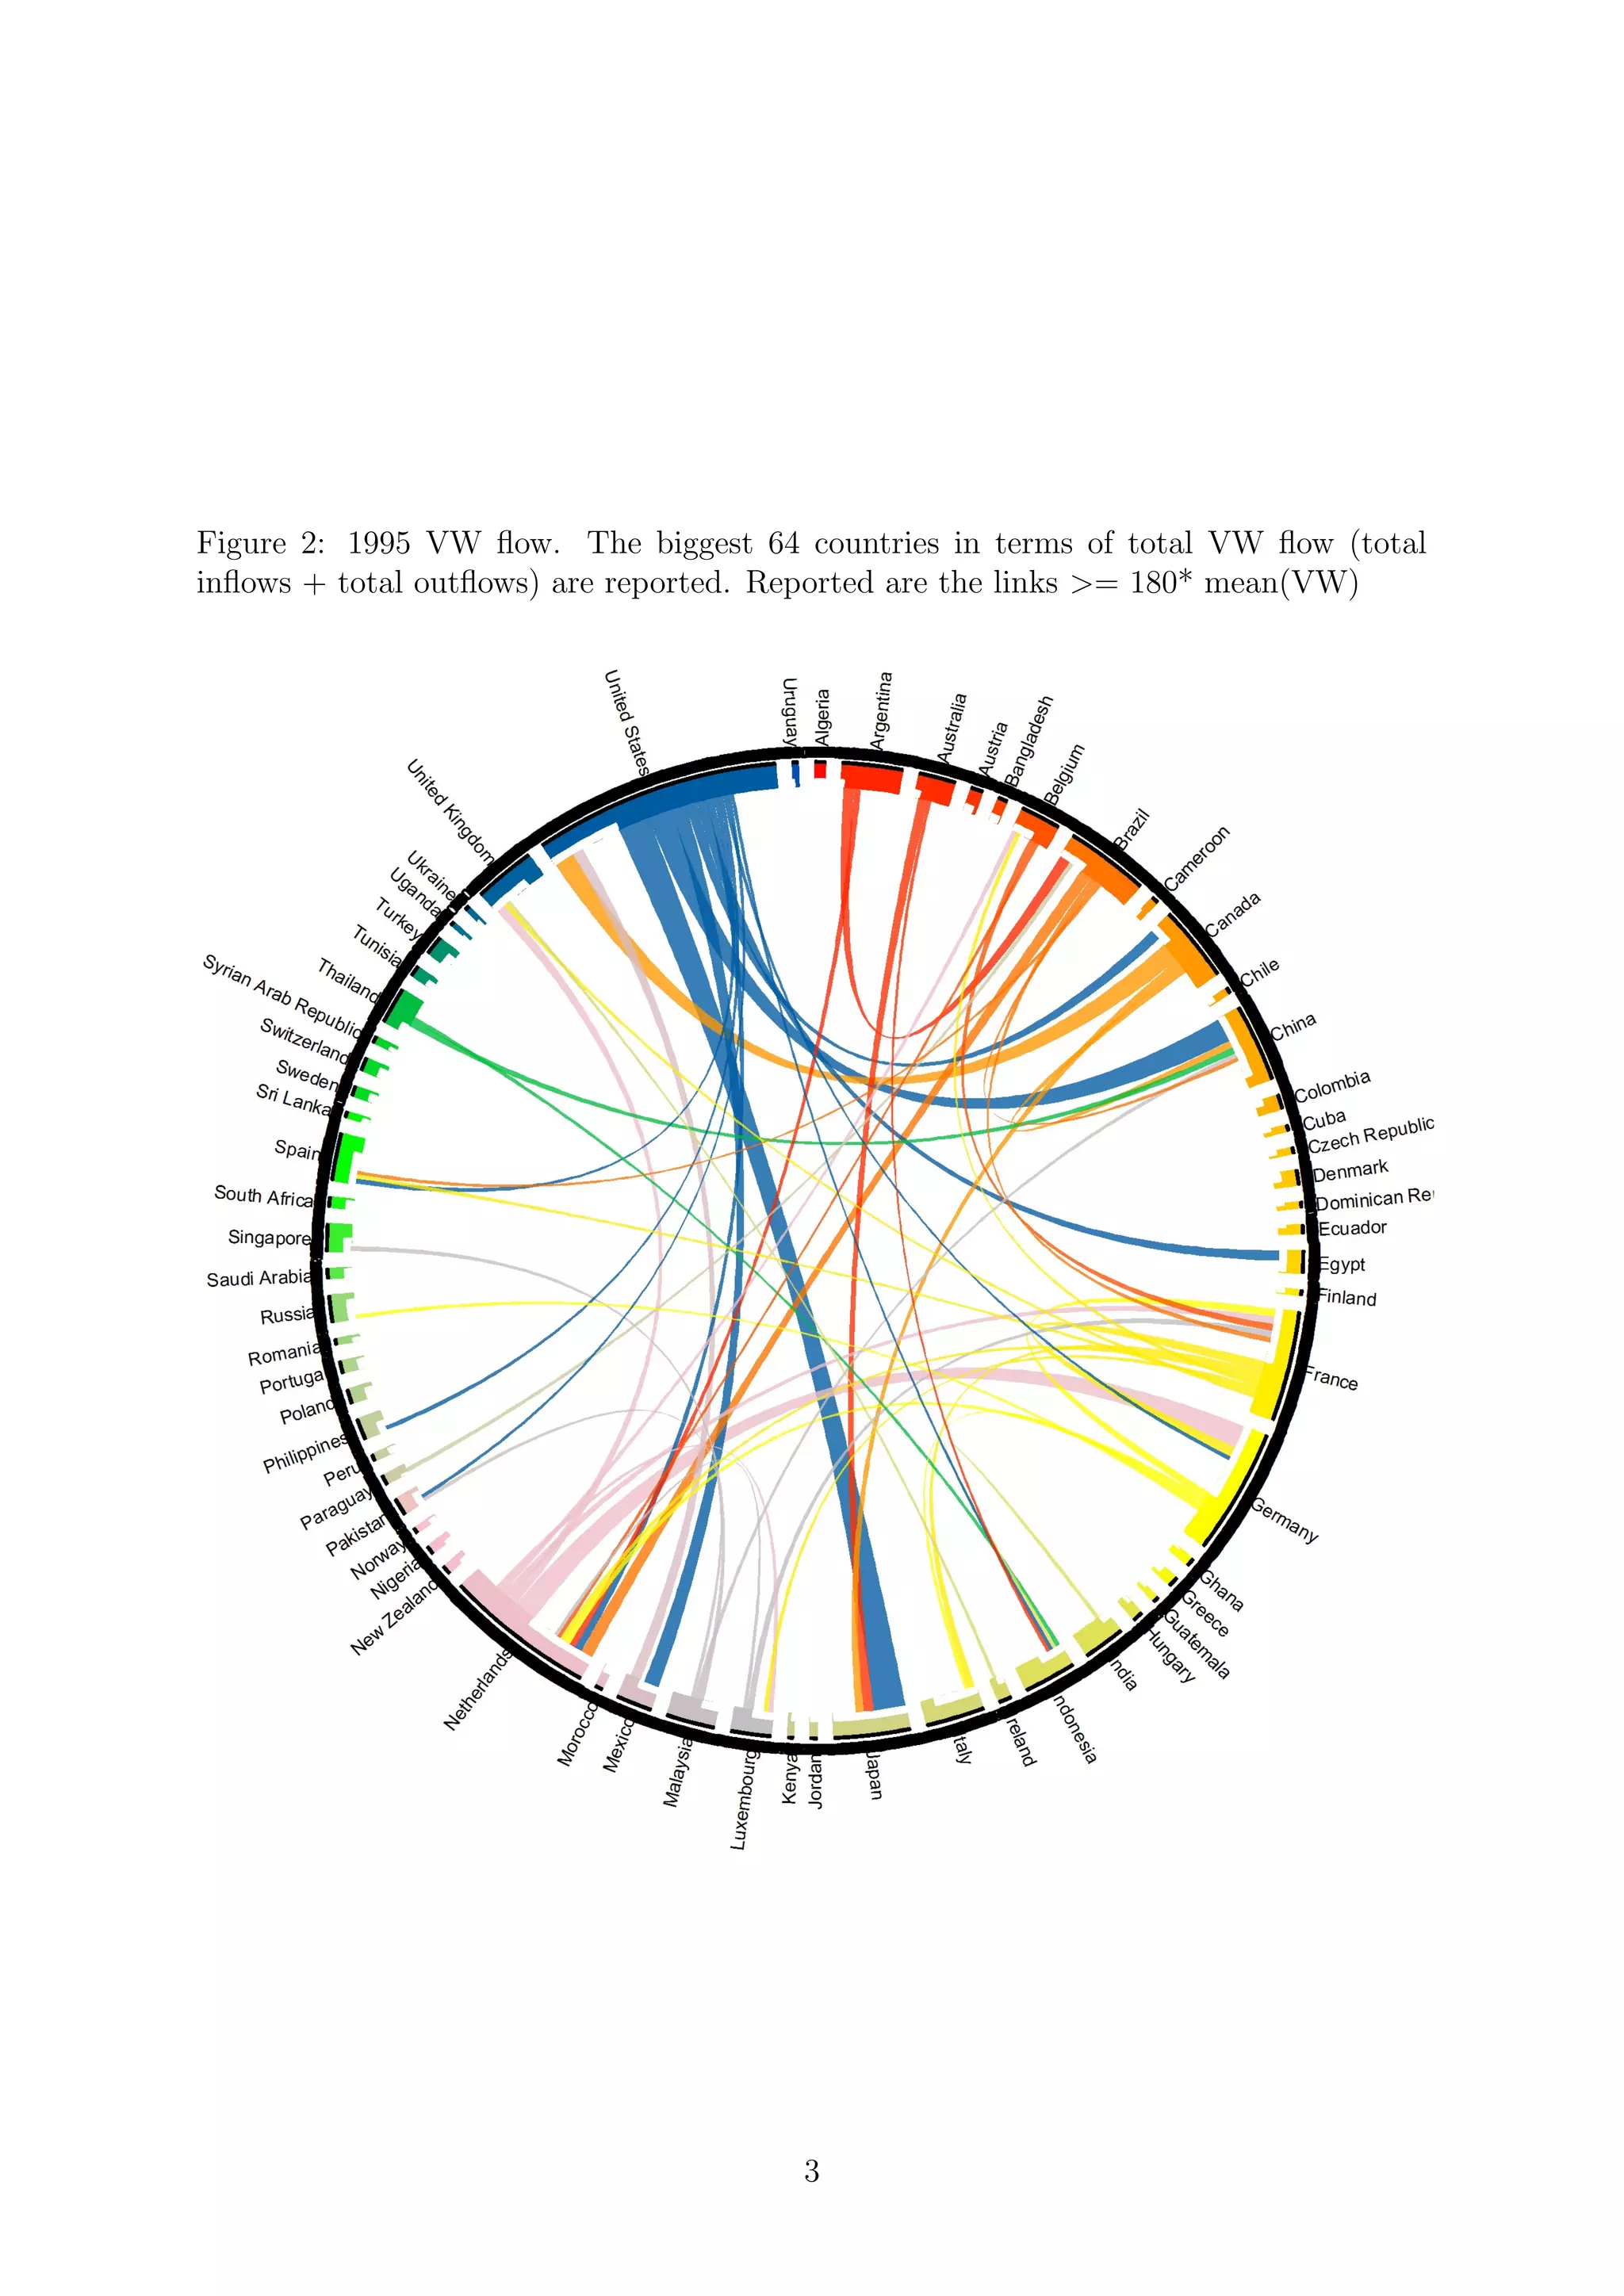
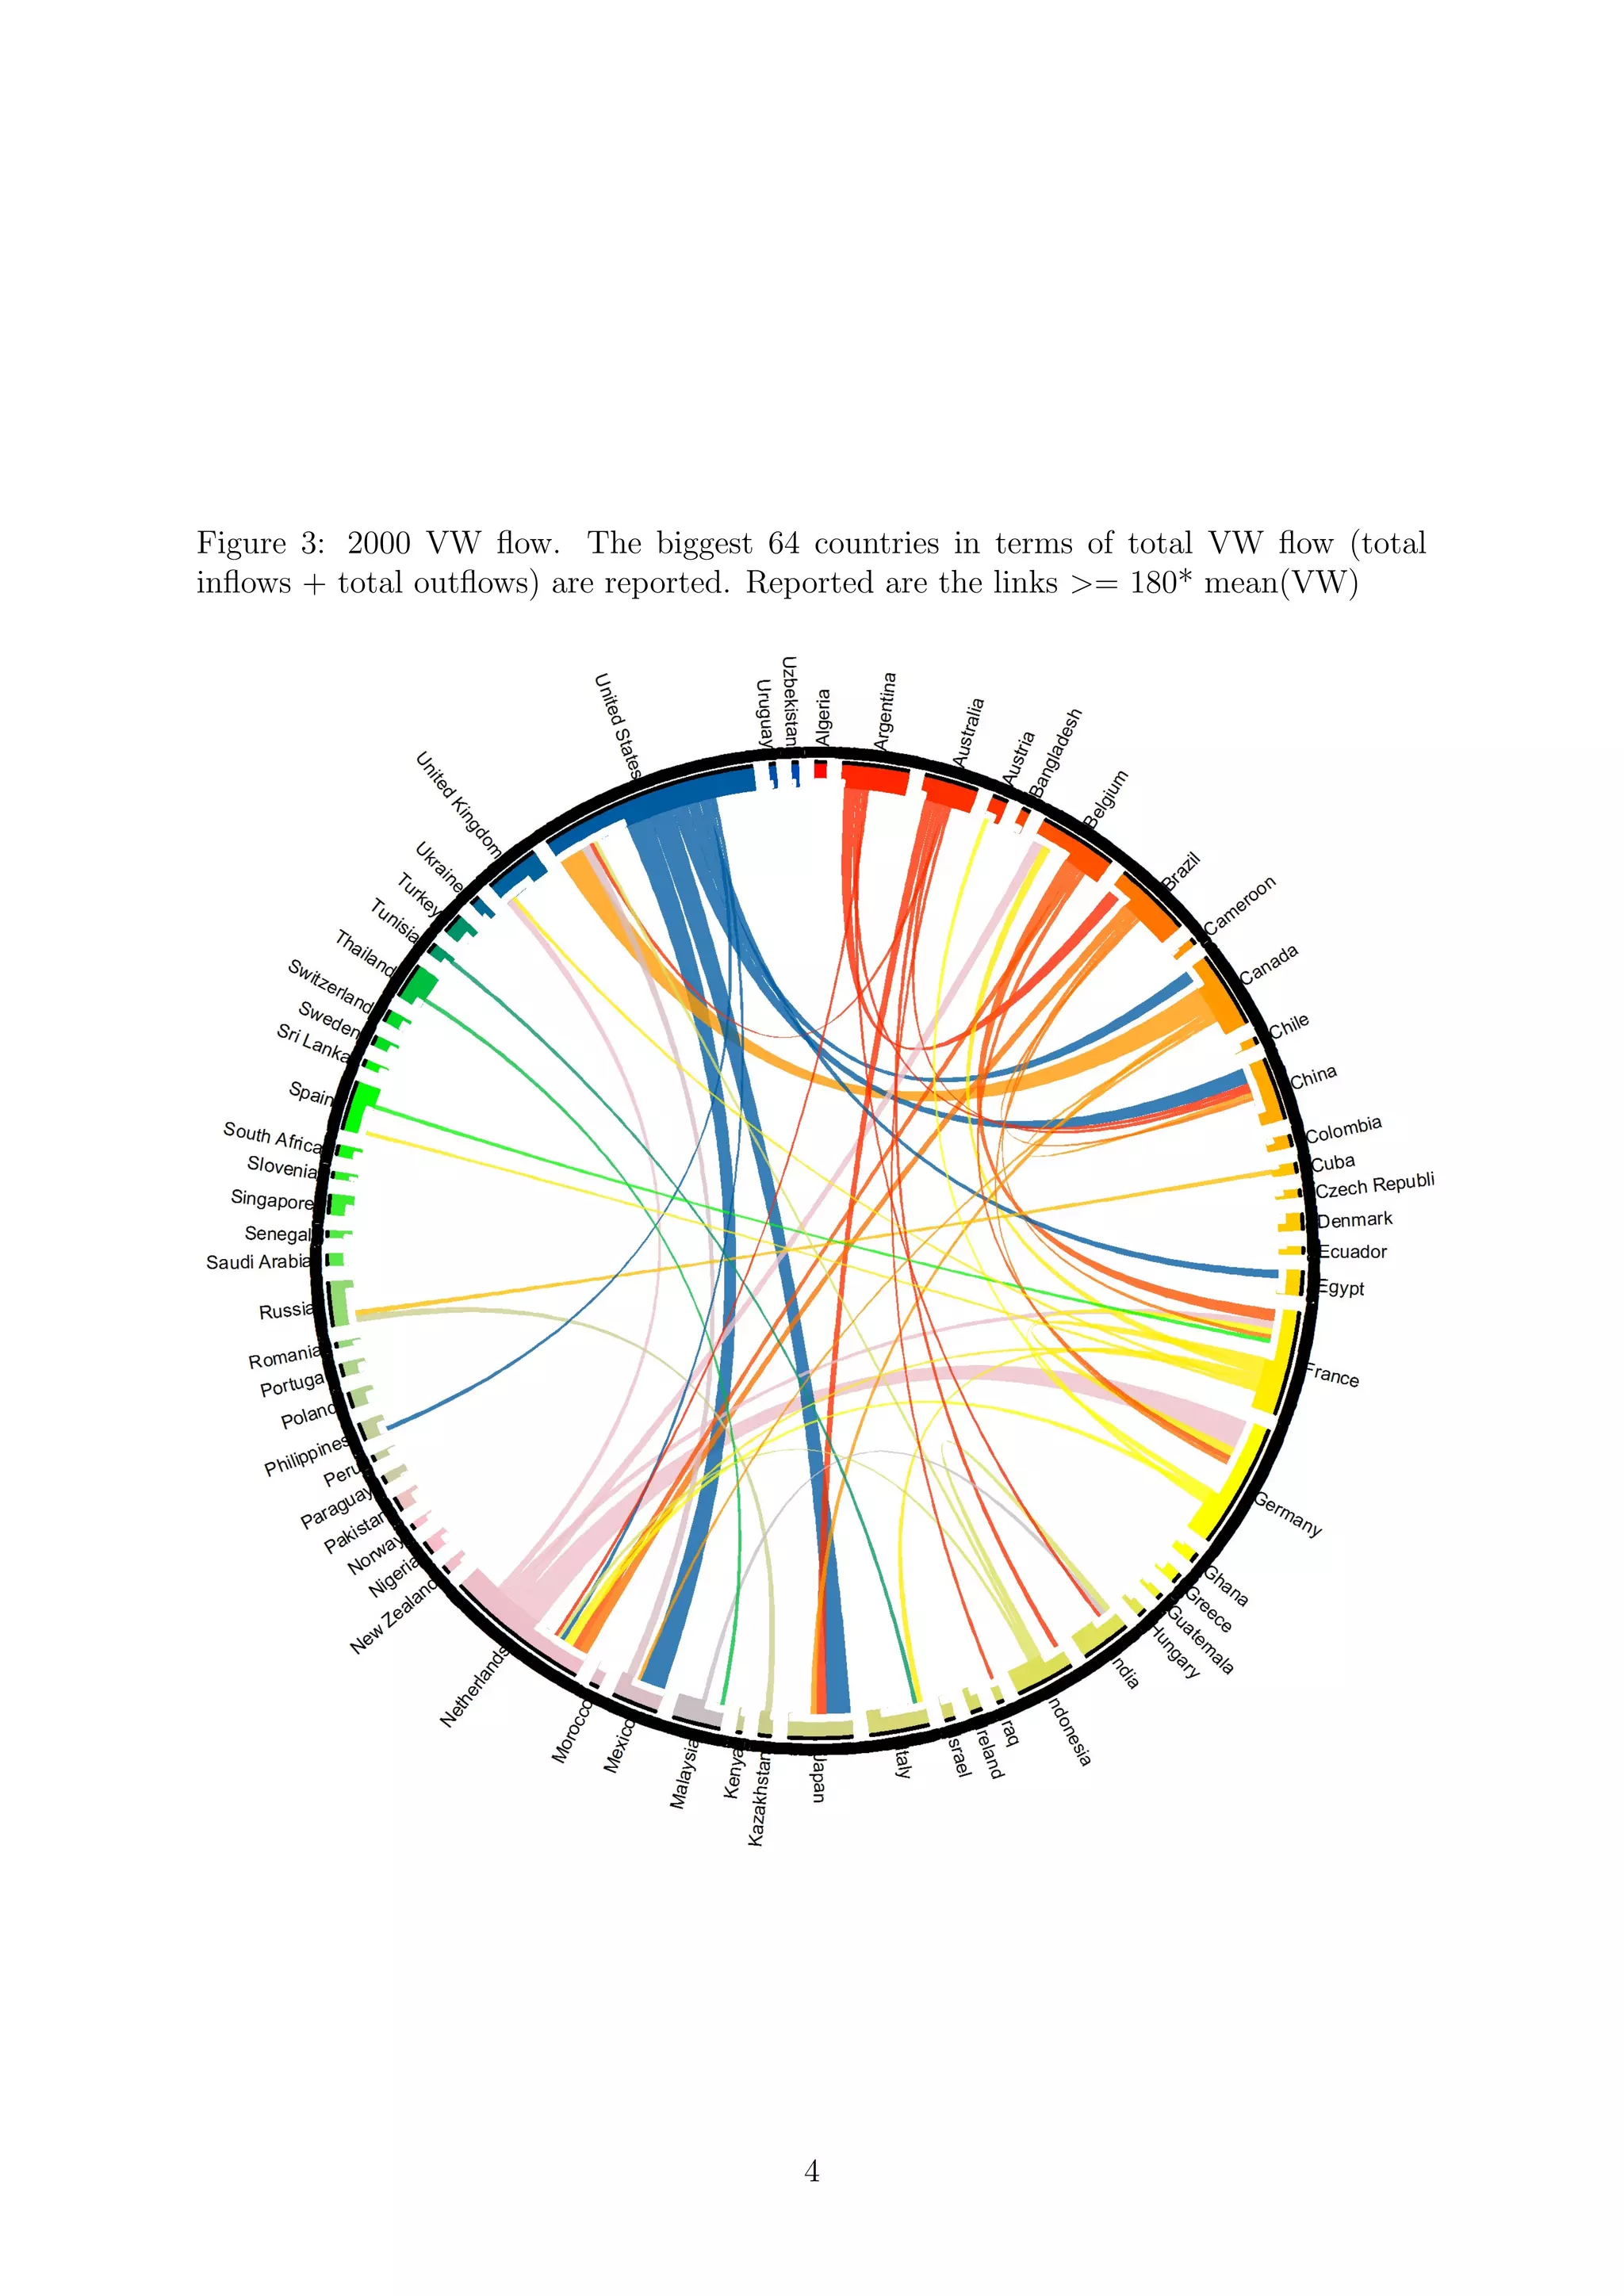
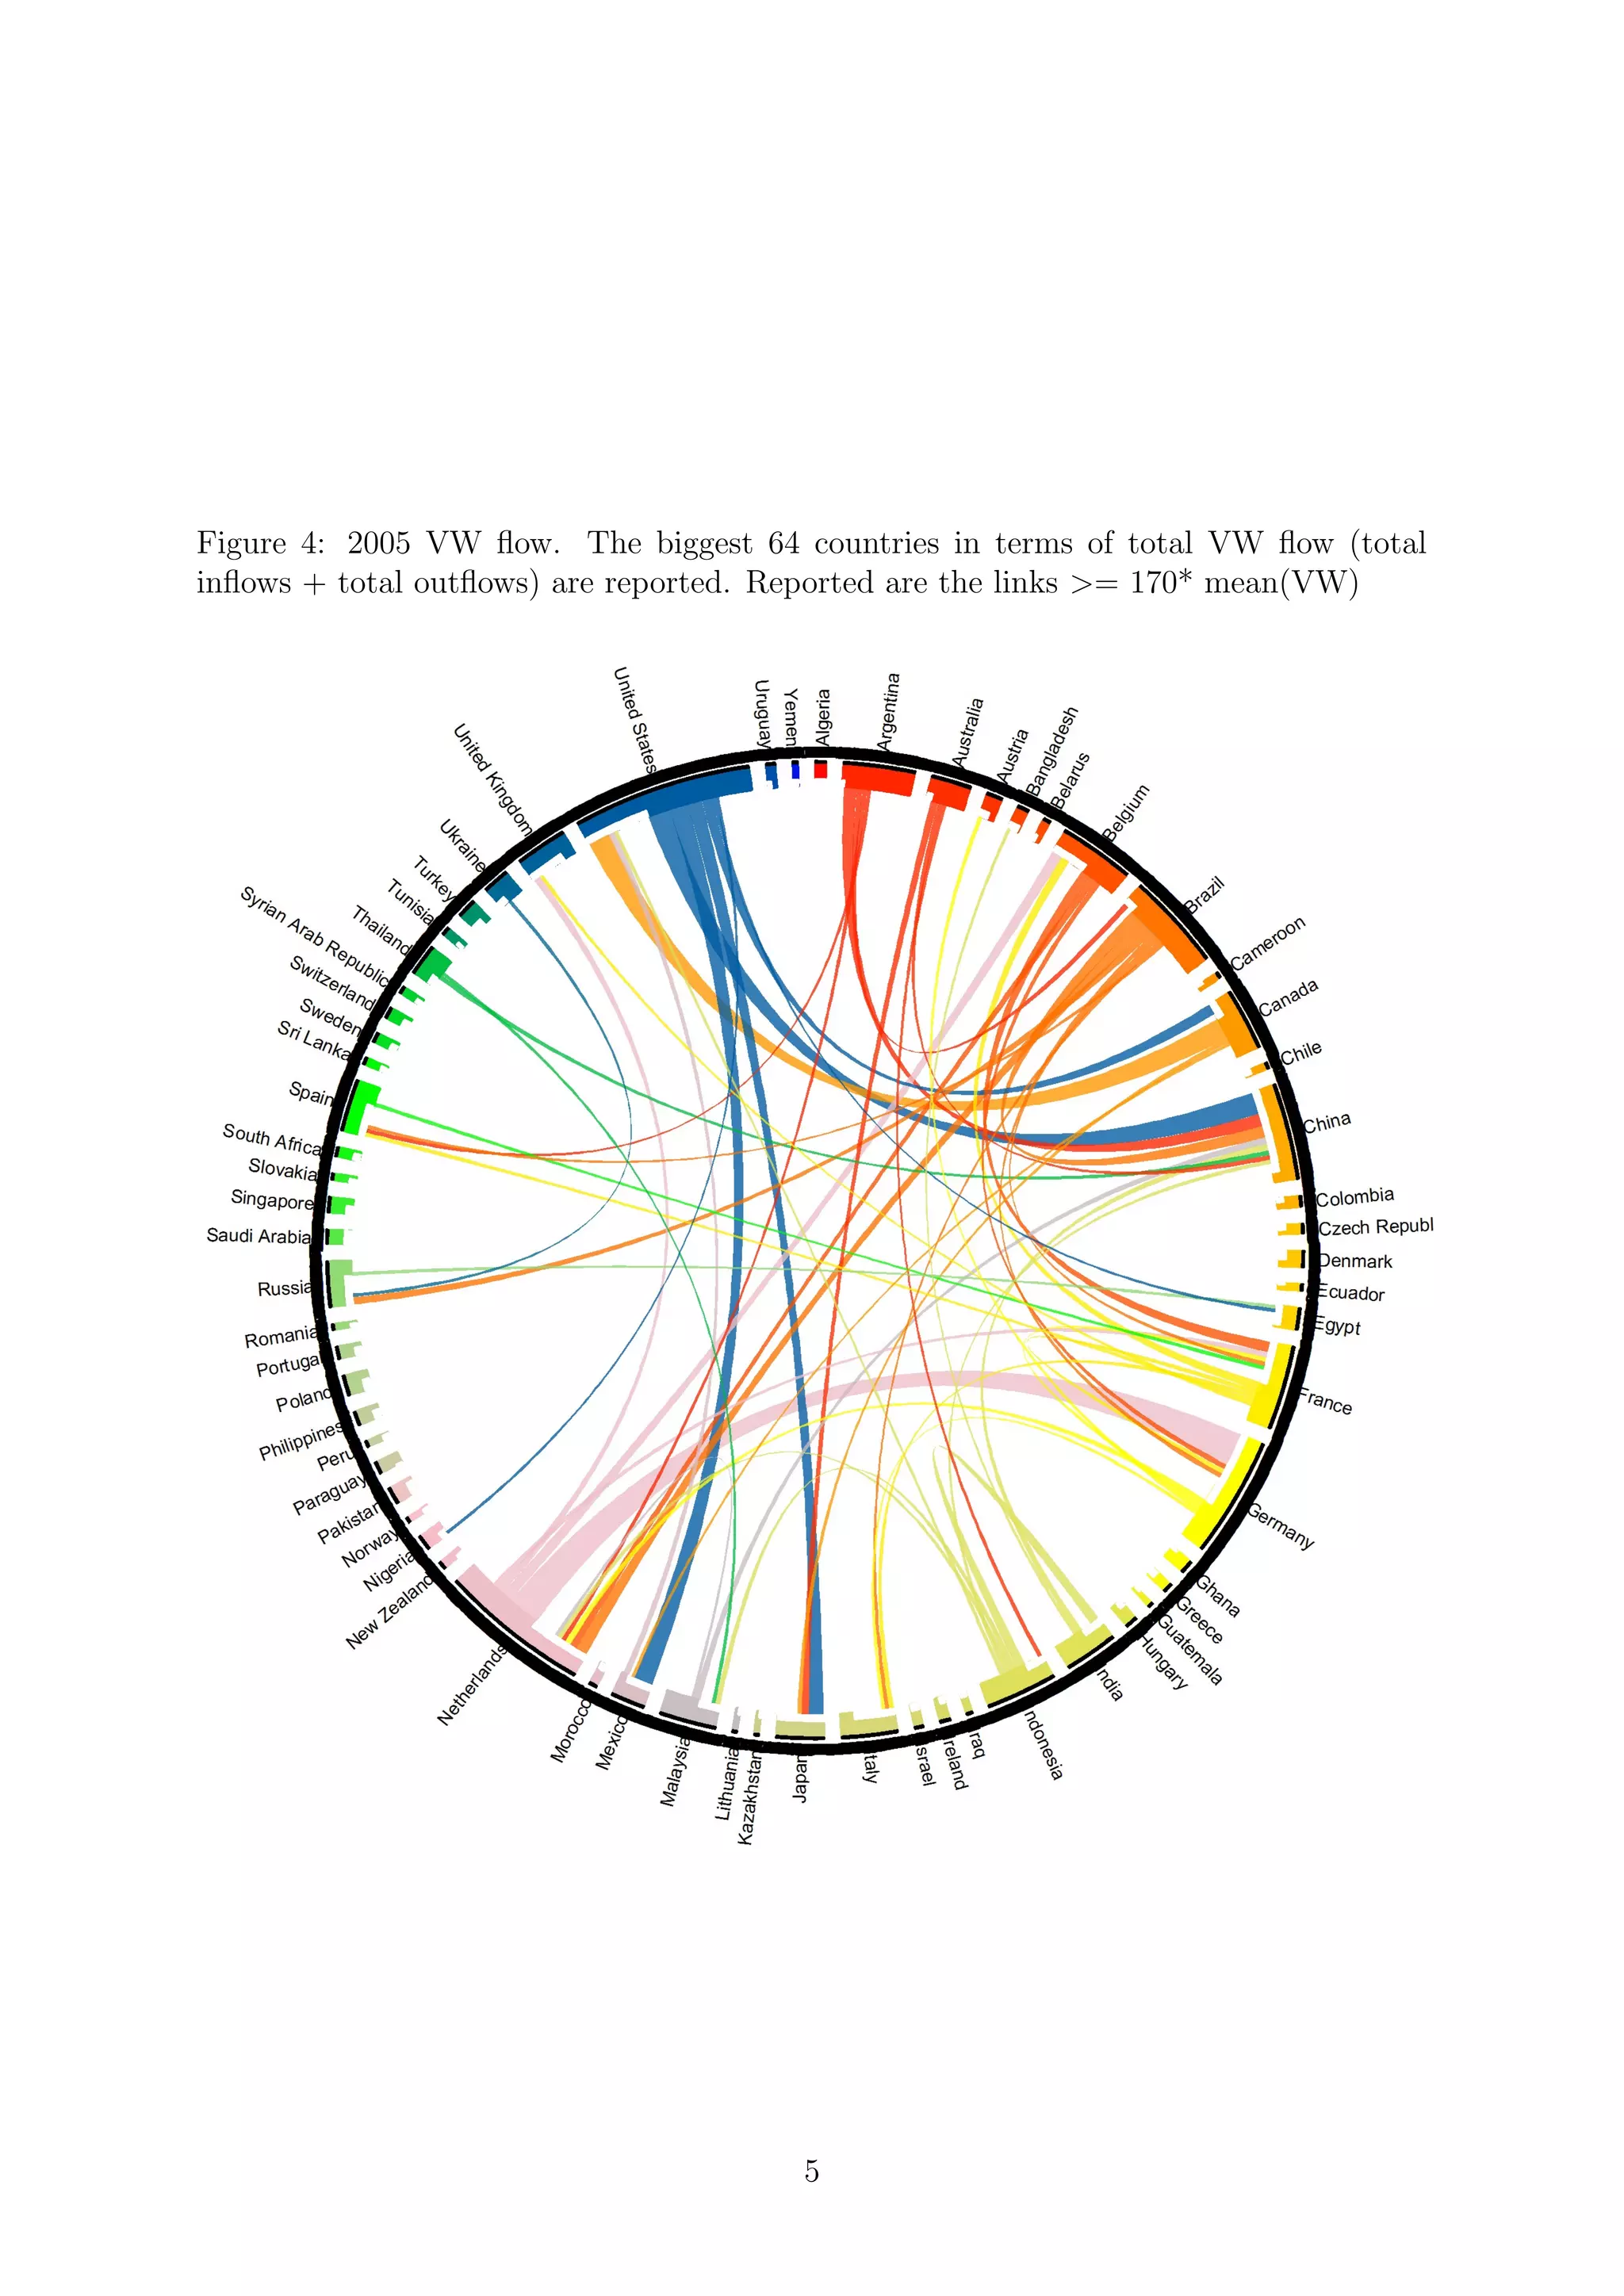
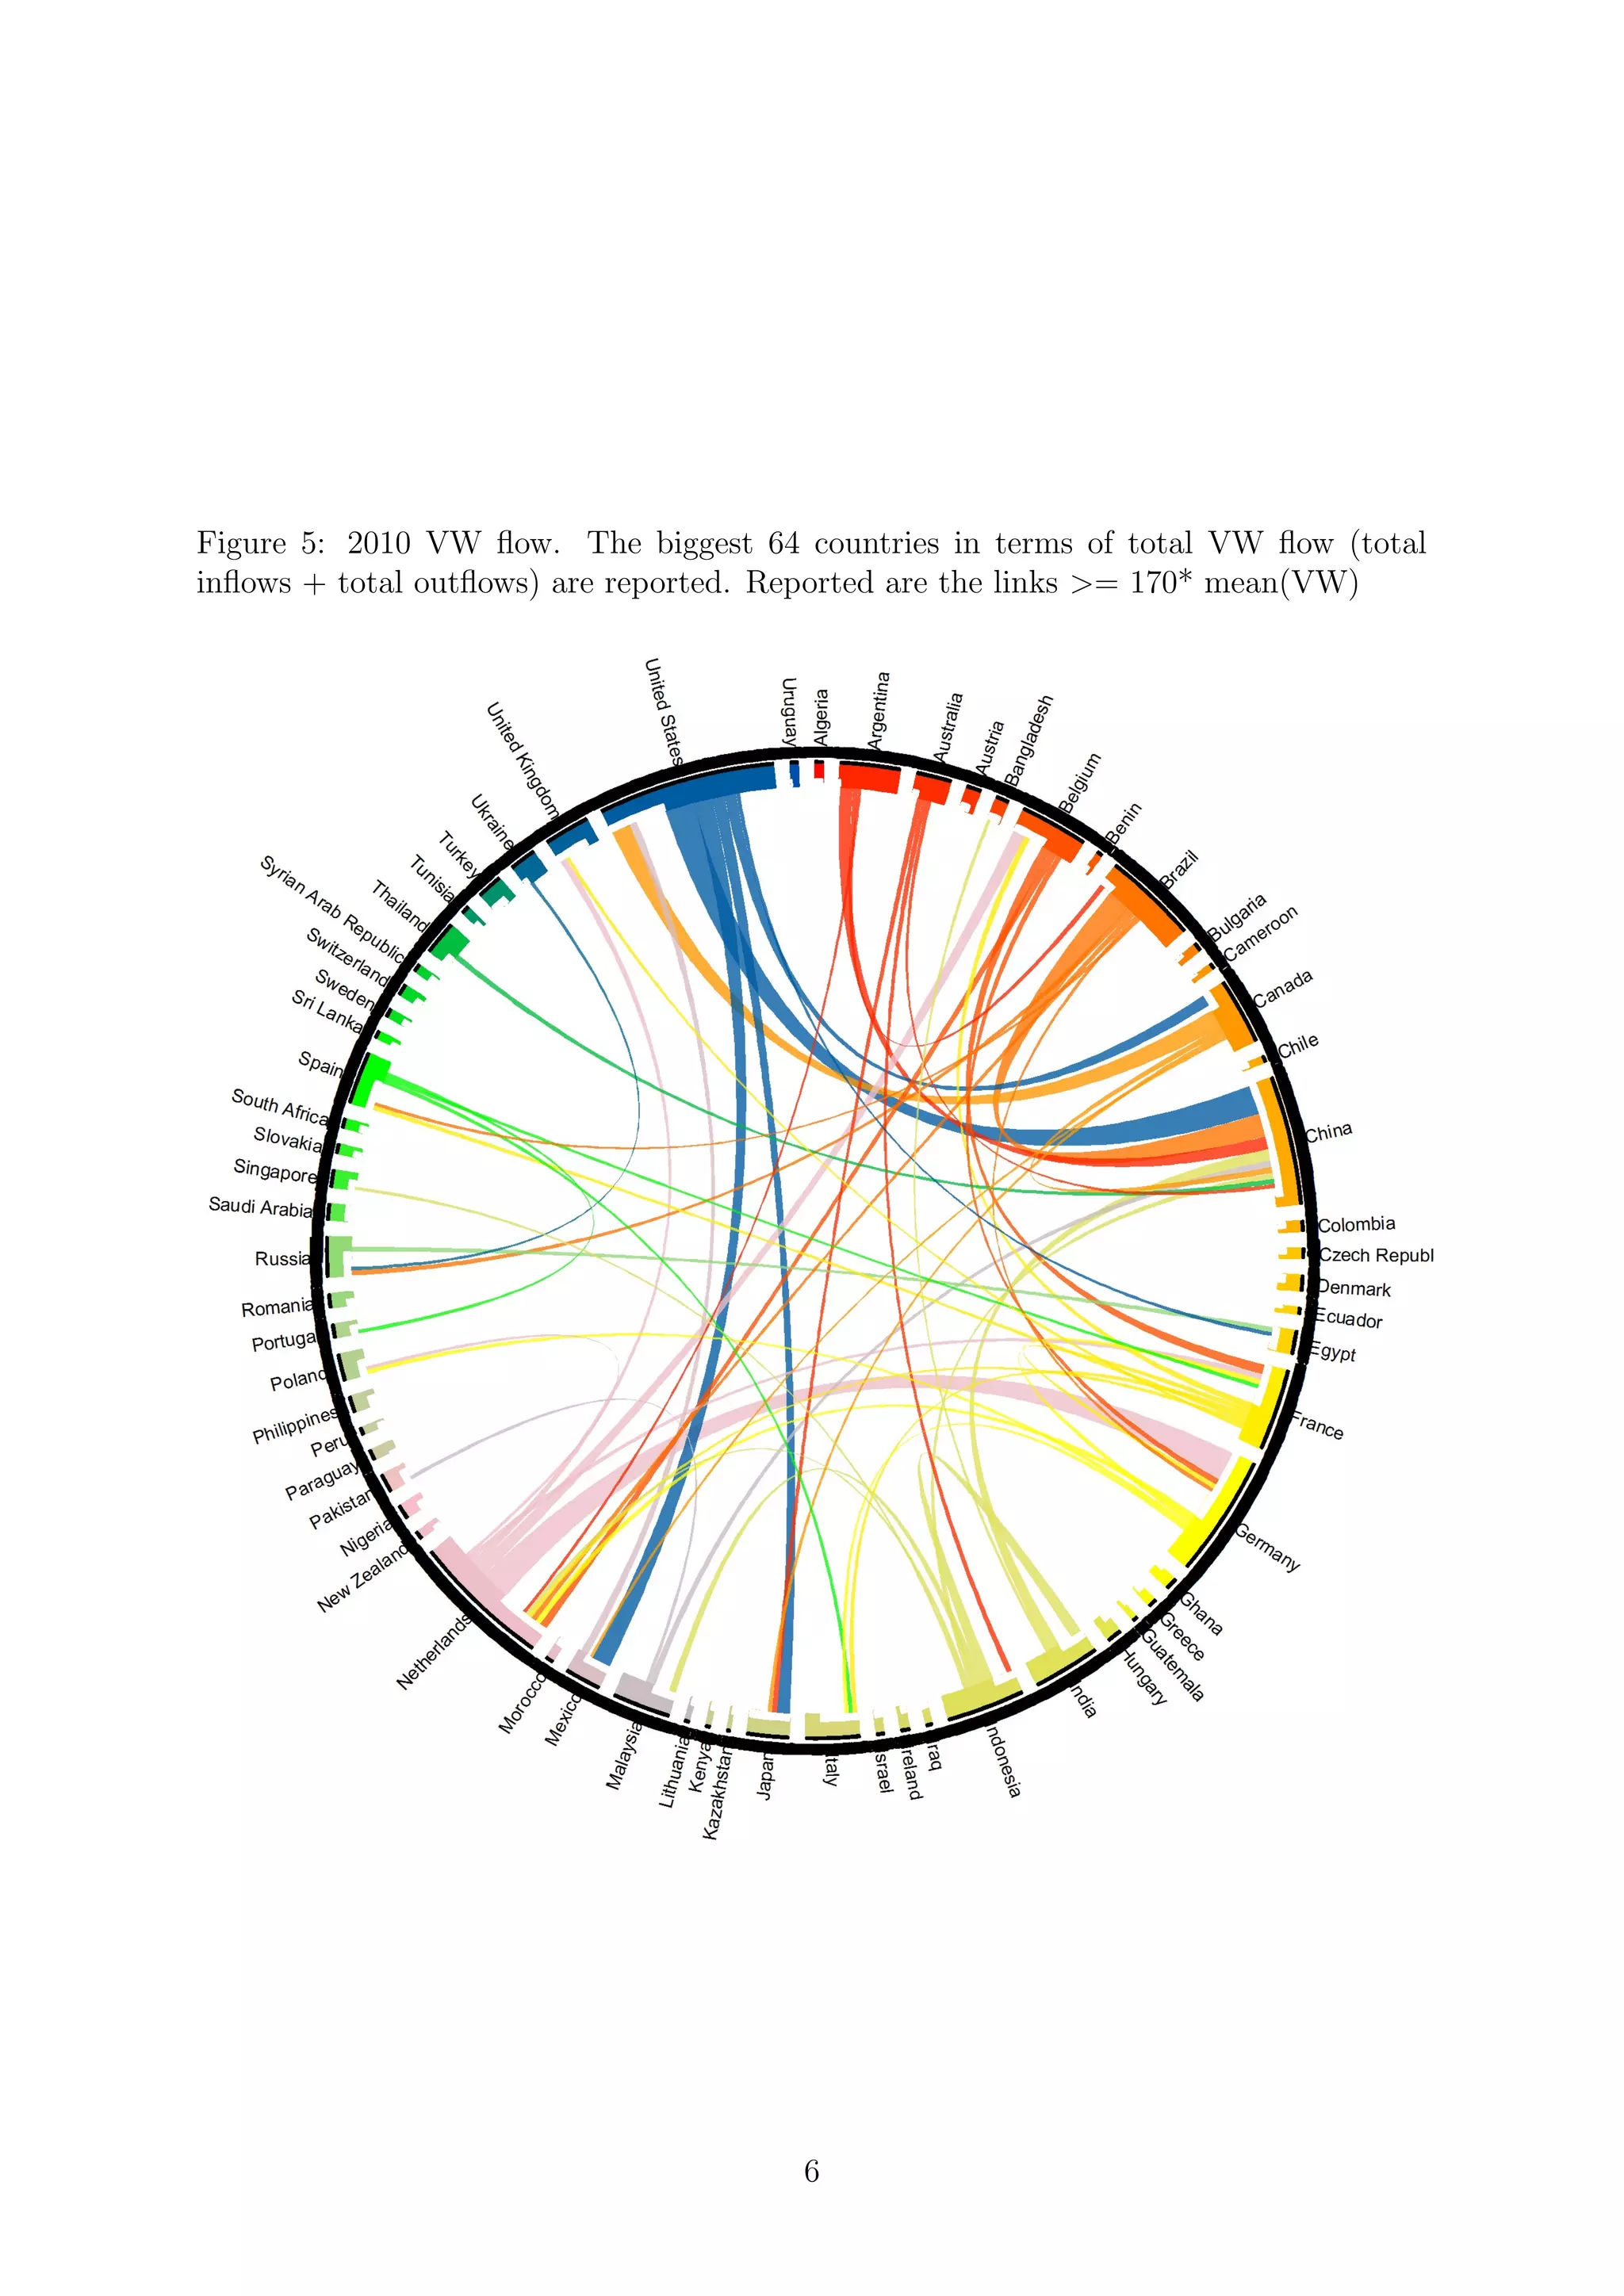

This document discusses the worldwide virtual water network using kriskograms to visualize its evolution from 1990 to 2010 through yearly flow data. It presents plots for the biggest 64 countries in terms of total virtual water flow and details acknowledgments for data preparation. The research aims to analyze the social, economic, and environmental implications of the global virtual-water network.


