Download to read offline
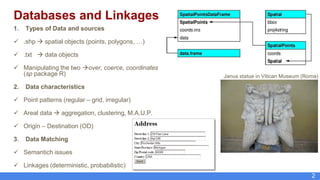
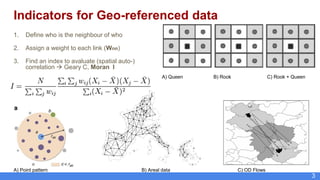
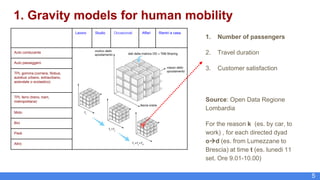
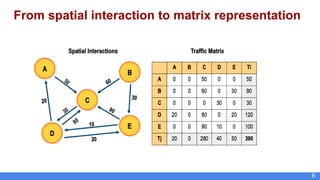
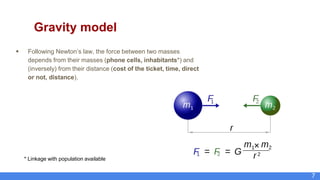
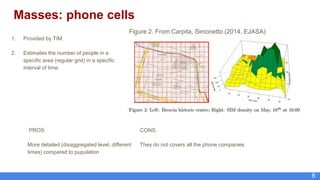
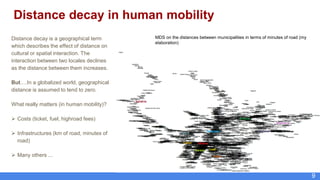


1) The document discusses using big data analytics for smart cities. It covers using different types of geospatial data from sources like shapefiles and text files. 2) Record linkage techniques are proposed to match energy efficiency data from building certifications to census data in order to increase sample size for analysis of issues like emissions and energy costs. 3) Gravity models are suggested to study human mobility using data on phone locations and travel times between places. This could provide insights on infrastructure and costs influencing human movement patterns.


