Download as PDF, PPTX


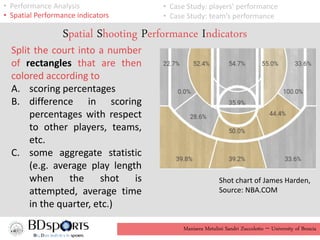


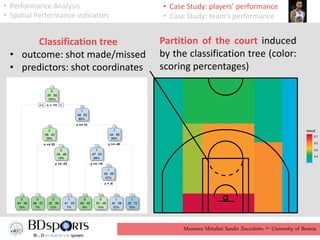
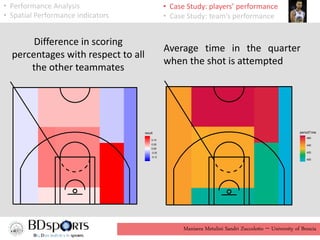

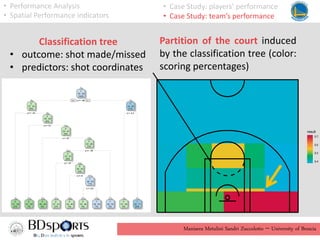
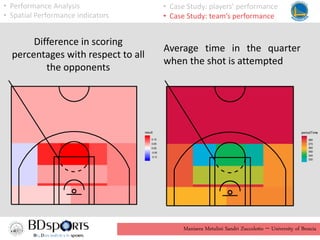

This document discusses spatial performance indicators for basketball. It presents a method to analyze shooting performance by partitioning the court into rectangles using a classification tree to maximize scoring percentage differences between areas. A case study analyzes the shooting chart of a well-known NBA player from the 2017-2018 season, showing their scoring percentages and average time shooting in different court locations. A second case study looks at the same indicators for a team's shooting performance.


