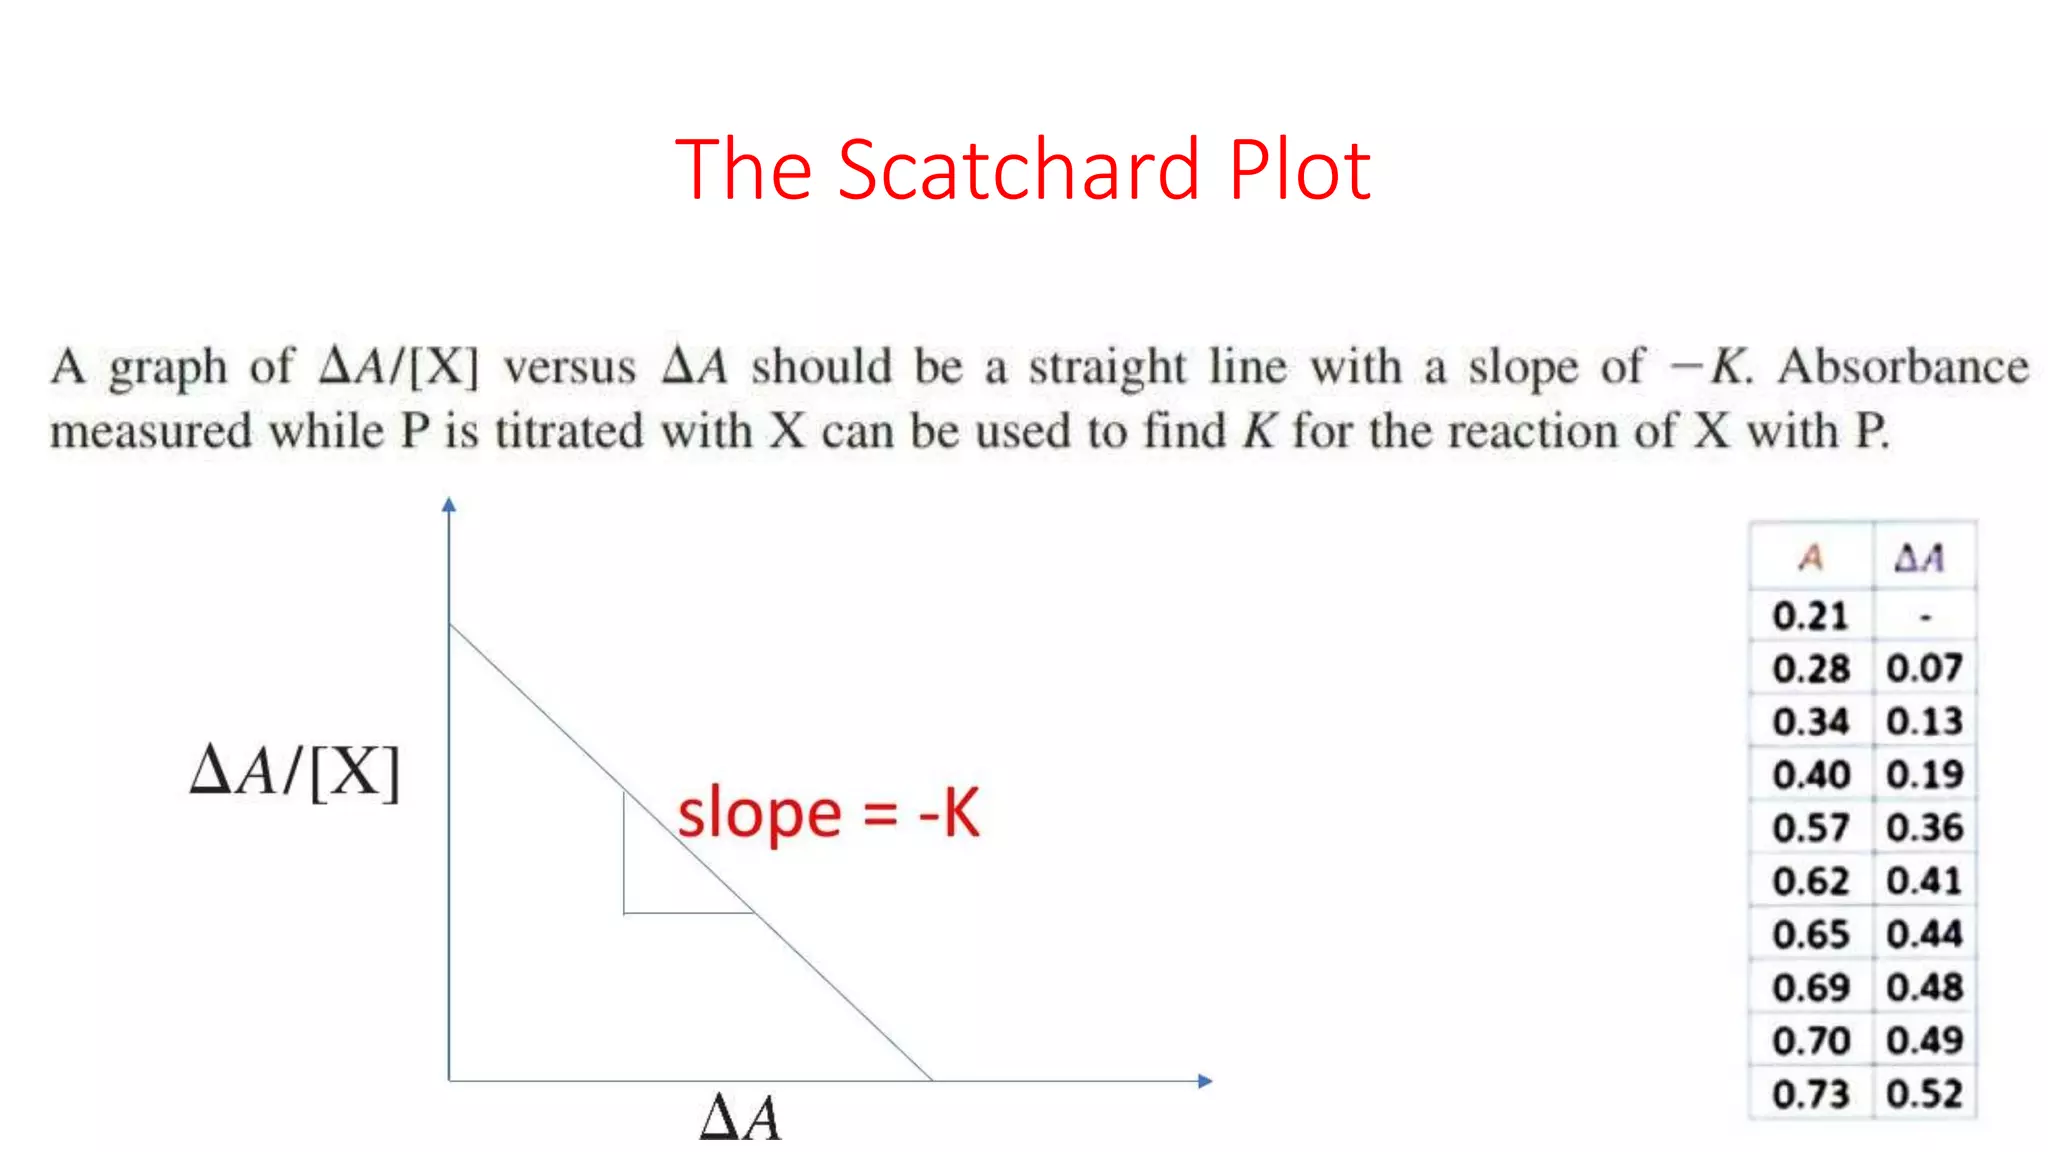
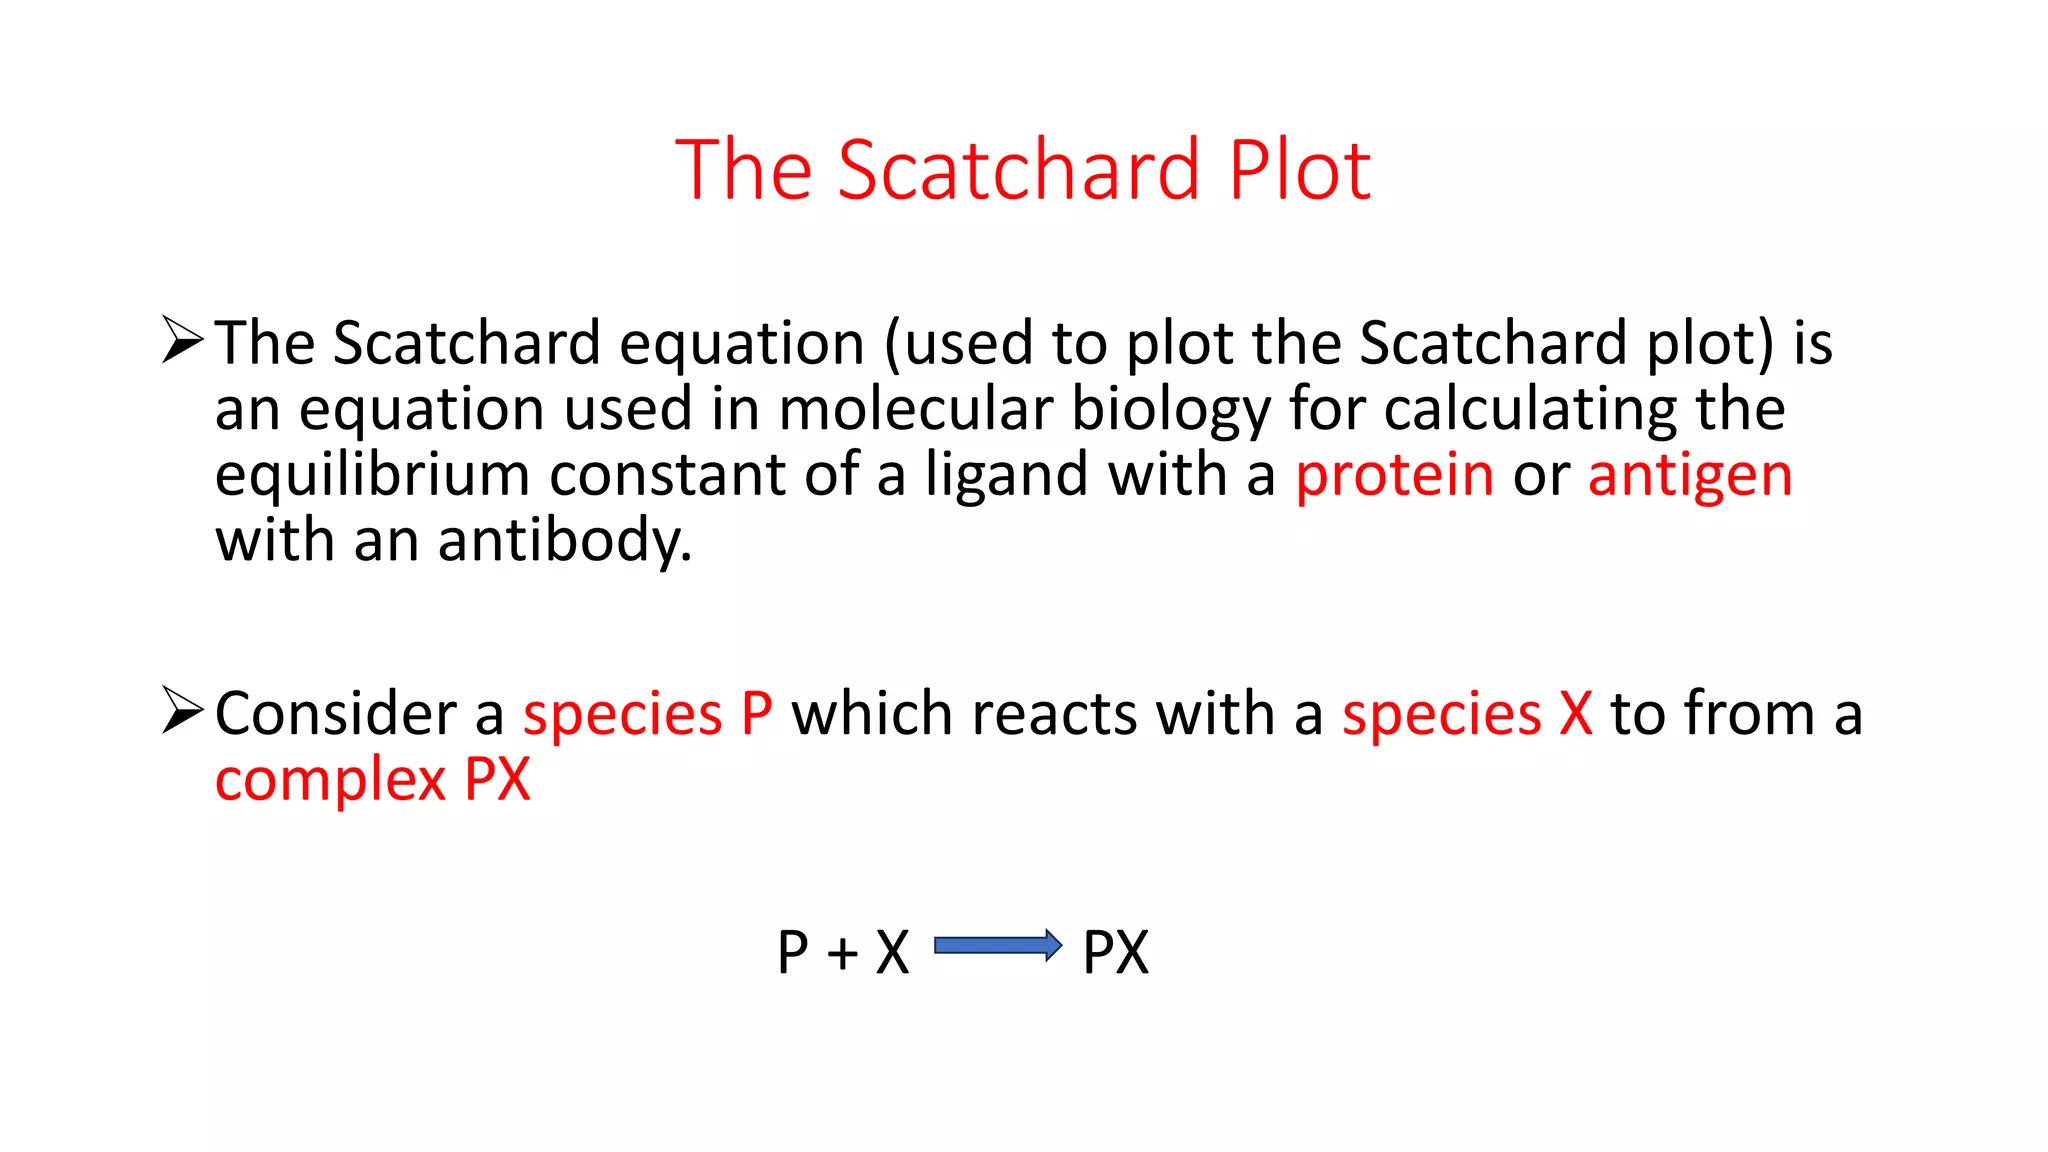
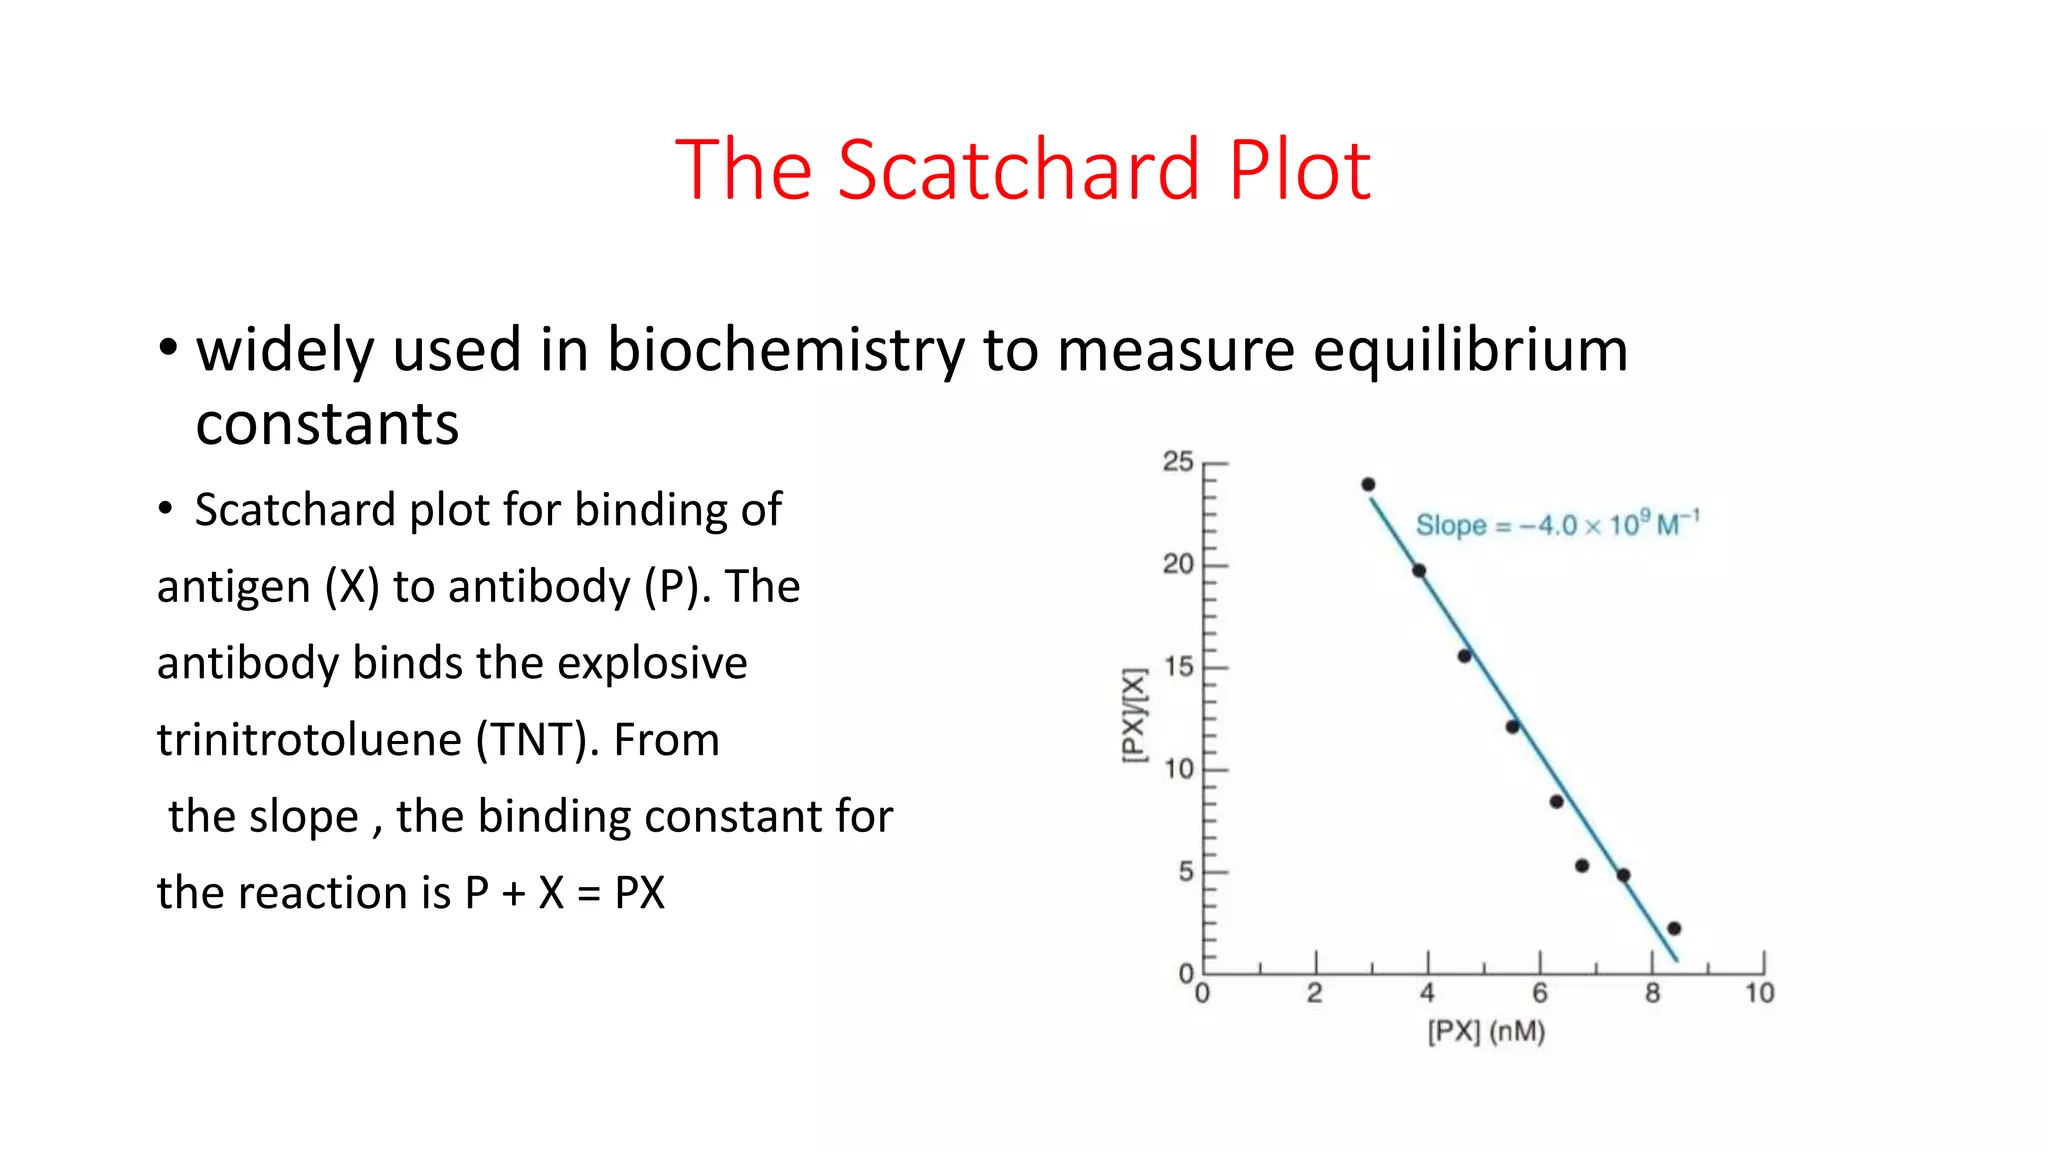
The document discusses the Scatchard plot, which is a graph used to calculate equilibrium constants for reactions between ligands and proteins or antigens and antibodies. It involves plotting the ratio of [PX] to [X] against [PX], where P is a protein, X is a ligand or antigen, and PX is the protein-ligand complex. The slope of this graph equals the negative of the equilibrium constant K. An example is given of using a Scatchard plot to determine the binding constant for an antibody-antigen reaction. Absorbance measurements can be used to calculate concentrations of P, PX, and X and construct the Scatchard plot.

![If we ignore the activity co-efficient, the equilibrium
constant for the above reaction, can be given
as,
……[1]
The Scatchard Plot](https://image.slidesharecdn.com/thescatchardplot-230829165759-61d6c6b5/75/the-scatchard-plot-pptx-3-2048.jpg)
![Consider a series of solutions in which increments of X are
added to a constant amount of P.
Letting P0 be the total concentration of P (in the form p and
PX), we can write
P0 = [P] + [PX]
The Scatchard Plot](https://image.slidesharecdn.com/thescatchardplot-230829165759-61d6c6b5/75/the-scatchard-plot-pptx-4-2048.jpg)
![[P] = P0 [PX] …..[2]
Combination of equation (1) and (2) would
……...[3]
KP0 K [PX] …..[4]
The Scatchard Plot
_](https://image.slidesharecdn.com/thescatchardplot-230829165759-61d6c6b5/75/the-scatchard-plot-pptx-5-2048.jpg)
![• The graph of [PX]/[X] versus [PX] has a slope of – K and is known
as the Scatchard plot.
[PX]/[X] slope = -K
[PX]
The Scatchard Plot](https://image.slidesharecdn.com/thescatchardplot-230829165759-61d6c6b5/75/the-scatchard-plot-pptx-6-2048.jpg)
![• For the graph, [PX] can be measured by measuring absorbance, if we
known [PX] we can find [X] with the mass Balance:
• Suppose that P and PX each have some absorbance at wavelength
but X has no absorbance at this wavelength. For simplicity, let all
measurements be made in a cell of path length 1.00 cm so that we
can omit when writing Beer’s law.
The Scatchard Plot](https://image.slidesharecdn.com/thescatchardplot-230829165759-61d6c6b5/75/the-scatchard-plot-pptx-8-2048.jpg)
![• The absorbance at some wavelength is the sum of
absorbance of PX and P:
A = APX + AP
• Substituting value of [P] we can write,
• Here, A0 is the initial absorbance before any X is added.](https://image.slidesharecdn.com/thescatchardplot-230829165759-61d6c6b5/75/the-scatchard-plot-pptx-9-2048.jpg)
![…..[5]
Substituting [PX] from Equation [5] into Equation [4] gives
Scatchard Equation](https://image.slidesharecdn.com/thescatchardplot-230829165759-61d6c6b5/75/the-scatchard-plot-pptx-10-2048.jpg)