methods of detecing analytes in clinical chemistry.pdf
•
0 likes•29 views

detecting analytes in clinical chemistry photometry potentiometry https://www.udemy.com/course/practical-clinical-chemistry-from-scratch/?referralCode=C49F992A71E8C554ADCA

Recommended
Recommended
More Related Content
Similar to methods of detecing analytes in clinical chemistry.pdf
Similar to methods of detecing analytes in clinical chemistry.pdf (20)
More from Mohamed Alashram
More from Mohamed Alashram (20)
Recently uploaded
Recently uploaded (20)
methods of detecing analytes in clinical chemistry.pdf
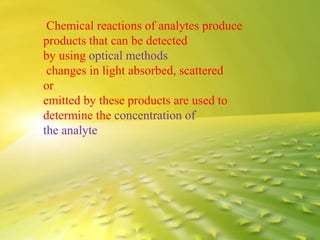
- 1. Chemical reactions of analytes produce products that can be detected by using optical methods changes in light absorbed, scattered or emitted by these products are used to determine the concentration of the analyte
- 2. In potentiometric methods changes in concentrations of ions are sensed as potential differences between two electrodes.
- 3. Calibrators, solutions of known concentration, are used to establish the relationship between the magnitude of an optical or electrical signal and the corresponding concentration of analyte
- 4. Quantitation of routine chemistry analytes is typically based on one of two measurement principles – measurement of light (photometry or spectrophotometry) or measurement of electrochemical potential (potentiometry).
- 5. There are many variations of photometry and potentiometry but all have in common that the signal the amount of light Or electrical voltage is predictably related to the amount of analyte in solution.
- 6. PHOTOMETRY Photometry relies on measurement of light by a photodetector. The light may be absorbed by a substance dissolved in solution (absorbance), the light may be scattered or refracted by particles suspended in solution turbidimetry or nephelometry.
- 7. the light may be emitted from a substance that absorbs light at one wavelength and emits light at another wavelength (fluorescence)
- 8. Specific wavelengths of light are chosen for each analysis based on the properties of the substance being measured Atypical light source (lamp) generates a broad range of wavelengths of light
- 9. A visible lamp produces light of wavelengths from 400 nm (violet light) to 700 nm (red light). An ultraviolet lamp produces light of wavelengths from about 200 to 400 nm.
- 10. To select the desired wavelength from the spectrum of light produced by the light source a device called a monochromator or filters are used.
- 11. A monochromator disperses the light (much like a prism disperses light) and allows selection of a narrow band of wavelengths to be directed through the sample cuvette.
- 12. Cuvette: Cell made of optically transparent material that contains solutions for analysis by optical methods
- 14. ABSORBANCE When an analyte has an intrinsic color (or generates a color upon chemical reaction) visible light is absorbed when it passes through a solution containing the analyte (or reaction products)
- 15. The selective absorbance of certain wavelengths of light from the spectrum of white light gives the solution its color. For example, a solution containing hemoglobin appears red because light in the green range of the spectrum (wavelengths of 500-600 nm) is selectively absorbed (removed from the white spectrum).
- 16. Measuring the decrease in green light that occurs upon passing through the solution, gives an indication of the amount of hemoglobin present
- 17. shows the configuration used to measure light absorbed – the difference between the emitted light from the source (lo) and the light that reaches the photodetector (ls).
- 19. Compounds that have no visible color often absorb light in the ultraviolet region and this absorbance can be used in the same way as absorbance of visible light. The specific wavelength of light chosen is based on the absorption properties of the compound being measured.
- 20. As the amount of a substance in solution increases, the relative amount of light that passes through solution and reaches the detector decreases. The decrease in light is termed absorbance.
- 21. A formula called Beer’s Law describes the relationship between concentration and absorbed light. For a given method, A = elc where • e is the extinction coefficient • l is the length of cuvette • c is concentration. Beer’s Law A = elc ; e = extinction coefficient; l = length of cuvette; c = concentration
- 23. TURBIDIMETRY AND NEPHELOMETRY Some tests are based on formation of insoluble particles that interfere with the passage of light through the solution The analyte reacts with an added reagent to produce insoluble particles that remain suspended in the solution
- 24. When light hits these particles some of it is reflected in different directions. A higher concentration of analyte presents a greater number of particles that will inhibit light passing through the solution and increase the amount of light reflected.
- 25. It is possible to measure the loss of light passing straight through the solution (called turbidimetry) Or the increase of light reflected in a different direction (called nephelometry).
- 26. In turbidimetry the detector is placed in a direct line with the incident light and the light sensed by the detector decreases as the number of analyte particles increases
- 27. In nephelometry the detector is placed at an angle to the light path to avoid detection of light passing through the sample.
- 28. The nephelometric detector senses light scattered by the particles; the amount of light reaching the detector increases as the number of analyte particles increases.
- 29. Often, antibodies are used with these methods and represent a type of immunometric assay specifically, immunoturbidimetry and immunonephelometry.
- 30. The antibodies in the reagents will cause analyte molecules to form complexes or lattices and these large particle aggregates enhance the reflection of light, increasing the analytical signal that is measured.
- 32. turbidimetric /nephelometric methods are often chosen to measure proteins such as transferrin or prealbumin – two important transport proteins in the blood. Proteins are relatively large molecules that can be easily cross-linked by selective antibodies to produce aggregate particles that are the right size to reflect
- 33. light in the visible or ultraviolet range. Some drugs of abuse tests can quantitate the concentration of drug in the patient’s sample by measuring the changes in turbidity due to the competition between drug in the patient’s sample and drug bound to microparticles with antibodies added to the solution
- 34. FLUORESCENCE Certain kinds of chemical structures are able to absorb light of one wavelength and emit light of another wavelength.
- 35. These substances are termed fluorescent compounds or fluorophores. In each case the incident light is of shorter wavelength and higher energy than the emitted light. So a substance that absorbs blue light (wavelength 400) may emit lower energy green light (wavelength 500).
- 36. The detector is placed at a 90° angle from the incident light so that it detects only emitted light and not residual incident light that passes directly through the sample, or reflected light bounded back from the sample or cuvette.
- 37. Analytes of interest in clinical chemistry are not innately fluorescent. Instead, fluorescent molecules are incorporated as reagents to help detect analytes. For example, immunological methods for measurement of tumor markers like CA-125 (ovarian cancer marker) and CA15-3 (breast cancer marker) use antibodies that have a fluorescent compound attached. The antibody recognizes and binds to the tumor marker. Excess (unbound) antibodies are washed away and the amount of fluorescent light generated is in direct proportion to the amount of tumor marker in the sample.
- 38. Chemiluminescence is light emission due to a chemical reaction. Similar to fluorescence, there are some molecules that, due to their structure, can produce light rather than heat when they react with other molecules. Some immunological methods for measuring hormones and tumor markers utilize a chemiluminescent molecule
- 39. After a selective antibody binds to the analyte in the patient’s specimen, the bound and unbound antibodies are separated, and a second antibody linked to a chemiluminescent molecule is added. Once bound to the first antibody bound complex, a chemical is added to the mixture to generate a chemiluminescent signal that is proportional to the amount of analyte in the sample
- 40. In a variation of this technique, the chemiluminescent signal is generated by pulsing the mixture with an electrical current rather than through a chemical reaction. This method is called electrochemiluminescence.