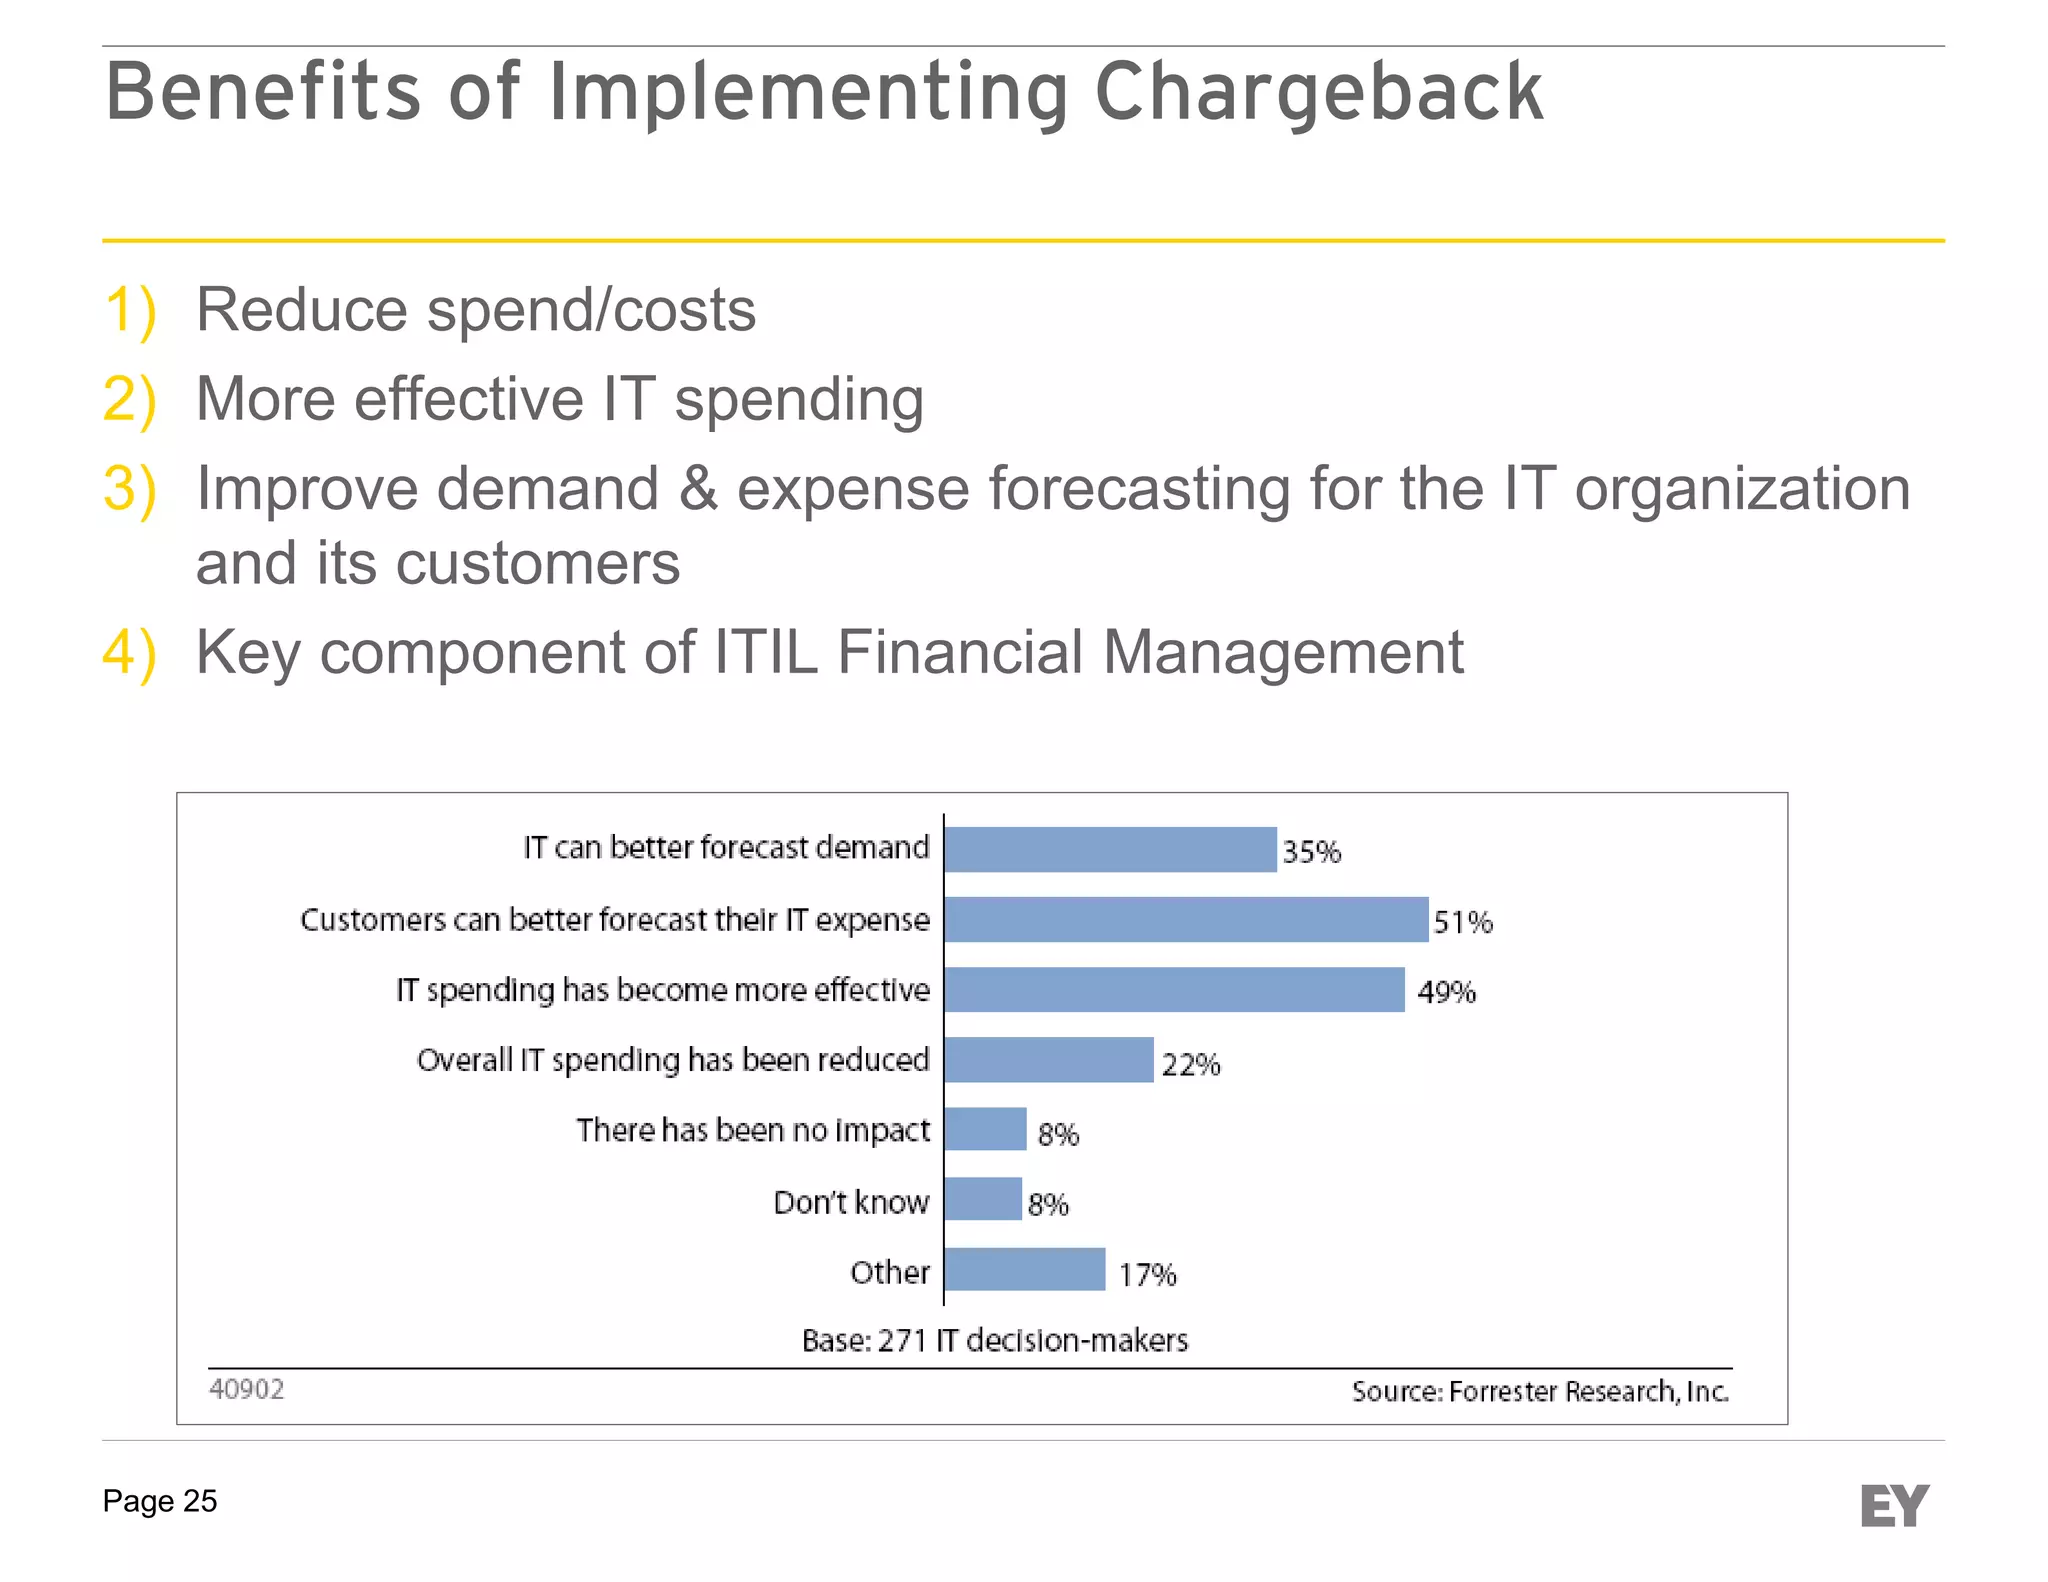
SlideShare a Scribd company logo
IT Financial
Management Journey
Ernst & Young Perspectives
ITFMA – Chicago, 2016
Pete Hidalgo & Shashank Aggarwal
Page 1 Competitor analysis
Agenda
The ITFM Journey2
Client case study3
1 Current challenges
Q & A4
Page 2
Current Challenges
Business executives want to clearly understand the IT organization’s value
and how it supports the business strategy
► Increase the value received from IT
► Make sure IT is supporting the business strategy
► Measure and manage IT appropriately
► Use IT to improve the business
► Develop a common language for communicating with
IT
► Make IT a part of the team
► Demonstrate the value IT provides to the business
► Secure the resources IT needs to deliver results
► Have a place at the executive table
► Have a common language for communicating with
business leaders
CEO/CFO
Senior Business
Leaders
CIO/
Senior IT Leaders
Stakeholders Stakeholder Priorities for IT
ITFM Journey
Page 4
The EY IT Financial Management (ITFM)
Journey
EY’s ITFM journey provides a clear and easy to follow path to enable the delivery of cost
effective services to the business, improve transparency and increase satisfaction.
Step 1
Current state
assessment
Step 2
Service definition
Step 3
Unit service costing
Step 4
Metrics and reporting
Step 5
Chargeback model
Step 6
Bill of IT
 Transparency
 Cost efficiency
 Customer
satisfaction
Step 1
Current State
Assessment
Page 6
Current State Assessment
You need to understand where you are before determining where you need
to go
Utilizing the EY ITFM framework as a reference
Current
State
Assessment
Data collection
Interviews
Maturity
Assessment
Gaps
Page 7
EY IT Financial Management Framework
ITIL based, but also incorporates our view of leading practice
Page 8
Cu
IT Financial Management Maturity Model
Used to determine where you are and where you want to be
Value High
DetailandComplexity
Low
High
1
Cost
Center
DefendingcostAddingvalue
2
Commodity
3
Utility
4
Advisor
5
Business
Partner
Current State
Target State
Page 9
# Maturity Level Maturity Description
1 Cost Center
• IT organization has a very tactical focus
• Low interaction between Business and IT
• Costs are defined and allocated at a high-level (People, Software, Hardware, etc) based on
Revenues, FTEs
• Lack of cost transparency
2 Commodity
• IT works closely with the business but does not drive strategic initiatives
• IT costs are broken down into sub-categories (example: software & infrastructure costs)
• IT costs are aligned based on resources rather than consumption
• Business has little influence over IT costs
3 Utility
• IT works closely with the business but does not drive strategic initiatives
• IT costs are broken down into sub-categories (example: software & infrastructure costs)
• IT costs are aligned based consumption with SLAs in place
• Business has little influence over IT costs
4 Advisor
• IT advises the business on execution of strategic initiatives
• IT costs are reported at the business application/process level
• Business has a good understanding of its IT costs
• Business can influence IT costs by optimizing and rationalizing applications / processes
• Driver based planning
5 Business Partner
• IT is proactive in initiating strategic initiatives
• IT costs are service-based
• Business can influence its IT costs by managing its consumption of IT resources
• End-to-end view of financial data – from resources to services to applications
• Driver based planning
ITFM Maturity Model Criteria
Used to determine maturity levels
Step 2
Service Definition
Page 11
IT Service Catalog
Foundational element for all IT organizations
Benefits
1) Improved transparency
and customer
satisfaction
2) Demonstrates the value
of IT
3) Ease of service ordering
and interfacing with IT
4) Documents service
levels for each service
(SLAs)
5) Leads to more efficient
consumption of services
 Provides a single reference source for all IT services offered
Page 12
What is a service catalog?
A communication tool to have a
productive dialogue with the business
about what services IT can deliver to
help make them successful
The foundation for any type of
allocation or chargeback process
An easy to use document to help
customers understand how to
request services, what the service
performance levels are, and what
they cost
A Service Catalog is… A Service Catalog is not…
a
X
Constrained by the current structure
of outsourcing service contracts
A detailed technical process list
that shows how to deliver IT services
A self-service portal for the
business
A leading practice framework for
defining services which can be
benchmarked
An IT Operating or Service Delivery
model.
Page 13
The EY reference framework for structuring the
service catalog – focused on “The What”
The What
(Service Offering & Service Performance)
The How
(Service Delivery)
Service Portfolio
(Employee Enablement)
PC
Email
Telephony Technology
Service Tiers
SLA’s
Availability
Response Time
Tools
Infrastructure
Service Tier 2
(Silver)
Service Tier 3
(Bronze)
Service Tier 1
(Gold)
Delivery Model
(Logical grouping of services
offerings)
(Discrete services provided to a
customer )
(Specific capabilities or features that
constitutes a service)
(Service performance
expectations)
(Delivery of one service)
(Core technologies and tools to deliver service)
Services Service Performance
People
Processes
Page 14
Service catalog evolution
“Don’t let perfect be the enemy of good”
1. Catalog includes improved
SLAs and unit service costs
2. Catalog includes tiered
services, resolution time SLAs,
and partial costs
3. Initial catalog includes basic
services, only response time
SLAs, not resolution times
Services are not defined or ad-
hoc definitions are in place with
few synergies
Maturity
Time
High
Low
1
2
3
4
No catalog
Basic services
and response
time SLAs
Tiered services
and resolution
time SLAs
Improved
SLAs and
unit service
costs
1
2
3
4
Step 3
IT Service Costing
Page 16
IT Service Costing Definition
► IT Service Costing (ITSC) is the process of calculating the
actual unit costs of providing IT services
Key Points
► Once actual unit service costs are determined they can be
compared to market rates to identify potential savings
opportunities
► One key goal for the IT organization is to have the cost of their
services be at or below external service providers
Dependencies
1) Services must be defined first
2) Must have good consumption data
3) Need cost data that is aligned with services
4) Effective chargeback implementation requires unit service costs
Page 17
► Benchmarking
► Build vs. buy
► Internal & External
► Drives efficient
consumption
► Align demand to
capacity
► Customer focused
► Service oriented
► Visibility
► Consistency
► Accuracy
► Cost drivers
► Cost of service
ITSC – Benefits
Service based costing empowers executive decision making ability through
improved IT cost visibility
Aligns IT to
Business
Strategy
Performance
Management
Cost
Transparency
Allocations /
Chargeback
Cost
Management
Resource
Management
Page 18
Others
►Cost per server
►Cost per
application
►Cost per GB of
disk storage
►Cost per help
desk call
►Cost per PC
►Cost per
telephone
►Etc.
Remote
Services
HR FIN
Others
Sales BI
Others
Hosting
Services
Application
Mgmt.
Telecom
Services
Others
►Helpdesk
►Server mgmt.
►Voice
►WAN/LAN
►Storage
►Etc.
Cost Drivers:
►Servers
►Storage
►Applications
►FTEs
►Etc.
Labor
Maintenance
Depreciation
IT Departments Services
Cost
Pools
Service
Costs
Consumption
Drivers
EY Service Costing Framework
Service Costing Framework
Translates IT department costs into service costs that are meaningful to
users/customers and enables benchmarking / savings identification
Linkage to
Chargeback
Service
Catalog
Usage Data
Page 19
Data Quality
Cost and consumption data are BOTH required in order to calculate unit
service costs
► The EY data quality framework enables the assessment of both
cost and consumption data in order to:
► Identify gaps for improvement
► Determine readiness for chargeback
Inventory Weight
Data
Received
Score Inventory Weight
Data
Received
Score
Identity and End User Computing Number of PCs per BU 0.5 90% 0.45 Service Cost 0.5 100% 0.5 0.95 95%
Service Desk and support Number of incidents per BU 0.5 80% 0.4 Service Cost 0.5 85% 0.425 0.825 83%
Conferencing (video, webex)
Telepresence location per
building with usage by BUs
0.5 80% 0.4
Telepresence cost data by
locations or BU
0.5 85% 0.425 0.825 83%
Email & collaboration tools
Number of email accounts
per BU
0.5 100% 0.5
FTE/Agency workers information
supporting collaboration tools
0.5 85% 0.425 0.925 93%
Telephones
Number of
handsets/extensions per
business unit and their
consumption
0.5 95% 0.475
Cost incurred for the usage of the
extensions per BU
0.5 85% 0.425 0.9 90%
Network connectivity LAN/WAN site information 0.5 85% 0.425 Cost of circuits and networks 0.5 85% 0.425 0.85 85%
Mobility Number of Mobile Apps 0.5 25% 0.125 Service Cost 0.5 85% 0.425 0.55 55%
0 0% 0
FTE/Agency workers information
per BU
0.5 75% 0.375
- 0 0% 0
Cost of software provisioned for
PCs
0.5 75% 0.375
Infrastructure (DC & Connectivity)
Servers associated
applications and quantities
0.5 75% 0.375
Servers costs associates with
their usage and services
0.5 75% 0.375 0.75 75%
Infrastructure (Compute / Servers)
Storage associated servers
and quantities
0.5 75% 0.375
Storage costs associates with
their usage and services
0.5 75% 0.375 0.75 75%
Infrastructure (Storage & Back-Up)
Data Center associated
servers with applications
0.5 75% 0.375
Data Center costs associated
with hosting servers and
applications
0.5 75% 0.375 0.75 75%
Databases, JAVA, .NET, tools
Number of databases,
associated applications and
usage per BU
0.5 75% 0.375
FTE/Agency workers supporting
databases per BU
0.5 100% 0.5 0.875 88%
Integration
Applications supported for
integrations purposes and
the corresponding BUs
using those applications
0.5 100% 0.5
FTE/Agency numbers per BU for
developing/supporting/maintaining
the service
0.5 100% 0.5 1 100%
Number of sites and
locations
0 95% 0
FTE/Agency workers per BU for
service provided
0.5 40% 0.2
- 0 0% 0
Non-Labor costs (Software /
Infrastructure)
0.5 40% 0.2
NA 0 0% 0
FTE/Agency workers per BU for
service provided
0.5 100% 0.5
NA 0 0% 0
Non-Labor costs (Software /
Infrastructure)
0.5 85% 0.425
NA 0 0% 0
FTE/Agency workers per BU for
service provided
0.5 100% 0.5
0 0% 0 Non-Labor costs 0.5 100% 0.5
NA 0 0% 0
FTE/Agency workers per BU for
service provided
0.5 100% 0.5
0 0% 0 Non-Labor costs 0.5 100% 0.5
NA 0 0% 0
FTE/Agency workers per BU for
service provided
0.5 100% 0.5
0 0% 0 Non-Labor costs 0.5 100% 0.5
NA 0 0% 0
FTE/Agency workers per BU for
service provided
0.5 100% 0.5
0 0% 0 Non-Labor costs 0.5 100% 0.5
NA 0 0% 0
FTE/Agency workers per BU for
service provided
0.5 100% 0.5
0 0% 0 Non-Labor costs 0.5 100% 0.5
Organizational Data
Employee headcount by
BU/Country/Region across
the organization
0.5 100% 0.5 IT Organization/Services budgets 0.5 100% 0.5 1 100%
Site Information
Building data and BUs
associated with it
1 100% 1 0 100% 0 1 100%
1
100% 5%1
1
1
100%
100%
100%
100%
Category
Quality
Category
Weight
Overall Data
Quality
ADM 0.75 75%
81% 29%
Cost Data
83% 11%
82%
Total Weighted
Score
Data Item
Quality
100% 0%
13%
Projects
New projects requested from GIS by
the business
93% 42%
Local Support
On-site support for infrastructure and
applications
40%
93%
Service Name Service Cost Quantity
Consumption Data
Budgets
$ 275
$ 125
$ 400
$ 50
Service Category
$ -
Staffing
Enablement
0.4 40%
0.925
Application
Delivery &
Support
Foundational
Cost /
Consumption
Data
Security Risk Management 1 100%
Strategy, Architecture, & Governance
Industry and innovation
BI, Data warehouse
HR, Business Resources
Corporate
Services
$ 100
Data quality heat map
Data quality assessment tool
Step 4
Metrics & Reporting
Page 21
Metrics & Reporting
► Purpose
► Necessary for effective management and customer satisfaction
► “What gets measured gets done”
► Emphasis on quality over quantity
► Metrics
► KPIs
► Key Performance Indicators that are measured and reported internally to
manage services or processes
► SLAs
► Service Level Agreements, which are a formal commitment to a
predetermined and agreed to level of service between IT and the
business/customer
► Reporting
► Metrics - three levels: Business, executive, operational
► Usage - shows consumption of IT services by the business
Page 22
Usage Reporting Example
Customers need to understand their consumption and costs in order to manage them
► Highest benefit and maturity level is to produce monthly for each service via
self-service on an automated platform
► Can be produced manually as an initial solution using Excel
Automated Example – ITFM Tool Manual Example - Excel
Step 5
Chargeback
Page 24
Why implement chargeback?
► To understand the true costs of providing IT services
► To educate IT customers on the value of the IT services
that are being provided
► As a tool to improve operating efficiencies and lower
costs
► To enable customers to manage their own consumption
of services and associated costs
-
Page 25
Benefits of Implementing Chargeback
1) Reduce spend/costs
2) More effective IT spending
3) Improve demand & expense forecasting for the IT organization
and its customers
4) Key component of ITIL Financial Management
Page 26
Chargeback Model Maturity Curve
Used to determine where you are and where you want to be
Implementation Time Long
Maturity
Short
High
1
Overhead
allocation
2
Flat fee
3
Consumption
based
4
Incentive
based
5
Service
based
6
External
pricing
7
Value based
pricing
Current State
Target State
Page 27
Chargeback Model Definitions and Features
IT chargeback
methodology
Methodology description
1. Overhead allocation
2. Flat fee
4. Incentive based
5. Service based
6. External pricing
7. Value based pricing
3. Resource consumption
based
► IT costs are allocated to LOBs as a corporate overhead cost based on a simple driver not
directly related to resource consumption (e.g. revenue, asset balance, etc.)
► Fixed annual cost negotiated with BUs; normally based on a “crude” estimate of resource
consumption
► IT charges are manipulated to drive specific behavior (e.g., lower charges to influence use of
network or servers during off-peak times)
► IT service charges to BUs are based on consumption of specific activities; quality and
availability of services are explicitly defined, service “choice” provided for key products
► IT service fees are based on market (external) prices; products offered are comparable to
those available in the marketplace
► IT service fees are based on perceived value delivered to LOBs (e.g., business value
created, customer satisfaction, timely delivery of new financial products)
► IT costs are allocated based on specific unit of resource consumed (e.g., number of
dedicated servers, network ports, etc.)
CostAwareness
Cost
Measurement
Effort
Costsand
Complexity
CostManagement
Effort
0. No chargeback ► IT costs are not charged back
= Low = Medium = HighKEY:
Page 28
The Chargeback Journey
Implementing chargeback is an evolutionary process vs. “big bang”
Usage
reporting
Showback
(Usage + $)
Chargeback
Time
Maturity
Page 29
Automation
Frequency
Chargeback Automation and Frequency
To perform more frequent chargebacks increasing levels of automation are needed
Page 30
Chargeback Data Requirements
To chargeback on a unit cost basis, unit consumption and cost data is needed
Datagranularity
Type of model
Page 31
Guiding Principles
Consistency
Effort
Fairness
Transparency
► Are IT chargeback methods aligned with cost allocation and
profitability measurement used throughout the organization?
► How much effort (e.g., data collection, transformation,
calculation, reconciliation, and billing) is appropriate and is it in
keeping with the value provided?
► To what degree should chargeback be based on actual
consumption versus an estimated allocation?
► What costs should be included/excluded?
► What insight should customers have into how IT manages IT—
including which costs are fixed and which are variable?
► What behaviors, if any, should chargeback drive (e.g. reduced
consumption, investment in new products, incentives to move
users from old technologies, etc.)?
Influence
Chargeback guiding principles
Page 32
Chargeback Models
Not one size fits all, and that’s okay
HighImplementation complexity
Low
High
Businessbenefitsandtransparency
Resource-
based
allocations
Differentiated
service levels
and pricing
1. Overhead
allocation
2. Flat fee
6. External
pricing
7. Value based
pricing
4. Incentive
based
3. Resource
consumption
based
5. Service based
Service
pricing
Resourced-Based Allocations distributes
costs through allocations or simple
consumption estimates
Service Pricing measures specific
consumption and drives behavior through
tiered services and prices (e.g. incentives for
off-peak usage)
Differentiated Service Levels and Pricing
reflects a more market-based approach to
cost recovery
High
Automation
Page 34
Why automate?
► Improve unit service costing and benchmarking
accuracy, leading to lower costs
► Increase transparency into consumption and costs
► Needed to provide monthly reporting and chargeback –
manual models require large amounts of labor
► Provide self-service capabilities to customers, so that
they can understand and regulate their consumption
► More efficient than manual processes
Page 35
Tool selection
► You should first consider if you are ready for a tool.
Some key points to keep in mind:
► Are services well defined?
► Are ITFM roles and processes defined and mature?
► Service consumption data ownership, availability, and quality
are key requirements
► There are multiple tools
available in the market, so you
should evaluate them based on
your specific requirements
using well defined criteria and
use cases
► You can use resources such as
Gartner as a guide
Case Study
Page 37
Client ITFM case study overview
This is one of many examples of the benefits of implementing ITFM processes
► Client objectives
► Create financial transparency for all products and services provided
by IT infrastructure services
► Continue to reduce infrastructure support costs, optimize
operations
► Achieve or exceed cost benchmarks in all elements of IT
Infrastructure Services
► Derive benefits from the previously purchased ITFM tool
► Results
► Developed a comprehensive end state architecture and two year
roadmap to success
► Identified $6M - $10M in initial savings
► Designed the chargeback model, roles, metrics, and processes to
provide additional transparency to the business
► Developed an implementation plan to operationalize their ITFM tool
Page 38
Peter Hidalgo, Jr
ITFM Services Lead
Senior Manager
IT Transformation
Advisory Services
Ernst & Young LLP
5 Times Square
New York, NY 10036-6530,
United States of America
Pete.Hidalgo@ey.com
Mobile: 973-223-5616
Education
West Point - USMA
BS – Engineering
Columbia University
MBA
Certification(s)
PMP
ITIL Financial Management
► Senior Manager with over 20 years of experience in I.T. Financial Management, Telecom and I.T. infrastructure,
Cost Optimization, Program Management, and I.T. Shared Services Transformation.
► Deep industry experience in managing and optimizing I.T. costs. Previous responsibilities included serving as the
Global I.T. Financial Manager for a Fortune 100 company, where he managed an annual operating budget of over
$100 million. In that role he also developed and implemented an ITIL based service costing and chargeback
process, resulting in improved client satisfaction and major, recurring cost savings.
► Currently serves as the I.T. Financial Management Service Leader within Ernst & Young’s IT Advisory practice
Relevant experience
► Assisted a Fortune 50 global manufacturing client with redesigning their current IT allocation model and
processes for over $1 billion in annual spend
► Advised a Fortune 50 pharmaceutical client with improving their IT financial management processes, cost
transparency, data management, chargeback model redesign, service owner framework, and automation
► Advised and assisted a leading media and entertainment company to transform their IT operations into a shared
services model encompassing 11 major service domains. Also assisted in the development of a data center
strategy, a WAN architecture review, and a detailed IT service cost analysis, to include the development of a
service catalog, and a chargeback model.
► Assisted in an IT infrastructure (voice, data, and data center) strategic assessment and financial analysis for a
Fortune 500 corporation, which resulted in identifying the strategies to improve network and data center
performance and availability, in addition to saving $32M - $53M over three years in IT operating expenses.
► Supported an IT Cost Optimization study for the premium spirits and wine supplier in the U.S., which addressed
their telecom and infrastructure spend. Identified annual savings of 10% to 19%.
► Advised in the strategic assessment of the voice and data networks for a Fortune 500 high tech manufacturing
firm, which resulted in a new technology direction (VOIP) and Identified over $9M in annual savings.
► Assisted in performing an IT Operations strategic assessment for a Fortune 100 manufacturing corporation,
focusing on data center consolidation. Developed data center consolidation and disaster recovery strategies, in
addition to Identifying over $5M in annual savings.
► Advised a leading medical device manufacturing company in the evaluation of their outsourced infrastructure
service contracts, resulting in overall savings of $5M - $6M, or 35% - 45%.
► Assisted a Fortune 100 consumer staples company with the assessment of their wireless telecom services
contracts, resulting in overall savings of $6M - $9M, or 45% - 55%.
Page 39
Q & A
EY | Assurance | Tax | Transactions | Advisory
About EY
EY is a global leader in assurance, tax, transaction and advisory
services. The insights and quality services we deliver help build trust
and confidence in the capital markets and in economies the world
over. We develop outstanding leaders who team to deliver on our
promises to all of our stakeholders. In so doing, we play a critical role
in building a better working world for our people, for our clients and for
our communities.
EY refers to the global organization, and may refer to one or more, of
the member firms of Ernst & Young Global Limited, each of which is a
separate legal entity. Ernst & Young Global Limited, a UK company
limited by guarantee, does not provide services to clients. For more
information about our organization, please visit ey.com.
Ernst & Young LLP is a client-serving member firm of
Ernst & Young Global Limited operating in the US.
© 2016 Ernst & Young LLP.
All Rights Reserved.
BSC no. 1602-1728497
ED None
This material has been prepared for general informational purposes only and is not intended
to be relied upon as accounting, tax, or other professional advice. Please refer to your
advisors for specific advice.
ey.com

More Related Content

What's hot

ITIL,COBIT and IT4IT Mapping
ITIL,COBIT and IT4IT MappingITIL,COBIT and IT4IT Mapping
ITIL,COBIT and IT4IT Mapping
Rob Akershoek
 
IT Demand and Delivery Management
IT Demand and Delivery ManagementIT Demand and Delivery Management
IT Demand and Delivery ManagementDavid Messineo
 
Introduction to ITIL 4 and IT service management
Introduction to ITIL 4 and IT service managementIntroduction to ITIL 4 and IT service management
Introduction to ITIL 4 and IT service management
Christian F. Nissen
 
Difference between ITIL v3 and ITIL 4 | ITIL® Foundation Training | Edureka
Difference between ITIL v3 and ITIL 4 | ITIL® Foundation Training | EdurekaDifference between ITIL v3 and ITIL 4 | ITIL® Foundation Training | Edureka
Difference between ITIL v3 and ITIL 4 | ITIL® Foundation Training | Edureka
Edureka!
 
Optimize the IT Operating Model
Optimize the IT Operating ModelOptimize the IT Operating Model
Optimize the IT Operating Model
Info-Tech Research Group
 
IT4IT™ - Managing the Business of IT
IT4IT™ - Managing the Business of ITIT4IT™ - Managing the Business of IT
IT4IT™ - Managing the Business of IT
Real IRM
 
IT4IT™ - Managing the Business of IT
IT4IT™ - Managing the Business of ITIT4IT™ - Managing the Business of IT
IT4IT™ - Managing the Business of IT
The Open Group SA
 
AXELOS - ITIL® Foundation
AXELOS - ITIL® FoundationAXELOS - ITIL® Foundation
Defining Services for a Service Catalog
Defining Services for a Service CatalogDefining Services for a Service Catalog
Defining Services for a Service Catalog
Axios Systems
 
Data Architecture, Solution Architecture, Platform Architecture — What’s the ...
Data Architecture, Solution Architecture, Platform Architecture — What’s the ...Data Architecture, Solution Architecture, Platform Architecture — What’s the ...
Data Architecture, Solution Architecture, Platform Architecture — What’s the ...
DATAVERSITY
 
ValueFlowIT: A new IT Operating Model Emerges
ValueFlowIT: A new IT Operating Model EmergesValueFlowIT: A new IT Operating Model Emerges
ValueFlowIT: A new IT Operating Model Emerges
David Favelle
 
ITIL 4 service value chain data flows (input and outputs)
ITIL 4 service value chain data flows (input and outputs)ITIL 4 service value chain data flows (input and outputs)
ITIL 4 service value chain data flows (input and outputs)
Rob Akershoek
 
IT4IT and DevOps Tools Landscape (2020).
IT4IT and DevOps Tools Landscape (2020).IT4IT and DevOps Tools Landscape (2020).
IT4IT and DevOps Tools Landscape (2020).
Rob Akershoek
 
IT4IT - The Full Story for Digital Transformation - Part 2
IT4IT - The Full Story for Digital Transformation - Part 2IT4IT - The Full Story for Digital Transformation - Part 2
IT4IT - The Full Story for Digital Transformation - Part 2
Mohamed Zakarya Abdelgawad
 
IT4IT - Manage the Digital Enterprise.pdf
IT4IT - Manage the Digital Enterprise.pdfIT4IT - Manage the Digital Enterprise.pdf
IT4IT - Manage the Digital Enterprise.pdf
itSMF Belgium
 
Itil4 itsmf
Itil4 itsmfItil4 itsmf
Itil4 itsmf
itSMF Belgium
 
IT4IT™
IT4IT™IT4IT™
IT4IT™
ITpreneurs
 
Review of Information Technology Function Critical Capability Models
Review of Information Technology Function Critical Capability ModelsReview of Information Technology Function Critical Capability Models
Review of Information Technology Function Critical Capability Models
Alan McSweeney
 
Introducing The Open Group IT4IT™ Standard
Introducing The Open Group IT4IT™ StandardIntroducing The Open Group IT4IT™ Standard
Introducing The Open Group IT4IT™ Standard
Enterprise Architects
 
History of IT Service Management Practices and Standards
History of IT Service Management Practices and StandardsHistory of IT Service Management Practices and Standards
History of IT Service Management Practices and Standards
Rob Akershoek
 

What's hot (20)

ITIL,COBIT and IT4IT Mapping
ITIL,COBIT and IT4IT MappingITIL,COBIT and IT4IT Mapping
ITIL,COBIT and IT4IT Mapping
 
IT Demand and Delivery Management
IT Demand and Delivery ManagementIT Demand and Delivery Management
IT Demand and Delivery Management
 
Introduction to ITIL 4 and IT service management
Introduction to ITIL 4 and IT service managementIntroduction to ITIL 4 and IT service management
Introduction to ITIL 4 and IT service management
 
Difference between ITIL v3 and ITIL 4 | ITIL® Foundation Training | Edureka
Difference between ITIL v3 and ITIL 4 | ITIL® Foundation Training | EdurekaDifference between ITIL v3 and ITIL 4 | ITIL® Foundation Training | Edureka
Difference between ITIL v3 and ITIL 4 | ITIL® Foundation Training | Edureka
 
Optimize the IT Operating Model
Optimize the IT Operating ModelOptimize the IT Operating Model
Optimize the IT Operating Model
 
IT4IT™ - Managing the Business of IT
IT4IT™ - Managing the Business of ITIT4IT™ - Managing the Business of IT
IT4IT™ - Managing the Business of IT
 
IT4IT™ - Managing the Business of IT
IT4IT™ - Managing the Business of ITIT4IT™ - Managing the Business of IT
IT4IT™ - Managing the Business of IT
 
AXELOS - ITIL® Foundation
AXELOS - ITIL® FoundationAXELOS - ITIL® Foundation
AXELOS - ITIL® Foundation
 
Defining Services for a Service Catalog
Defining Services for a Service CatalogDefining Services for a Service Catalog
Defining Services for a Service Catalog
 
Data Architecture, Solution Architecture, Platform Architecture — What’s the ...
Data Architecture, Solution Architecture, Platform Architecture — What’s the ...Data Architecture, Solution Architecture, Platform Architecture — What’s the ...
Data Architecture, Solution Architecture, Platform Architecture — What’s the ...
 
ValueFlowIT: A new IT Operating Model Emerges
ValueFlowIT: A new IT Operating Model EmergesValueFlowIT: A new IT Operating Model Emerges
ValueFlowIT: A new IT Operating Model Emerges
 
ITIL 4 service value chain data flows (input and outputs)
ITIL 4 service value chain data flows (input and outputs)ITIL 4 service value chain data flows (input and outputs)
ITIL 4 service value chain data flows (input and outputs)
 
IT4IT and DevOps Tools Landscape (2020).
IT4IT and DevOps Tools Landscape (2020).IT4IT and DevOps Tools Landscape (2020).
IT4IT and DevOps Tools Landscape (2020).
 
IT4IT - The Full Story for Digital Transformation - Part 2
IT4IT - The Full Story for Digital Transformation - Part 2IT4IT - The Full Story for Digital Transformation - Part 2
IT4IT - The Full Story for Digital Transformation - Part 2
 
IT4IT - Manage the Digital Enterprise.pdf
IT4IT - Manage the Digital Enterprise.pdfIT4IT - Manage the Digital Enterprise.pdf
IT4IT - Manage the Digital Enterprise.pdf
 
Itil4 itsmf
Itil4 itsmfItil4 itsmf
Itil4 itsmf
 
IT4IT™
IT4IT™IT4IT™
IT4IT™
 
Review of Information Technology Function Critical Capability Models
Review of Information Technology Function Critical Capability ModelsReview of Information Technology Function Critical Capability Models
Review of Information Technology Function Critical Capability Models
 
Introducing The Open Group IT4IT™ Standard
Introducing The Open Group IT4IT™ StandardIntroducing The Open Group IT4IT™ Standard
Introducing The Open Group IT4IT™ Standard
 
History of IT Service Management Practices and Standards
History of IT Service Management Practices and StandardsHistory of IT Service Management Practices and Standards
History of IT Service Management Practices and Standards
 

Similar to The IT Financial Management Cost Transparency Journey

IT Business Management - Why Now?
IT Business Management - Why Now?IT Business Management - Why Now?
IT Business Management - Why Now?
Senaka Ariyasinghe
 
The overwhelming challenges of IT infrastructure management
The overwhelming challenges of IT infrastructure managementThe overwhelming challenges of IT infrastructure management
The overwhelming challenges of IT infrastructure management
NIIT Technologies
 
Modern IT Service Management Transformation - ITIL Indonesia
Modern IT Service Management Transformation - ITIL IndonesiaModern IT Service Management Transformation - ITIL Indonesia
Modern IT Service Management Transformation - ITIL Indonesia
Eryk Budi Pratama
 
ClearCost Introduction 2015
ClearCost Introduction 2015ClearCost Introduction 2015
ClearCost Introduction 2015
Mark S. Mahre
 
Sc bridge the gap pres brighttalk april 2014 brighttalk
Sc bridge the gap pres brighttalk april 2014 brighttalkSc bridge the gap pres brighttalk april 2014 brighttalk
Sc bridge the gap pres brighttalk april 2014 brighttalkBarclay Rae
 
Sc bridge the gap pres brighttalk april 2014 brighttalk
Sc bridge the gap pres brighttalk april 2014 brighttalkSc bridge the gap pres brighttalk april 2014 brighttalk
Sc bridge the gap pres brighttalk april 2014 brighttalkBarclay Rae
 
The IT Cost Reduction Journey
The IT Cost Reduction JourneyThe IT Cost Reduction Journey
The IT Cost Reduction Journey
Pete Hidalgo
 
Communicating the Value of IT with a Standard Model
Communicating the Value of IT with a Standard ModelCommunicating the Value of IT with a Standard Model
Communicating the Value of IT with a Standard Model
Apptio
 
How to build the business case for Service Catalog
How to build the business case for Service CatalogHow to build the business case for Service Catalog
How to build the business case for Service Catalog
Axios Systems
 
(ONLINE) ITIL Indonesia Community – Meetup “Modern IT Service Management Tran...
(ONLINE) ITIL Indonesia Community – Meetup “Modern IT Service Management Tran...(ONLINE) ITIL Indonesia Community – Meetup “Modern IT Service Management Tran...
(ONLINE) ITIL Indonesia Community – Meetup “Modern IT Service Management Tran...
ITIL Indonesia
 
Bab 8 (managing it services delivery)
Bab 8 (managing it services delivery)Bab 8 (managing it services delivery)
Bab 8 (managing it services delivery)
Siti Mustiani
 
Service Management
Service ManagementService Management
Service Managementjbruk
 
Standardize the Service Desk
Standardize the Service DeskStandardize the Service Desk
Standardize the Service Desk
Info-Tech Research Group
 
Automotive IT Strategy: IT Sourcing
Automotive IT Strategy: IT SourcingAutomotive IT Strategy: IT Sourcing
Automotive IT Strategy: IT Sourcing
Deloitte Deutschland
 
Pmac It Project Management 2010
Pmac It Project Management 2010Pmac It Project Management 2010
Pmac It Project Management 2010
nseiersen
 
IIR IT naklady (english)
IIR IT naklady (english)IIR IT naklady (english)
IIR IT naklady (english)
Marek Blazek
 
Technology business management_7.13
Technology business management_7.13Technology business management_7.13
Technology business management_7.13Jim Sutter
 
Technology business management_7.13
Technology business management_7.13Technology business management_7.13
Technology business management_7.13James Sutter
 
Cultural readiness for itsm v3
Cultural readiness for itsm v3Cultural readiness for itsm v3
Cultural readiness for itsm v3
Troy DuMoulin
 

Similar to The IT Financial Management Cost Transparency Journey (20)

IT Business Management - Why Now?
IT Business Management - Why Now?IT Business Management - Why Now?
IT Business Management - Why Now?
 
The overwhelming challenges of IT infrastructure management
The overwhelming challenges of IT infrastructure managementThe overwhelming challenges of IT infrastructure management
The overwhelming challenges of IT infrastructure management
 
Modern IT Service Management Transformation - ITIL Indonesia
Modern IT Service Management Transformation - ITIL IndonesiaModern IT Service Management Transformation - ITIL Indonesia
Modern IT Service Management Transformation - ITIL Indonesia
 
ClearCost Introduction 2015
ClearCost Introduction 2015ClearCost Introduction 2015
ClearCost Introduction 2015
 
Sc bridge the gap pres brighttalk april 2014 brighttalk
Sc bridge the gap pres brighttalk april 2014 brighttalkSc bridge the gap pres brighttalk april 2014 brighttalk
Sc bridge the gap pres brighttalk april 2014 brighttalk
 
Sc bridge the gap pres brighttalk april 2014 brighttalk
Sc bridge the gap pres brighttalk april 2014 brighttalkSc bridge the gap pres brighttalk april 2014 brighttalk
Sc bridge the gap pres brighttalk april 2014 brighttalk
 
The IT Cost Reduction Journey
The IT Cost Reduction JourneyThe IT Cost Reduction Journey
The IT Cost Reduction Journey
 
Communicating the Value of IT with a Standard Model
Communicating the Value of IT with a Standard ModelCommunicating the Value of IT with a Standard Model
Communicating the Value of IT with a Standard Model
 
How to build the business case for Service Catalog
How to build the business case for Service CatalogHow to build the business case for Service Catalog
How to build the business case for Service Catalog
 
(ONLINE) ITIL Indonesia Community – Meetup “Modern IT Service Management Tran...
(ONLINE) ITIL Indonesia Community – Meetup “Modern IT Service Management Tran...(ONLINE) ITIL Indonesia Community – Meetup “Modern IT Service Management Tran...
(ONLINE) ITIL Indonesia Community – Meetup “Modern IT Service Management Tran...
 
Bab 8 (managing it services delivery)
Bab 8 (managing it services delivery)Bab 8 (managing it services delivery)
Bab 8 (managing it services delivery)
 
IT4IT BCS
IT4IT BCSIT4IT BCS
IT4IT BCS
 
Service Management
Service ManagementService Management
Service Management
 
Standardize the Service Desk
Standardize the Service DeskStandardize the Service Desk
Standardize the Service Desk
 
Automotive IT Strategy: IT Sourcing
Automotive IT Strategy: IT SourcingAutomotive IT Strategy: IT Sourcing
Automotive IT Strategy: IT Sourcing
 
Pmac It Project Management 2010
Pmac It Project Management 2010Pmac It Project Management 2010
Pmac It Project Management 2010
 
IIR IT naklady (english)
IIR IT naklady (english)IIR IT naklady (english)
IIR IT naklady (english)
 
Technology business management_7.13
Technology business management_7.13Technology business management_7.13
Technology business management_7.13
 
Technology business management_7.13
Technology business management_7.13Technology business management_7.13
Technology business management_7.13
 
Cultural readiness for itsm v3
Cultural readiness for itsm v3Cultural readiness for itsm v3
Cultural readiness for itsm v3
 

Recently uploaded

DevOps and Testing slides at DASA Connect
DevOps and Testing slides at DASA ConnectDevOps and Testing slides at DASA Connect
DevOps and Testing slides at DASA Connect
Kari Kakkonen
 
GraphRAG is All You need? LLM & Knowledge Graph
GraphRAG is All You need? LLM & Knowledge GraphGraphRAG is All You need? LLM & Knowledge Graph
GraphRAG is All You need? LLM & Knowledge Graph
Guy Korland
 
Alt. GDG Cloud Southlake #33: Boule & Rebala: Effective AppSec in SDLC using ...
Alt. GDG Cloud Southlake #33: Boule & Rebala: Effective AppSec in SDLC using ...Alt. GDG Cloud Southlake #33: Boule & Rebala: Effective AppSec in SDLC using ...
Alt. GDG Cloud Southlake #33: Boule & Rebala: Effective AppSec in SDLC using ...
James Anderson
 
Communications Mining Series - Zero to Hero - Session 1
Communications Mining Series - Zero to Hero - Session 1Communications Mining Series - Zero to Hero - Session 1
Communications Mining Series - Zero to Hero - Session 1
DianaGray10
 
RESUME BUILDER APPLICATION Project for students
RESUME BUILDER APPLICATION Project for studentsRESUME BUILDER APPLICATION Project for students
RESUME BUILDER APPLICATION Project for students
KAMESHS29
 
Essentials of Automations: The Art of Triggers and Actions in FME
Essentials of Automations: The Art of Triggers and Actions in FMEEssentials of Automations: The Art of Triggers and Actions in FME
Essentials of Automations: The Art of Triggers and Actions in FME
Safe Software
 
GraphSummit Singapore | The Art of the Possible with Graph - Q2 2024
GraphSummit Singapore | The Art of the  Possible with Graph - Q2 2024GraphSummit Singapore | The Art of the  Possible with Graph - Q2 2024
GraphSummit Singapore | The Art of the Possible with Graph - Q2 2024
Neo4j
 
National Security Agency - NSA mobile device best practices
National Security Agency - NSA mobile device best practicesNational Security Agency - NSA mobile device best practices
National Security Agency - NSA mobile device best practices
Quotidiano Piemontese
 
みなさんこんにちはこれ何文字まで入るの?40文字以下不可とか本当に意味わからないけどこれ限界文字数書いてないからマジでやばい文字数いけるんじゃないの?えこ...
みなさんこんにちはこれ何文字まで入るの?40文字以下不可とか本当に意味わからないけどこれ限界文字数書いてないからマジでやばい文字数いけるんじゃないの?えこ...みなさんこんにちはこれ何文字まで入るの?40文字以下不可とか本当に意味わからないけどこれ限界文字数書いてないからマジでやばい文字数いけるんじゃないの?えこ...
みなさんこんにちはこれ何文字まで入るの?40文字以下不可とか本当に意味わからないけどこれ限界文字数書いてないからマジでやばい文字数いけるんじゃないの?えこ...
名前 です男
 
A tale of scale & speed: How the US Navy is enabling software delivery from l...
A tale of scale & speed: How the US Navy is enabling software delivery from l...A tale of scale & speed: How the US Navy is enabling software delivery from l...
A tale of scale & speed: How the US Navy is enabling software delivery from l...
sonjaschweigert1
 
Encryption in Microsoft 365 - ExpertsLive Netherlands 2024
Encryption in Microsoft 365 - ExpertsLive Netherlands 2024Encryption in Microsoft 365 - ExpertsLive Netherlands 2024
Encryption in Microsoft 365 - ExpertsLive Netherlands 2024
Albert Hoitingh
 
The Art of the Pitch: WordPress Relationships and Sales
The Art of the Pitch: WordPress Relationships and SalesThe Art of the Pitch: WordPress Relationships and Sales
The Art of the Pitch: WordPress Relationships and Sales
Laura Byrne
 
Video Streaming: Then, Now, and in the Future
Video Streaming: Then, Now, and in the FutureVideo Streaming: Then, Now, and in the Future
Video Streaming: Then, Now, and in the Future
Alpen-Adria-Universität
 
FIDO Alliance Osaka Seminar: The WebAuthn API and Discoverable Credentials.pdf
FIDO Alliance Osaka Seminar: The WebAuthn API and Discoverable Credentials.pdfFIDO Alliance Osaka Seminar: The WebAuthn API and Discoverable Credentials.pdf
FIDO Alliance Osaka Seminar: The WebAuthn API and Discoverable Credentials.pdf
FIDO Alliance
 
GridMate - End to end testing is a critical piece to ensure quality and avoid...
GridMate - End to end testing is a critical piece to ensure quality and avoid...GridMate - End to end testing is a critical piece to ensure quality and avoid...
GridMate - End to end testing is a critical piece to ensure quality and avoid...
ThomasParaiso2
 
20240607 QFM018 Elixir Reading List May 2024
20240607 QFM018 Elixir Reading List May 202420240607 QFM018 Elixir Reading List May 2024
20240607 QFM018 Elixir Reading List May 2024
Matthew Sinclair
 
Artificial Intelligence for XMLDevelopment
Artificial Intelligence for XMLDevelopmentArtificial Intelligence for XMLDevelopment
Artificial Intelligence for XMLDevelopment
Octavian Nadolu
 
Introduction to CHERI technology - Cybersecurity
Introduction to CHERI technology - CybersecurityIntroduction to CHERI technology - Cybersecurity
Introduction to CHERI technology - Cybersecurity
mikeeftimakis1
 
GraphSummit Singapore | Graphing Success: Revolutionising Organisational Stru...
GraphSummit Singapore | Graphing Success: Revolutionising Organisational Stru...GraphSummit Singapore | Graphing Success: Revolutionising Organisational Stru...
GraphSummit Singapore | Graphing Success: Revolutionising Organisational Stru...
Neo4j
 
Secstrike : Reverse Engineering & Pwnable tools for CTF.pptx
Secstrike : Reverse Engineering & Pwnable tools for CTF.pptxSecstrike : Reverse Engineering & Pwnable tools for CTF.pptx
Secstrike : Reverse Engineering & Pwnable tools for CTF.pptx
nkrafacyberclub
 

Recently uploaded (20)

DevOps and Testing slides at DASA Connect
DevOps and Testing slides at DASA ConnectDevOps and Testing slides at DASA Connect
DevOps and Testing slides at DASA Connect
 
GraphRAG is All You need? LLM & Knowledge Graph
GraphRAG is All You need? LLM & Knowledge GraphGraphRAG is All You need? LLM & Knowledge Graph
GraphRAG is All You need? LLM & Knowledge Graph
 
Alt. GDG Cloud Southlake #33: Boule & Rebala: Effective AppSec in SDLC using ...
Alt. GDG Cloud Southlake #33: Boule & Rebala: Effective AppSec in SDLC using ...Alt. GDG Cloud Southlake #33: Boule & Rebala: Effective AppSec in SDLC using ...
Alt. GDG Cloud Southlake #33: Boule & Rebala: Effective AppSec in SDLC using ...
 
Communications Mining Series - Zero to Hero - Session 1
Communications Mining Series - Zero to Hero - Session 1Communications Mining Series - Zero to Hero - Session 1
Communications Mining Series - Zero to Hero - Session 1
 
RESUME BUILDER APPLICATION Project for students
RESUME BUILDER APPLICATION Project for studentsRESUME BUILDER APPLICATION Project for students
RESUME BUILDER APPLICATION Project for students
 
Essentials of Automations: The Art of Triggers and Actions in FME
Essentials of Automations: The Art of Triggers and Actions in FMEEssentials of Automations: The Art of Triggers and Actions in FME
Essentials of Automations: The Art of Triggers and Actions in FME
 
GraphSummit Singapore | The Art of the Possible with Graph - Q2 2024
GraphSummit Singapore | The Art of the  Possible with Graph - Q2 2024GraphSummit Singapore | The Art of the  Possible with Graph - Q2 2024
GraphSummit Singapore | The Art of the Possible with Graph - Q2 2024
 
National Security Agency - NSA mobile device best practices
National Security Agency - NSA mobile device best practicesNational Security Agency - NSA mobile device best practices
National Security Agency - NSA mobile device best practices
 
みなさんこんにちはこれ何文字まで入るの?40文字以下不可とか本当に意味わからないけどこれ限界文字数書いてないからマジでやばい文字数いけるんじゃないの?えこ...
みなさんこんにちはこれ何文字まで入るの?40文字以下不可とか本当に意味わからないけどこれ限界文字数書いてないからマジでやばい文字数いけるんじゃないの?えこ...みなさんこんにちはこれ何文字まで入るの?40文字以下不可とか本当に意味わからないけどこれ限界文字数書いてないからマジでやばい文字数いけるんじゃないの?えこ...
みなさんこんにちはこれ何文字まで入るの?40文字以下不可とか本当に意味わからないけどこれ限界文字数書いてないからマジでやばい文字数いけるんじゃないの?えこ...
 
A tale of scale & speed: How the US Navy is enabling software delivery from l...
A tale of scale & speed: How the US Navy is enabling software delivery from l...A tale of scale & speed: How the US Navy is enabling software delivery from l...
A tale of scale & speed: How the US Navy is enabling software delivery from l...
 
Encryption in Microsoft 365 - ExpertsLive Netherlands 2024
Encryption in Microsoft 365 - ExpertsLive Netherlands 2024Encryption in Microsoft 365 - ExpertsLive Netherlands 2024
Encryption in Microsoft 365 - ExpertsLive Netherlands 2024
 
The Art of the Pitch: WordPress Relationships and Sales
The Art of the Pitch: WordPress Relationships and SalesThe Art of the Pitch: WordPress Relationships and Sales
The Art of the Pitch: WordPress Relationships and Sales
 
Video Streaming: Then, Now, and in the Future
Video Streaming: Then, Now, and in the FutureVideo Streaming: Then, Now, and in the Future
Video Streaming: Then, Now, and in the Future
 
FIDO Alliance Osaka Seminar: The WebAuthn API and Discoverable Credentials.pdf
FIDO Alliance Osaka Seminar: The WebAuthn API and Discoverable Credentials.pdfFIDO Alliance Osaka Seminar: The WebAuthn API and Discoverable Credentials.pdf
FIDO Alliance Osaka Seminar: The WebAuthn API and Discoverable Credentials.pdf
 
GridMate - End to end testing is a critical piece to ensure quality and avoid...
GridMate - End to end testing is a critical piece to ensure quality and avoid...GridMate - End to end testing is a critical piece to ensure quality and avoid...
GridMate - End to end testing is a critical piece to ensure quality and avoid...
 
20240607 QFM018 Elixir Reading List May 2024
20240607 QFM018 Elixir Reading List May 202420240607 QFM018 Elixir Reading List May 2024
20240607 QFM018 Elixir Reading List May 2024
 
Artificial Intelligence for XMLDevelopment
Artificial Intelligence for XMLDevelopmentArtificial Intelligence for XMLDevelopment
Artificial Intelligence for XMLDevelopment
 
Introduction to CHERI technology - Cybersecurity
Introduction to CHERI technology - CybersecurityIntroduction to CHERI technology - Cybersecurity
Introduction to CHERI technology - Cybersecurity
 
GraphSummit Singapore | Graphing Success: Revolutionising Organisational Stru...
GraphSummit Singapore | Graphing Success: Revolutionising Organisational Stru...GraphSummit Singapore | Graphing Success: Revolutionising Organisational Stru...
GraphSummit Singapore | Graphing Success: Revolutionising Organisational Stru...
 
Secstrike : Reverse Engineering & Pwnable tools for CTF.pptx
Secstrike : Reverse Engineering & Pwnable tools for CTF.pptxSecstrike : Reverse Engineering & Pwnable tools for CTF.pptx
Secstrike : Reverse Engineering & Pwnable tools for CTF.pptx
 

The IT Financial Management Cost Transparency Journey

  • 1. IT Financial Management Journey Ernst & Young Perspectives ITFMA – Chicago, 2016 Pete Hidalgo & Shashank Aggarwal
  • 2. Page 1 Competitor analysis Agenda The ITFM Journey2 Client case study3 1 Current challenges Q & A4
  • 3. Page 2 Current Challenges Business executives want to clearly understand the IT organization’s value and how it supports the business strategy ► Increase the value received from IT ► Make sure IT is supporting the business strategy ► Measure and manage IT appropriately ► Use IT to improve the business ► Develop a common language for communicating with IT ► Make IT a part of the team ► Demonstrate the value IT provides to the business ► Secure the resources IT needs to deliver results ► Have a place at the executive table ► Have a common language for communicating with business leaders CEO/CFO Senior Business Leaders CIO/ Senior IT Leaders Stakeholders Stakeholder Priorities for IT
  • 5. Page 4 The EY IT Financial Management (ITFM) Journey EY’s ITFM journey provides a clear and easy to follow path to enable the delivery of cost effective services to the business, improve transparency and increase satisfaction. Step 1 Current state assessment Step 2 Service definition Step 3 Unit service costing Step 4 Metrics and reporting Step 5 Chargeback model Step 6 Bill of IT  Transparency  Cost efficiency  Customer satisfaction
  • 7. Page 6 Current State Assessment You need to understand where you are before determining where you need to go Utilizing the EY ITFM framework as a reference Current State Assessment Data collection Interviews Maturity Assessment Gaps
  • 8. Page 7 EY IT Financial Management Framework ITIL based, but also incorporates our view of leading practice
  • 9. Page 8 Cu IT Financial Management Maturity Model Used to determine where you are and where you want to be Value High DetailandComplexity Low High 1 Cost Center DefendingcostAddingvalue 2 Commodity 3 Utility 4 Advisor 5 Business Partner Current State Target State
  • 10. Page 9 # Maturity Level Maturity Description 1 Cost Center • IT organization has a very tactical focus • Low interaction between Business and IT • Costs are defined and allocated at a high-level (People, Software, Hardware, etc) based on Revenues, FTEs • Lack of cost transparency 2 Commodity • IT works closely with the business but does not drive strategic initiatives • IT costs are broken down into sub-categories (example: software & infrastructure costs) • IT costs are aligned based on resources rather than consumption • Business has little influence over IT costs 3 Utility • IT works closely with the business but does not drive strategic initiatives • IT costs are broken down into sub-categories (example: software & infrastructure costs) • IT costs are aligned based consumption with SLAs in place • Business has little influence over IT costs 4 Advisor • IT advises the business on execution of strategic initiatives • IT costs are reported at the business application/process level • Business has a good understanding of its IT costs • Business can influence IT costs by optimizing and rationalizing applications / processes • Driver based planning 5 Business Partner • IT is proactive in initiating strategic initiatives • IT costs are service-based • Business can influence its IT costs by managing its consumption of IT resources • End-to-end view of financial data – from resources to services to applications • Driver based planning ITFM Maturity Model Criteria Used to determine maturity levels
  • 12. Page 11 IT Service Catalog Foundational element for all IT organizations Benefits 1) Improved transparency and customer satisfaction 2) Demonstrates the value of IT 3) Ease of service ordering and interfacing with IT 4) Documents service levels for each service (SLAs) 5) Leads to more efficient consumption of services  Provides a single reference source for all IT services offered
  • 13. Page 12 What is a service catalog? A communication tool to have a productive dialogue with the business about what services IT can deliver to help make them successful The foundation for any type of allocation or chargeback process An easy to use document to help customers understand how to request services, what the service performance levels are, and what they cost A Service Catalog is… A Service Catalog is not… a X Constrained by the current structure of outsourcing service contracts A detailed technical process list that shows how to deliver IT services A self-service portal for the business A leading practice framework for defining services which can be benchmarked An IT Operating or Service Delivery model.
  • 14. Page 13 The EY reference framework for structuring the service catalog – focused on “The What” The What (Service Offering & Service Performance) The How (Service Delivery) Service Portfolio (Employee Enablement) PC Email Telephony Technology Service Tiers SLA’s Availability Response Time Tools Infrastructure Service Tier 2 (Silver) Service Tier 3 (Bronze) Service Tier 1 (Gold) Delivery Model (Logical grouping of services offerings) (Discrete services provided to a customer ) (Specific capabilities or features that constitutes a service) (Service performance expectations) (Delivery of one service) (Core technologies and tools to deliver service) Services Service Performance People Processes
  • 15. Page 14 Service catalog evolution “Don’t let perfect be the enemy of good” 1. Catalog includes improved SLAs and unit service costs 2. Catalog includes tiered services, resolution time SLAs, and partial costs 3. Initial catalog includes basic services, only response time SLAs, not resolution times Services are not defined or ad- hoc definitions are in place with few synergies Maturity Time High Low 1 2 3 4 No catalog Basic services and response time SLAs Tiered services and resolution time SLAs Improved SLAs and unit service costs 1 2 3 4
  • 16. Step 3 IT Service Costing
  • 17. Page 16 IT Service Costing Definition ► IT Service Costing (ITSC) is the process of calculating the actual unit costs of providing IT services Key Points ► Once actual unit service costs are determined they can be compared to market rates to identify potential savings opportunities ► One key goal for the IT organization is to have the cost of their services be at or below external service providers Dependencies 1) Services must be defined first 2) Must have good consumption data 3) Need cost data that is aligned with services 4) Effective chargeback implementation requires unit service costs
  • 18. Page 17 ► Benchmarking ► Build vs. buy ► Internal & External ► Drives efficient consumption ► Align demand to capacity ► Customer focused ► Service oriented ► Visibility ► Consistency ► Accuracy ► Cost drivers ► Cost of service ITSC – Benefits Service based costing empowers executive decision making ability through improved IT cost visibility Aligns IT to Business Strategy Performance Management Cost Transparency Allocations / Chargeback Cost Management Resource Management
  • 19. Page 18 Others ►Cost per server ►Cost per application ►Cost per GB of disk storage ►Cost per help desk call ►Cost per PC ►Cost per telephone ►Etc. Remote Services HR FIN Others Sales BI Others Hosting Services Application Mgmt. Telecom Services Others ►Helpdesk ►Server mgmt. ►Voice ►WAN/LAN ►Storage ►Etc. Cost Drivers: ►Servers ►Storage ►Applications ►FTEs ►Etc. Labor Maintenance Depreciation IT Departments Services Cost Pools Service Costs Consumption Drivers EY Service Costing Framework Service Costing Framework Translates IT department costs into service costs that are meaningful to users/customers and enables benchmarking / savings identification Linkage to Chargeback Service Catalog Usage Data
  • 20. Page 19 Data Quality Cost and consumption data are BOTH required in order to calculate unit service costs ► The EY data quality framework enables the assessment of both cost and consumption data in order to: ► Identify gaps for improvement ► Determine readiness for chargeback Inventory Weight Data Received Score Inventory Weight Data Received Score Identity and End User Computing Number of PCs per BU 0.5 90% 0.45 Service Cost 0.5 100% 0.5 0.95 95% Service Desk and support Number of incidents per BU 0.5 80% 0.4 Service Cost 0.5 85% 0.425 0.825 83% Conferencing (video, webex) Telepresence location per building with usage by BUs 0.5 80% 0.4 Telepresence cost data by locations or BU 0.5 85% 0.425 0.825 83% Email & collaboration tools Number of email accounts per BU 0.5 100% 0.5 FTE/Agency workers information supporting collaboration tools 0.5 85% 0.425 0.925 93% Telephones Number of handsets/extensions per business unit and their consumption 0.5 95% 0.475 Cost incurred for the usage of the extensions per BU 0.5 85% 0.425 0.9 90% Network connectivity LAN/WAN site information 0.5 85% 0.425 Cost of circuits and networks 0.5 85% 0.425 0.85 85% Mobility Number of Mobile Apps 0.5 25% 0.125 Service Cost 0.5 85% 0.425 0.55 55% 0 0% 0 FTE/Agency workers information per BU 0.5 75% 0.375 - 0 0% 0 Cost of software provisioned for PCs 0.5 75% 0.375 Infrastructure (DC & Connectivity) Servers associated applications and quantities 0.5 75% 0.375 Servers costs associates with their usage and services 0.5 75% 0.375 0.75 75% Infrastructure (Compute / Servers) Storage associated servers and quantities 0.5 75% 0.375 Storage costs associates with their usage and services 0.5 75% 0.375 0.75 75% Infrastructure (Storage & Back-Up) Data Center associated servers with applications 0.5 75% 0.375 Data Center costs associated with hosting servers and applications 0.5 75% 0.375 0.75 75% Databases, JAVA, .NET, tools Number of databases, associated applications and usage per BU 0.5 75% 0.375 FTE/Agency workers supporting databases per BU 0.5 100% 0.5 0.875 88% Integration Applications supported for integrations purposes and the corresponding BUs using those applications 0.5 100% 0.5 FTE/Agency numbers per BU for developing/supporting/maintaining the service 0.5 100% 0.5 1 100% Number of sites and locations 0 95% 0 FTE/Agency workers per BU for service provided 0.5 40% 0.2 - 0 0% 0 Non-Labor costs (Software / Infrastructure) 0.5 40% 0.2 NA 0 0% 0 FTE/Agency workers per BU for service provided 0.5 100% 0.5 NA 0 0% 0 Non-Labor costs (Software / Infrastructure) 0.5 85% 0.425 NA 0 0% 0 FTE/Agency workers per BU for service provided 0.5 100% 0.5 0 0% 0 Non-Labor costs 0.5 100% 0.5 NA 0 0% 0 FTE/Agency workers per BU for service provided 0.5 100% 0.5 0 0% 0 Non-Labor costs 0.5 100% 0.5 NA 0 0% 0 FTE/Agency workers per BU for service provided 0.5 100% 0.5 0 0% 0 Non-Labor costs 0.5 100% 0.5 NA 0 0% 0 FTE/Agency workers per BU for service provided 0.5 100% 0.5 0 0% 0 Non-Labor costs 0.5 100% 0.5 NA 0 0% 0 FTE/Agency workers per BU for service provided 0.5 100% 0.5 0 0% 0 Non-Labor costs 0.5 100% 0.5 Organizational Data Employee headcount by BU/Country/Region across the organization 0.5 100% 0.5 IT Organization/Services budgets 0.5 100% 0.5 1 100% Site Information Building data and BUs associated with it 1 100% 1 0 100% 0 1 100% 1 100% 5%1 1 1 100% 100% 100% 100% Category Quality Category Weight Overall Data Quality ADM 0.75 75% 81% 29% Cost Data 83% 11% 82% Total Weighted Score Data Item Quality 100% 0% 13% Projects New projects requested from GIS by the business 93% 42% Local Support On-site support for infrastructure and applications 40% 93% Service Name Service Cost Quantity Consumption Data Budgets $ 275 $ 125 $ 400 $ 50 Service Category $ - Staffing Enablement 0.4 40% 0.925 Application Delivery & Support Foundational Cost / Consumption Data Security Risk Management 1 100% Strategy, Architecture, & Governance Industry and innovation BI, Data warehouse HR, Business Resources Corporate Services $ 100 Data quality heat map Data quality assessment tool
  • 21. Step 4 Metrics & Reporting
  • 22. Page 21 Metrics & Reporting ► Purpose ► Necessary for effective management and customer satisfaction ► “What gets measured gets done” ► Emphasis on quality over quantity ► Metrics ► KPIs ► Key Performance Indicators that are measured and reported internally to manage services or processes ► SLAs ► Service Level Agreements, which are a formal commitment to a predetermined and agreed to level of service between IT and the business/customer ► Reporting ► Metrics - three levels: Business, executive, operational ► Usage - shows consumption of IT services by the business
  • 23. Page 22 Usage Reporting Example Customers need to understand their consumption and costs in order to manage them ► Highest benefit and maturity level is to produce monthly for each service via self-service on an automated platform ► Can be produced manually as an initial solution using Excel Automated Example – ITFM Tool Manual Example - Excel
  • 25. Page 24 Why implement chargeback? ► To understand the true costs of providing IT services ► To educate IT customers on the value of the IT services that are being provided ► As a tool to improve operating efficiencies and lower costs ► To enable customers to manage their own consumption of services and associated costs -
  • 26. Page 25 Benefits of Implementing Chargeback 1) Reduce spend/costs 2) More effective IT spending 3) Improve demand & expense forecasting for the IT organization and its customers 4) Key component of ITIL Financial Management
  • 27. Page 26 Chargeback Model Maturity Curve Used to determine where you are and where you want to be Implementation Time Long Maturity Short High 1 Overhead allocation 2 Flat fee 3 Consumption based 4 Incentive based 5 Service based 6 External pricing 7 Value based pricing Current State Target State
  • 28. Page 27 Chargeback Model Definitions and Features IT chargeback methodology Methodology description 1. Overhead allocation 2. Flat fee 4. Incentive based 5. Service based 6. External pricing 7. Value based pricing 3. Resource consumption based ► IT costs are allocated to LOBs as a corporate overhead cost based on a simple driver not directly related to resource consumption (e.g. revenue, asset balance, etc.) ► Fixed annual cost negotiated with BUs; normally based on a “crude” estimate of resource consumption ► IT charges are manipulated to drive specific behavior (e.g., lower charges to influence use of network or servers during off-peak times) ► IT service charges to BUs are based on consumption of specific activities; quality and availability of services are explicitly defined, service “choice” provided for key products ► IT service fees are based on market (external) prices; products offered are comparable to those available in the marketplace ► IT service fees are based on perceived value delivered to LOBs (e.g., business value created, customer satisfaction, timely delivery of new financial products) ► IT costs are allocated based on specific unit of resource consumed (e.g., number of dedicated servers, network ports, etc.) CostAwareness Cost Measurement Effort Costsand Complexity CostManagement Effort 0. No chargeback ► IT costs are not charged back = Low = Medium = HighKEY:
  • 29. Page 28 The Chargeback Journey Implementing chargeback is an evolutionary process vs. “big bang” Usage reporting Showback (Usage + $) Chargeback Time Maturity
  • 30. Page 29 Automation Frequency Chargeback Automation and Frequency To perform more frequent chargebacks increasing levels of automation are needed
  • 31. Page 30 Chargeback Data Requirements To chargeback on a unit cost basis, unit consumption and cost data is needed Datagranularity Type of model
  • 32. Page 31 Guiding Principles Consistency Effort Fairness Transparency ► Are IT chargeback methods aligned with cost allocation and profitability measurement used throughout the organization? ► How much effort (e.g., data collection, transformation, calculation, reconciliation, and billing) is appropriate and is it in keeping with the value provided? ► To what degree should chargeback be based on actual consumption versus an estimated allocation? ► What costs should be included/excluded? ► What insight should customers have into how IT manages IT— including which costs are fixed and which are variable? ► What behaviors, if any, should chargeback drive (e.g. reduced consumption, investment in new products, incentives to move users from old technologies, etc.)? Influence Chargeback guiding principles
  • 33. Page 32 Chargeback Models Not one size fits all, and that’s okay HighImplementation complexity Low High Businessbenefitsandtransparency Resource- based allocations Differentiated service levels and pricing 1. Overhead allocation 2. Flat fee 6. External pricing 7. Value based pricing 4. Incentive based 3. Resource consumption based 5. Service based Service pricing Resourced-Based Allocations distributes costs through allocations or simple consumption estimates Service Pricing measures specific consumption and drives behavior through tiered services and prices (e.g. incentives for off-peak usage) Differentiated Service Levels and Pricing reflects a more market-based approach to cost recovery High
  • 35. Page 34 Why automate? ► Improve unit service costing and benchmarking accuracy, leading to lower costs ► Increase transparency into consumption and costs ► Needed to provide monthly reporting and chargeback – manual models require large amounts of labor ► Provide self-service capabilities to customers, so that they can understand and regulate their consumption ► More efficient than manual processes
  • 36. Page 35 Tool selection ► You should first consider if you are ready for a tool. Some key points to keep in mind: ► Are services well defined? ► Are ITFM roles and processes defined and mature? ► Service consumption data ownership, availability, and quality are key requirements ► There are multiple tools available in the market, so you should evaluate them based on your specific requirements using well defined criteria and use cases ► You can use resources such as Gartner as a guide
  • 38. Page 37 Client ITFM case study overview This is one of many examples of the benefits of implementing ITFM processes ► Client objectives ► Create financial transparency for all products and services provided by IT infrastructure services ► Continue to reduce infrastructure support costs, optimize operations ► Achieve or exceed cost benchmarks in all elements of IT Infrastructure Services ► Derive benefits from the previously purchased ITFM tool ► Results ► Developed a comprehensive end state architecture and two year roadmap to success ► Identified $6M - $10M in initial savings ► Designed the chargeback model, roles, metrics, and processes to provide additional transparency to the business ► Developed an implementation plan to operationalize their ITFM tool
  • 39. Page 38 Peter Hidalgo, Jr ITFM Services Lead Senior Manager IT Transformation Advisory Services Ernst & Young LLP 5 Times Square New York, NY 10036-6530, United States of America Pete.Hidalgo@ey.com Mobile: 973-223-5616 Education West Point - USMA BS – Engineering Columbia University MBA Certification(s) PMP ITIL Financial Management ► Senior Manager with over 20 years of experience in I.T. Financial Management, Telecom and I.T. infrastructure, Cost Optimization, Program Management, and I.T. Shared Services Transformation. ► Deep industry experience in managing and optimizing I.T. costs. Previous responsibilities included serving as the Global I.T. Financial Manager for a Fortune 100 company, where he managed an annual operating budget of over $100 million. In that role he also developed and implemented an ITIL based service costing and chargeback process, resulting in improved client satisfaction and major, recurring cost savings. ► Currently serves as the I.T. Financial Management Service Leader within Ernst & Young’s IT Advisory practice Relevant experience ► Assisted a Fortune 50 global manufacturing client with redesigning their current IT allocation model and processes for over $1 billion in annual spend ► Advised a Fortune 50 pharmaceutical client with improving their IT financial management processes, cost transparency, data management, chargeback model redesign, service owner framework, and automation ► Advised and assisted a leading media and entertainment company to transform their IT operations into a shared services model encompassing 11 major service domains. Also assisted in the development of a data center strategy, a WAN architecture review, and a detailed IT service cost analysis, to include the development of a service catalog, and a chargeback model. ► Assisted in an IT infrastructure (voice, data, and data center) strategic assessment and financial analysis for a Fortune 500 corporation, which resulted in identifying the strategies to improve network and data center performance and availability, in addition to saving $32M - $53M over three years in IT operating expenses. ► Supported an IT Cost Optimization study for the premium spirits and wine supplier in the U.S., which addressed their telecom and infrastructure spend. Identified annual savings of 10% to 19%. ► Advised in the strategic assessment of the voice and data networks for a Fortune 500 high tech manufacturing firm, which resulted in a new technology direction (VOIP) and Identified over $9M in annual savings. ► Assisted in performing an IT Operations strategic assessment for a Fortune 100 manufacturing corporation, focusing on data center consolidation. Developed data center consolidation and disaster recovery strategies, in addition to Identifying over $5M in annual savings. ► Advised a leading medical device manufacturing company in the evaluation of their outsourced infrastructure service contracts, resulting in overall savings of $5M - $6M, or 35% - 45%. ► Assisted a Fortune 100 consumer staples company with the assessment of their wireless telecom services contracts, resulting in overall savings of $6M - $9M, or 45% - 55%.
  • 41. EY | Assurance | Tax | Transactions | Advisory About EY EY is a global leader in assurance, tax, transaction and advisory services. The insights and quality services we deliver help build trust and confidence in the capital markets and in economies the world over. We develop outstanding leaders who team to deliver on our promises to all of our stakeholders. In so doing, we play a critical role in building a better working world for our people, for our clients and for our communities. EY refers to the global organization, and may refer to one or more, of the member firms of Ernst & Young Global Limited, each of which is a separate legal entity. Ernst & Young Global Limited, a UK company limited by guarantee, does not provide services to clients. For more information about our organization, please visit ey.com. Ernst & Young LLP is a client-serving member firm of Ernst & Young Global Limited operating in the US. © 2016 Ernst & Young LLP. All Rights Reserved. BSC no. 1602-1728497 ED None This material has been prepared for general informational purposes only and is not intended to be relied upon as accounting, tax, or other professional advice. Please refer to your advisors for specific advice. ey.com