The Effect of Pandemic on People’s Happiness
•
0 likes•1 view

https://www.irjet.net/archives/V9/i6/IRJET-V9I6109.pdf

Recommended
Recommended
More Related Content
Similar to The Effect of Pandemic on People’s Happiness
Similar to The Effect of Pandemic on People’s Happiness (20)
More from IRJET Journal
More from IRJET Journal (20)
Recently uploaded
Recently uploaded (20)
The Effect of Pandemic on People’s Happiness
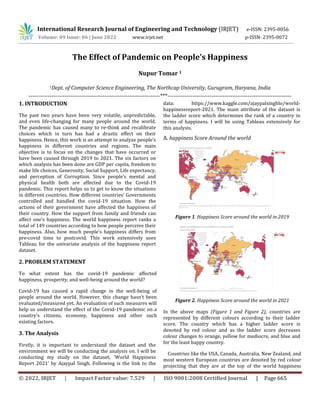
- 1. International Research Journal of Engineering and Technology (IRJET) e-ISSN: 2395-0056 Volume: 09 Issue: 06 | June 2022 www.irjet.net p-ISSN: 2395-0072 © 2022, IRJET | Impact Factor value: 7.529 | ISO 9001:2008 Certified Journal | Page 665 The Effect of Pandemic on People’s Happiness Nupur Tomar 1 1Dept. of Computer Science Engineering, The Northcap University, Gurugram, Haryana, India ---------------------------------------------------------------------***----------------------------------------------------------------- 1. INTRODUCTION The past two years have been very volatile, unpredictable, and even life-changing for many people around the world. The pandemic has caused many to re-think and recalibrate choices which in turn has had a drastic effect on their happiness. Hence, this work is an attempt to analyze people’s happiness in different countries and regions. The main objective is to focus on the changes that have occurred or have been caused through 2019 to 2021. The six factors on which analysis has been done are GDP per capita, freedom to make life choices, Generosity, Social Support, Life expectancy, and perception of Corruption. Since people’s mental and physical health both are affected due to the Covid-19 pandemic. This report helps us to get to know the situations in different countries. How different countries’ Governments controlled and handled the covid-19 situation. How the actions of their government have affected the happiness of their country. How the support from family and friends can affect one’s happiness. The world happiness report ranks a total of 149 countries according to how people perceive their happiness. Also, how much people’s happiness differs from pre-covid time to postcovid. This work extensively uses Tableau for the univariate analysis of the happiness report dataset. 2. PROBLEM STATEMENT To what extent has the covid-19 pandemic affected happiness, prosperity, and well-being around the world? Covid-19 has caused a rapid change in the well-being of people around the world. However, this change hasn’t been evaluated/measured yet. An evaluation of such measures will help us understand the effect of the Covid-19 pandemic on a country’s citizens, economy, happiness and other such existing factors. 3. The Analysis Firstly, it is important to understand the dataset and the environment we will be conducting the analysis on. I will be conducting my study on the dataset, ‘World Happiness Report 2021’ by Ajaypal Singh. Following is the link to the data: https://www.kaggle.com/ajaypalsinghlo/world- happinessreport-2021. The main attribute of the dataset is the ladder score which determines the rank of a country in terms of happiness. I will be using Tableau extensively for this analysis. A. happiness Score Around the world Figure 1. Happiness Score around the world in 2019 Figure 2. Happiness Score around the world in 2021 In the above maps (Figure 1 and Figure 2), countries are represented by different colours according to their ladder score. The country which has a higher ladder score is denoted by red colour and as the ladder score decreases colour changes to orange, yellow for mediocre, and blue and for the least happy country. Countries like the USA, Canada, Australia, New Zealand, and most western European countries are denoted by red colour projecting that they are at the top of the world happiness
- 2. International Research Journal of Engineering and Technology (IRJET) e-ISSN: 2395-0056 Volume: 09 Issue: 06 | June 2022 www.irjet.net p-ISSN: 2395-0072 © 2022, IRJET | Impact Factor value: 7.529 | ISO 9001:2008 Certified Journal | Page 666 chart. Russia and China are in the middle, and Sub-Saharan countries and India abide at the bottom of the chart being the least happy countries. Afghanistan is the last country in the world happiness report being the least happy country. In this graph (Figure 3), the red area graph shows the ladder score of different countries for the year 2019 i.e., before covid, and the green area graph shows for the year 2021 i.e., after covid. With the above analysis, the top 10 happiest countries around the globe are given in the below table. The countries mentioned below are mostly western European countries. Table 1. Top 10 countries ranked by most happiest to least We can clearly see in the table above that the country with the highest happiness index score is Austria, followed by Denmark, Finland and other European countries. B. Freedom to make life choices Another factor that affects the world’s happiness is “Freedom to make life choices”. The above graph shows the score for freedom to make life choices for different countries. An important observation that I made through this graph is that the countries with high freedom to make life choices are mostly western European countries denoted by grey bars and with the least freedom to make life choices are mostly sub-Saharan countries denoted by brown bars. Figure 4. Freedom To make life choices Below mentioned are the top 10 countries that have more freedom to make life choices. We can observe that the countries of western Europe are more in number than any other. Hence, in this, we can conclude freedom to make life choices on our own have a large effect on people’s happiness. Table 2. Top 10 countries ranked by most freedom to make choices to least C. GDP vs Ladder Score Another factor that affects world happiness most is GDP per Capital that we can observe in the following graphs of years 2019 and 2021. The below scatter plots (Figure 5 & 6) show the relation between the ladder score of 2019 and the score of GDP per capita of the same year. Figure 3. Which countries have the highest ladder score
- 3. International Research Journal of Engineering and Technology (IRJET) e-ISSN: 2395-0056 Volume: 09 Issue: 06 | June 2022 www.irjet.net p-ISSN: 2395-0072 © 2022, IRJET | Impact Factor value: 7.529 | ISO 9001:2008 Certified Journal | Page 667 Figure 5 & 6. GDP vs Ladder Score for 2019 and 2021 This scatter plot shows the relation between the ladder score of 2021 and the score of GDP per capita of the same year. A positive correlation is observed between the two factors and countries with higher GDP per capita tend to yield a higher ladder score. For instance, Western European countries are observed to have a GDP higher than 1.4, which when realised on the x-axis gives a ladder score higher than 6 on the happiness index denoted by grey circles, and GDP lesser than 0.6 gives a ladder score less than 5 for Sub-Saharan countries denoted by brown circles. D. Support from family members and friends The Next factor that comes is the support from the family members and friends. We all have seen in past two to three year, during covid that how important is the support of our families and friend. In the time of crises, only family and friends stand with you and for you. In the following graph (Figure 7), I have done the comparison between the years 2019 and 2021 among different countries that how much the support from family and friends effects the happiness of people. The left chart shows representation for 2021 year and the right one shows for 2019. We can observe that many countries score off social support factor increased during the pandemic. Both the charts depicting the social support score in decreasing manner and the colour sequence depicts the happiness index. Red and orange colour are for the high happiness score and purple and blue are for low happiness score. Figure 7. Support from family members vs Happiness for 2019 and 2021
- 4. International Research Journal of Engineering and Technology (IRJET) e-ISSN: 2395-0056 Volume: 09 Issue: 06 | June 2022 www.irjet.net p-ISSN: 2395-0072 © 2022, IRJET | Impact Factor value: 7.529 | ISO 9001:2008 Certified Journal | Page 668 E. Life expectancy and ladder score Another dependent variable is the life expectancy of people. How the life expectancy effects the happiness of people as during pandemic a lot of people suffers between the life and death situations which makes it am important factor to consider when analyzing people’s happiness. For the year 2021 visual (Figure 8), I used the bar chart for the life expectancy score and line chart for pointing the happiness score for each country. We can observe that grey bars which is for western European countries have high life expectancy and also ranks high in happiness index. Sub- Saharan countries which is denoted by brown collared bars are low on life expectancy and also on happiness index. This concludes that the life expectancy is an important point to considering people’s happiness. F. The Perception of corruption Figure 8. Life Expectancy vs Happiness for 2021 In the following scatter plot (Figure 9) same is visualized for the year 2019. Countries are on top of the happiness index when they have high life expectancy and vice versa. Figure 9. Life Expectancy vs Happiness for 2019 This concludes that the life expectancy is an important factor to consider-in people’s happiness. Below are the top 10 countries which have high life expectancy score for birth years 2019 and 2021. Table 3. Top 10 countries that have high Life Expectancy Another factor that comes into consideration is the perception of corruption. People tend to abuse the power that they behold for their own gain which leads to corruption. During pandemic, many government officials also tend to be corrupted. A general trend that was visible in the figure below (figure 10) was that most countries had higher levels of perceptions of corruption in 2021 as compared to 2019. However, there was a particular exception/outlier in this trend: Rwanda. In 2019 Rwanda had a perception of corruption score of 0.411. Where as in 2021 this score had decreased to a mere 0.1670. Figure 10. Corruption vs Happiness Below (Table 4) is a list of the top 10 countries with high corruption rates. We can see here that Central and Eastern European countries such as Bosnia and Herzego, Bulgaria, Croatia etc. have very high perceptions of corruption.
- 5. International Research Journal of Engineering and Technology (IRJET) e-ISSN: 2395-0056 Volume: 09 Issue: 06 | June 2022 www.irjet.net p-ISSN: 2395-0072 © 2022, IRJET | Impact Factor value: 7.529 | ISO 9001:2008 Certified Journal | Page 669 Table 4. Top 10 countries that have high Corruption G. The Perception of corruption An important part of this study was finding the relation between Generosity and Rank of ladder score. As you can see in figure 11 below there is a negative correlation between these 2 variables. It was observed that countries with lower generosity scores had a higher rank among the ladder score. Moreover, most countries with higher generosity scores also had a higher rank among the ladder score. However, there were exceptions here again. For instance, Indonesia had the highest generosity score at 0.5420 also had a rank on the ladder score of 6. Figure 11. Generosity vs Happiness for 2021 As compared to 2021, in 2019 (Figure 12) the data had been calculated using a different metric, when compared to 2021. On one hand where ranks were present in 2021, 2019 had a ladder score. After a thorough study, it was observed that Generosity vs Ladder Score also had a negative correlation. Where generosity was indirectly proportional to the ladder score. A country with lower generosity had a higher ladder score. A higher ladder score means a higher rank on the happiness index. All in all, it can be said that both in 2019 and 2021 low generosity resulted in a higher rank. Generosity and rank are indirectly proportional. At the end, an additional factor named dystopia+residual score, the term dystopia is an imaginary country with least happy people residing in it. Country where the economy is less, life expectancy is not good, have high corruption doesn’t have much freedom such as Afghanistan or other Sub- Saharan countries help us to get to know the countries which are residing at the bottom of the happiness index. As we can observe in figure 13, at the top most of the countries are from sub-Saharan region which depicts that the people are not happy living there. Figure 12. Generosity vs Happiness for 2019 H. Dystopia score vs happiness
- 6. International Research Journal of Engineering and Technology (IRJET) e-ISSN: 2395-0056 Volume: 09 Issue: 06 | June 2022 www.irjet.net p-ISSN: 2395-0072 © 2022, IRJET | Impact Factor value: 7.529 | ISO 9001:2008 Certified Journal | Page 670 Figure 13. Dystopia for countries 4. CONCLUSION After a thorough study and measures of the dataset, I found out that six key factors play a significant role in shaping the happiness of the country. The following factors are: 1. Life Expectancy 2. Social Support 3. Perception of Corruption 4. Freedom to make life choices 5. Generosity All in all, the increase in Life Expectancy, Social support, freedom to make life choices and GDP per capita, makes the people living there much happier. The increase in the Perception of corruption decreases the people’s happiness residing in that country. Generosity does not play any significant role with the happiness of people in the country. 5. TABLEAU PUBLIC PROFILE https://public.tableau.com/app/profile/nupur4841/viz/ worldhappinessreport_16381044192110/Sheet2 6. REFRENCES [1] Singh, Ajaypal. “World Happiness Report 2021.” Kaggle, Kaggle, 22 Mar. 2021, https://www.kaggle.com/ ajaypalsinghlo/world-happiness-report-2021. [2] https://byjus.com/free-ias-prep/world-happiness- report/#:~:text=India%20has%20ranked%20139%20in,ran k%20in%202020%20was%20144. [3] https://worldhappiness.report/ [4] https://www.nationalheraldindia.com/national/world- happiness-report-2021-india-ranks-139-out-of-149- pakistan-bangladesh-china-happier-finland-happiest [5] https://www.drishtiias.com/daily-updates/daily-news- analysis/world-happiness-report-2021 [6] https://currentaffairs.adda247.com/india-ranks-139th- in-world-happiness-report-2021/ [7] https://en.wikipedia.org/wiki/World_Happiness_Report [8] https://www.firstpost.com/india/india-ranked-139-out- of-149-countries-in-uns-world-happiness-report-2021- 9462241.html [9] https://www.deccanherald.com/national/world- happiness-report-2021-india-ranks-136-out-of-149-finland- tops-964108.html