SlideShare a Scribd company logo
1 of 4
Africa: Growth is on the horizon but 
where should you look? 
At a glance… 
CEOs are increasingly recognising the long-term 
untapped potential of Sub-Saharan Africa 
(SSA). 
Figure 1 below shows that SSA’s population is 
projected to grow faster than in any other 
region in the world. As a result, by 2040, the 
African continent is projected to have the 
biggest labour force in the world and could have 
faster economic growth than any other region. 
Cities as a gateway to newmarkets 
So where should businesses focus if they want 
to expand their activities in SSA? Traditionally 
large cities have been the main entry points for 
companies trying to establish a presence in new 
markets. 
Most largeWestern corporations are already 
active in at least one of the three largest cities of 
SSA: Kinshasa, Johannesburg and Lagos (the 
‘Top 3’). However, we think that the real 
opportunity lies in the Next 10 largest cities of 
SSA (see Figure 4). Our analysis of United 
Nations projections shows that the ‘Next 10’ are 
projected to add around 34 million people to 
their populations by 2030. 
More people, bigger business 
opportunities 
One of the key factors that drive economic 
growth is the number of people of working age. 
We therefore expect a bigger and younger urban 
population to be associated with strong GDP 
growth. Our analysis shows that, by 2030, the 
‘Next 10’ SSA cities have the potential to triple 
their combined GDP, rising by around $140 billion 
(in 2012 prices), whichwould be roughly 
equivalent to the annual output ofHungary. This 
is a comparatively conservative estimate aswe’ve 
assumed no real exchange rate appreciation 
despite relatively strong projected growth in these 
SSA economies. 
Three big hurdles need to be 
addressed 
However policymakers in SSAface three hurdles 
to overcome if this growth potential is to be 
realised. These are: 
• Low quality ‘hard’ infrastructure like roads 
and railways; 
• Inadequate ‘soft’ infrastructure like schools 
and universities; and 
• Growing pains arising fromthe inability of 
political, legal and regulatory institutions to 
deal with bigger andmore complicated 
economies. 
A newbeginning for the Indian economy? 
India is also an example of an emerging 
economy that has been experiencing growing 
pains in recent years. The new government’s 
first budget in July included some measures to 
address these structural and fiscal weaknesses. 
Even though the budget wasn’t a game changer 
it was a move in the right direction. There is 
more to do in the longer term but, for now, the 
key challenge for policymakers will be to 
implement the recently announced reforms in 
order to re-establish credibility with local and 
international businesses. 
Fig 1: Population growth in different regions of the world 
Sub-Saharan Africa 
Oceania 
Latin America and the Caribbean 
Northern America 
Asia 
Europe 
Visit our blog for periodic updates at: 
pwc.blogs.com/economics_in_business 
Global EconomyWatch 
August 2014 
-0.5% 0.0% 0.5% 1.0% 1.5% 2.0% 2.5% 3.0% 
Total population CAGR 2014-2030 (%) 
Source: PwC analysis of UN data. Note continents have been defined by the UN
Economic update: Contrasting E7 and G7 
investment trends 
However, in the G7, households, businesses 
(and later governments) reacted by cutting 
down on their investment expenditure and 
using the proceeds to pay down their high 
levels of debt. 
…but is staging amodest rebound 
After years of private and public balance 
sheet restructuring, our analysis shows that 
there has been somemodest pick-up in 
investment in the G7 in recent years. 
Sustaining this will be key to keeping the 
recovery going. At the same time, excluding 
China, Figure 2 shows that E7 investment 
growth has largely stalled in recent years as 
some emerging economies have run into 
headwinds since 2011. 
For G7 businesses, stronger demand growth 
and rising capacity utilisation levels mean 
that investment will need to continue to rise, 
not just in machines and buildings but also in 
people and skills, which are key to corporate 
success in increasingly services-driven 
economies. 
G7 investmentwas hit the hardest… 
In the aftermath of the global financial crisis, 
investment levels among the advanced and 
emerging economies fell. Figure 2 shows that 
investment by households, businesses and 
governments in the G7 dropped by around 
15% in real terms between 2007 and 2009 
and still remain below pre-crisis levels. This 
contrasts with the experience of the E7 (the 
seven largest emerging economies), which 
also suffered a temporary drop in investment 
activity, but rebounded strongly soon after 
the peak of the crisis in late 2008. 
In part these diverging trends can be 
explained by the policy response. In the E7, 
most governments adopted stimulus 
measures to counter the slowdown. They 
could do this because, at the time, they had 
relative low public debt to GDP ratios. In 
China, for example, the government 
measures that were announcedwere in excess 
of half a trillion US dollars, centred around 
large scale infrastructure projects. 
Fig 2: Real investment levels in the E7 andG7 
180 
170 
160 
150 
140 
130 
120 
110 
100 
90 
80 
2007 
Q1 
2008 
Q1 
2009 
Q1 
2010 
Q1 
2011 
Q1 
2012 
Q1 
2013 
Q1 
2014 
Q1 
GDP weighted real investment level 
(2007 Q1: 100) 
E7 
E7 
(excluding China) 
G7 
Will theModi Budget jump start 
India’s economy? 
Arun Jaitley, India’s FinanceMinister, 
presented theModi government’s first 
budget in July. In his speech, he outlined 
his roadmap for the economy, which 
includedmeasures to improve 
infrastructure, reform the tax system and 
allowmore foreign investment in the 
defence and insurance sectors. 
However, he steered away from 
announcing any large-scale changes to the 
economy. This budget, he said, was only 
the beginning of a journey towards 
achieving a target 7%-8%rate of GDP 
growth within the next 3-4 years. 
State of the economy: low growth, 
high inflation 
The new government, which came to power 
following a landslide victory in the 
elections held inMay, inherited a slowing 
economy afflicted by high inflation. 
Specifically, in 2013, GDP grew by 4.7% 
while the inflation rate (for wholesale 
prices) was around 6%. 
The Annual Economic Survey (AES), which 
was released by the government a day 
before the budget, presented a mixed but 
improving picture. Specifically, according 
to the AES, the economy was projected to 
expand by around 5.4%-5.9%in the 2014- 
15 fiscal year (FY), which is a small 
improvement over previous years and 
similar to our projections. 
While we think the GDP growth target for 
this year is achievable, this is a long way off 
India’s target growth rate of closer to 7%- 
8% per annum. In our main economic 
projections, we expect GDP growth to be 
around 6.5% in themedium-term unless 
more fundamental reforms are pushed 
through in future years. 
Source: PwC analysis using National Accounts 
Similarly, government projections show 
that the current account deficit is expected 
to stabilise at around 2% of GDP, as 
compared to 4.2% in FY 2011-12. 
Still a long way to go 
So what were the key measures included in 
the budget? Here are a few that are 
relevant for business: 
• Liberalising the defence and insurance 
sectors by raising foreign investment 
caps to 49%; 
• Plans to develop roads, railways and 
improve infrastructure in cities in 
partnership with private sector players; 
and 
• Tax reforms to hasten a uniform Goods 
and Services Tax (GST) regime across 
the country. 
Realistic but not bold 
The new government’smaiden budget is 
realistic, but lacks the boldmeasures that 
some commentators expected after the 
landslide election victory.We think this is 
because the government wants to focus on 
implementing and consolidating these 
reforms before introducing any other 
major changes. 
However, we also think that the announced 
measures are insufficient to push GDP 
growth rates to the target rate of 7%-8% 
within the next 3-4 years as a lotmore 
needs to be done to improve manufacturing 
productivity and output. 
Fig 3: Fiscal and current account balances 
(as a proportion of GDP) 
2.8% 2.8% 
4.2% 
4.7% 
1.7% 
2.1% 
6.5% 
4.8% 
5.7% 
4.9% 4.5% 
4.1% 
7.0% 
6.0% 
5.0% 
4.0% 
3.0% 
2.0% 
1.0% 
0.0% 
2009-10 2010-11 2011-12 2012-13 2013-14 2014-15 
Current account deficit and fiscal 
deficits, % of GDP 
Current Account Balance, % of GDP Fiscal deficit, % of GDP 
Source: Annual Economic Survey 2014, Government 
of India 
Similarly, inflation remained above the government’s 
comfort zone due to higher food prices. However, we expect 
the inflation rate to stabilise in the region of around 5-6% 
this year on the back of monetary tightening at the beginning 
of 2014. 
The twin deficits 
As we pointed out in theMay edition of the Global Economy 
Watch, quick and decisive action on structural reforms are 
key factors that could help boost investment levels in India 
and increase its medium termgrowth prospects.However, 
this is challenging as India faces persistent high fiscal and 
current account deficits (see Figure 3), which in turn reduces 
the government’s policymaking flexibility. 
However, the new government has already started to put in 
placemeasures to bring down the fiscal deficit from 4.5% of 
GDP in FY2013-14 to 4.1% in FY2014-15 and further down 
to 3.6%in FY2015-16, as show in Figure 3. 
For a more detailed discussion on the 
Indian budget please read our 
Economics in Business blog post: Can 
Modi’s budget boost India’s economy?
Which cities hold the key to unleashing 
growth in Sub-Saharan Africa? 
• Constant real exchange rates, which 
could also be a relatively 
conservative assumption given that 
real exchange rates might be 
expected to rise in the long run in 
dollar terms for emerging economies 
with relatively rapid productivity 
growth. 
Key hurdles to be overcome 
to realise growth potential 
However, we see three key hurdles 
which could derail the pace at which the 
‘Next 10’ grow. These are issues that 
most SSA countries have been trying to 
tackle for many decades with limited 
success: 
• Low quality of ‘hard’ 
infrastructure like highways, 
airports and trains, which increases 
the cost of doing business, eats away 
at business profits and discourages 
investment. Figure 6 shows that 
most SSA economies have sub-standard 
roads compared, for 
example, to countries in the Middle 
East and North African (MENA) 
region. 
• Inadequate ‘soft’ infrastructure 
like schools and universities, which 
could lead to a persistent skills gap 
that hampers long-term business 
growth. Figure 6 shows that this is a 
real risk in countries like Burkina 
Faso,Mali and Ethiopia where 
literacy rates remain low. 
• Growing pains stemming from the 
inability of regulators and 
policymakers to manage effectively a 
larger and more complex economic 
system as growth proceeds. These 
problems could, for example, 
manifest themselves in the form of 
credit or property bubbles 
developing as a result of rapid 
economic growth, or a failure to 
tackle issues relating to corruption 
and excessive bureaucracy that deter 
international investment. 
The challenge that policymakers are 
faced with is to convert Africa’s 
demographic dividend into economic 
reality by overcoming these hurdles, but 
history suggests this will not be a quick 
or easy process. Potential investors 
should therefore form their own plans to 
mitigate these problems (e.g. by 
supporting infrastructure and skills 
development programmes). 
*World Urbanisation Prospects: The 
2014 Revision 
Sub-Saharan Africa is moving 
on to the C-suite’s agenda 
As labour costs in Asia start to increase and 
pressure remains to keep prices competitive, 
CEOs are increasingly recognising the 
untapped potential of the Sub-Saharan 
African (SSA) countries. 
This is mainly driven by Africa’s 
unparalleled demographic edge compared to 
other parts of the world: Africa is the world’s 
youngest continent and is expected to have 
the biggest labour force in the world by 
2040. So where should businesses focus 
their attention within SSA? 
Cities are hubs of commerce, 
investment and production 
Cities are the typical entry points for 
businesses trying to expand in new overseas 
markets. This is because they enable closer 
interaction with customers in a relatively 
small geographic space which in turn helps 
contain distribution costs. 
MostWestern companies already have some 
presence in at least one of SSA’s ‘Top 3’ 
populous cities: Lagos, Kinshasa and 
Johannesburg (see Figure 4). However, we 
think the real opportunity lies in the ‘Next 
10’ large cities in SSA, the populations of 
which are projected to almost double in size 
by 2030, growing by around 32 million 
people. In fact, the latest United Nations 
projections* show that, by 2030, two out of 
the ‘Next 10’ cities (Dar es Salaamand 
Luanda) could have bigger populations than 
London has now. 
By 2030, the ‘Next 10’ cities 
are projected to triple their 
economic size 
Urban population growth is expected to lead 
to more economic activity. Figure 5 shows 
that, on average, the ‘Next 10’ cities are 
expected to almost double their population 
and triple their economic output by 2030. 
Specifically, we estimate that economic 
activity in the ‘Next 10’ cities could grow by 
around $140 billion dollars by 2030 (at 
constant 2012 dollars). This is roughly 
equivalent to the current annual output of 
Bangladesh. These estimates are based on 
the following key assumptions: 
• National GDP growth rates follow those 
projected by the IMF in its latestWorld 
Economic Outlook report (which do not 
take into account the latest Nigerian 
GDP rebasing); 
• City GDP per capita grows in line with 
the rest of the country (which may be a 
conservative assumption); 
Fig 4: Population trends in the ‘Top 3’ and ‘Next 10’ cities 
in Sub-Saharan Africa (SSA) 
- 5 10 15 20 25 
Ibadan (Nigeria) 
Addis Ababa (Ethiopia) 
Ouagadougou (Burkina Faso) 
Dakar (Senegal) 
Kano (Nigeria) 
Nairobi (Kenya) 
Abidjan (Côte d'Ivoire) 
Khartoum (Sudan) 
Luanda (Angola) 
Dar es Salaam (Tanzania) 
Johannesburg (South Africa) 
Kinshasa (Congo) 
Lagos (Nigeria) 
Urban area population (millions) 
2014e 2030p 
‘Next 10’ cities 
‘Top 3’ cities 
Source: UN Urbanisation Prospects 2014 revision 
Fig 5: Bigger cities lead to bigger economic opportunities… 
Ouagadougou 
(Burkina Faso) 
Addis Ababa 
(Ethiopia) 
Lagos (Nigeria) 
Kinshasa 
(Congo) 
Abidjan (Côte 
d'Ivoire) 
Kano (Nigeria) 
Johannesburg 
(South Africa) 
Dar es 
Salaam 
(Tanzania) 
Nairobi (Kenya) 
Luanda 
(Angola) 
Ibadan 
(Nigeria) 
Khartoum 
(Sudan) 
Dakar 
(Senegal) 
400% 
350% 
300% 
250% 
200% 
150% 
100% 
50% 
20% 40% 60% 80% 100% 120% 140% 
% change in city GDP at 2012 US$ (2014-2030) 
% change in city population (2014-2030) 
Note that size of bubble reflects estimated city GDP as at 2030 
Source: PwC analysis 
Fig 6: But some SSA countries face significant gaps in their 
‘hard’ and ‘soft’ infrastructure compared to theMENA 
- 20 40 60 80 100 
Congo 
Kenya 
Cote d'Ivoire 
Angola 
Ethiopia 
Tanzania 
Nigeria 
South Africa 
Burkina Faso 
Mali 
Senegal 
Sudan 
MENA 
Roads paved (% of total roads) 
Source: World Bank 
- 50 100 
Burkina Faso 
Mali 
Ethiopia 
Cote d'Ivoire 
Nigeria 
Senegal 
Congo 
Sudan 
Tanzania 
Angola 
Kenya 
MENA 
South Africa 
Literacy rate (% of people aged 
15 and above)
Projections: August 2014 
Real Share of 2012 world GDP GDP growth Inflation 
PPP* MER* 2013 2014p 2015p 2016-2020p 2013 2014p 2015p 2016-2020p 
Global (market exchange rates) 1 00% 2.5 2.8 3.2 3.2 4.8 5.1 5.6 4.7 
Global (PPP rates) 1 00% 3.0 3.3 3.7 3.6 
United States 1 9.5% 22.5% 2.2 2.1 3.1 2.4 1 .5 1 .8 2.2 1 .9 
China 1 4.7% 1 1 .4% 7 .6 7 .4 7 .3 7 .0 2.6 2.3 2.5 3.4 
Japan 5.5% 8.3% 1 .5 1 .5 1 .5 1 .2 0.4 2.1 2.1 1 .5 
United Kingdom 2.8% 3.4% 1 .7 3.0 2.6 2.4 2.6 1 .8 1 .9 2.0 
Eurozone 1 3.5% 1 6.9% -0.5 1 .1 1 .5 1 .5 1 .4 0.8 1 .1 1 .5 
France 2.7% 3.6% 0.1 1 .0 1 .1 1 .7 1 .0 0.7 1 .0 1 .5 
Germany 3.8% 4.7% 0.5 2.0 1 .9 1 .3 1 .6 1 .2 1 .4 1 .7 
Greece 0.3% 0.3% -3.9 0.4 1 .8 3.0 -0.9 -0.8 -0.1 1 .3 
Ireland 0.2% 0.3% 0.2 3.1 2.9 2.5 0.5 0.4 1 .4 1 .5 
Italy 2.2% 2.8% -1 .8 0.1 0.9 1 .0 1 .3 0.7 1 .0 1 .4 
Netherlands 0.8% 1 .1% -0.8 0.2 1 .5 2.0 2.6 0.8 1 .2 1 .4 
Portugal 0.3% 0.3% -1 .0 0.7 1 .7 1 .8 0.4 0.4 0.9 1 .5 
Spain 1 .7% 1 .8% -1 .2 1 .1 1 .5 1 .5 1 .5 0.3 0.9 1 .0 
Poland 1 .0% 0.7% 1 .6 3.1 3.3 3.5 1 .2 0.7 2.2 2.5 
Russia 3.0% 2.8% 1 .2 0.5 1 .2 2.5 6.8 6.4 5.5 5.0 
Turkey 1 .3% 1 .1% 4.0 2.6 3.8 4.5 7 .5 8.3 6.8 4.8 
Australia 1 .2% 2.1% 2.4 3.3 2.7 3.1 2.2 2.6 2.6 2.7 
India 5.7% 2.6% 4.6 5.3 6.6 6.5 6.3 5.7 6.0 6.0 
Indonesia 1 .4% 1 .2% 5.8 5.3 5.8 6.3 6.4 6.1 5.8 5.1 
South Korea 1 .9% 1 .6% 3.0 3.5 3.7 3.8 1 .3 2.3 3.0 2.9 
Argentina 0.9% 0.7% 5.0 0.7 1 .8 3.3 1 0.6 1 1 .9 1 3.3 9.7 
Brazil 2.8% 3.1% 2.3 1 .3 2.0 4.0 6.2 6.6 5.7 4.8 
Canada 1 .8% 2.5% 2.0 2.1 2.5 2.2 1 .0 1 .8 1 .8 2.1 
Mexico 2.2% 1 .6% 1 .3 2.6 3.7 3.6 3.8 3.9 3.7 3.6 
South Africa 0.7% 0.5% 1 .9 1 .7 2.5 3.8 5.8 6.1 5.5 4.8 
Nigeria 0.5% 0.4% 5.5 6.0 5.9 5.7 8.5 8.5 8.6 7 .3 
Saudi Arabia 1 .1% 1 .0% 4.0 4.3 4.4 4.3 3.5 3.1 3.5 4.0 
Sources: PwC analysis, National statistical authorities, Thomson Datastream and IMF. All inflation indicators relate to the Consumer Price Index (CPI), with the 
exception of the Indian indicator which refers to the Wholesale Price Index (WPI). Argentinian inflation figures are based on the old price index which measure CPI in 
Greater Buenos Aires. A new index the ‘National and urban Consumer Price Index’ (NuCPI) has now been released by INDEC the Argentinian statistical agency. We 
will monitor this new price index and will base our projection on this once we have several months of data available. Our Nigeria GDP projections relate to the new 
rebased GDP figures but are subject to high margins of error. Also note that the tables above form our main scenario projections and are therefore subject to 
considerable uncertainties. We recommend that our clients look at a range of alternative scenarios. 
Interest rate outlook of major economies 
Current rate (Last change) Expectation Next meeting 
Federal Reserve 0-0.25% (December 2008) QE tapering to continue during 2014 16-17 September 
European Central Bank 0.15% (June2014) On hold following easing in June 7 August 
Bank of England 0.5% (March 2009) Rate to rise gradually from late 2014 or early 2015 7 August 
Richard Boxshall 
T: +44 (0) 20 7213 2079 
E: richard.boxshall@uk.pwc.com 
William Zimmern 
T: +44 (0) 20 7212 2750 
E: william.zimmern@uk.pwc.com 
Barret Kupelian 
T: + 44 (0) 20 7213 1579 
E: barret.g.kupelian@uk.pwc.com 
PwC’s Global Consumer Index 
Global consumer spending growth falls 
slightly to 3.5% this month, but remaining 
above long-term trends. 
Recent data suggests that industrial 
production in key economies such as China 
and the US have improved. Business 
confidence has increased slightly, which 
should contribute to further consumption 
growth in the coming months. 
4.0% 
3.5% 
3.0% 
2.5% 
2.0% 
1.5% 
1.0% 
0.5% 
0.0% 
3.5% 
Aug-13 
Sep-13 
Oct-13 
Nov-13 
Dec-13 
Jan-14 
Feb-14 
Mar-14 
Apr-14 
May-14 
Jun-14 
Jul-14 
YoY growth 
Long-term growth 
The GCI is a monthly updated index providing an early steer on consumer spending and 
growth prospects in the world’s 20 largest economies. For more information, please visit 
www.pwc.co.uk/globalconsumerindex 
We help you understand how big economic, demographic, social, and environmental changes affect your organisation by setting out scenarios that 
identify growth opportunities and risks on a global, regional, national and local level.We help make strategic and tactical operational, pricing and 
investment decisions to support business value creation.We work together with you to achieve sustainable growth. 
This publication has been prepared for general guidance on matters of interest only, and does not constitute professional advice. You should not act upon the information contained in this 
publication without obtaining specific professional advice. No representation or warranty (express or implied) is given as to the accuracy or completeness of the information contained in this 
publication, and, to the extent permitted by law, PricewaterhouseCoopers LLP, its members, employees and agents do not accept or assume any liability, responsibility or duty of care for any 
consequences of you or anyone else acting, or refraining to act, in reliance on the information contained in this publication or for any decision based on it. 
© 2014 PricewaterhouseCoopers LLP. All rights reserved. In this document, “PwC” refers to the UK member firm, and may sometimes refer to the PwC network. Each member firm is a separate 
legal entity. Please see www.pwc.com/structure for further details. 
140123-203416-BK-OS

More Related Content

What's hot

Economics Project
Economics ProjectEconomics Project
Economics Projectguest2c5fd0
 
5th RBI Monetary Policy
5th RBI Monetary Policy5th RBI Monetary Policy
5th RBI Monetary PolicyBFSICM
 
Indian economic suvey 2016
Indian economic suvey 2016 Indian economic suvey 2016
Indian economic suvey 2016 CA Dhruv Chhabra
 
International Newsletter Kienbaum Japan
International Newsletter Kienbaum JapanInternational Newsletter Kienbaum Japan
International Newsletter Kienbaum JapanDavid Liendgens
 
Key Features of Budget 2015 -16
Key Features of Budget 2015 -16Key Features of Budget 2015 -16
Key Features of Budget 2015 -16BFSICM
 
Project report on gdp and inflation
Project report on gdp and inflationProject report on gdp and inflation
Project report on gdp and inflationharryz18
 
ECONOMY MATTERS: Corporate Profitability and Investment Trends
ECONOMY MATTERS: Corporate Profitability and Investment Trends ECONOMY MATTERS: Corporate Profitability and Investment Trends
ECONOMY MATTERS: Corporate Profitability and Investment Trends Confederation of Indian Industry
 
Indicus Ma Foi Randstad Employment Trends Survey - Wave 1 - 2011
Indicus Ma Foi Randstad Employment Trends Survey - Wave 1 - 2011Indicus Ma Foi Randstad Employment Trends Survey - Wave 1 - 2011
Indicus Ma Foi Randstad Employment Trends Survey - Wave 1 - 2011Indicus Analytics Private Limited
 
CII - 85th Business Outlook Survey October- December 2013
CII - 85th Business Outlook Survey October- December 2013CII - 85th Business Outlook Survey October- December 2013
CII - 85th Business Outlook Survey October- December 2013BFSICM
 
Weekly media update 06 12_2021
Weekly media update 06 12_2021Weekly media update 06 12_2021
Weekly media update 06 12_2021BalmerLawrie
 
WHEN MONETARY POLICY FAILS, FISCAL POLICY IS USED
WHEN MONETARY POLICY FAILS, FISCAL POLICY IS USEDWHEN MONETARY POLICY FAILS, FISCAL POLICY IS USED
WHEN MONETARY POLICY FAILS, FISCAL POLICY IS USEDSambit Mishra
 
Analysis of Pakistan's Economy Crises
Analysis of Pakistan's Economy CrisesAnalysis of Pakistan's Economy Crises
Analysis of Pakistan's Economy CrisesTooba Habib
 

What's hot (15)

MNI India Business Report July 2014
MNI India Business Report July 2014MNI India Business Report July 2014
MNI India Business Report July 2014
 
Economics Project
Economics ProjectEconomics Project
Economics Project
 
5th RBI Monetary Policy
5th RBI Monetary Policy5th RBI Monetary Policy
5th RBI Monetary Policy
 
Indian economic suvey 2016
Indian economic suvey 2016 Indian economic suvey 2016
Indian economic suvey 2016
 
India’s gdp growth story
India’s gdp growth storyIndia’s gdp growth story
India’s gdp growth story
 
International Newsletter Kienbaum Japan
International Newsletter Kienbaum JapanInternational Newsletter Kienbaum Japan
International Newsletter Kienbaum Japan
 
India union budget challenges
India union budget challengesIndia union budget challenges
India union budget challenges
 
Key Features of Budget 2015 -16
Key Features of Budget 2015 -16Key Features of Budget 2015 -16
Key Features of Budget 2015 -16
 
Project report on gdp and inflation
Project report on gdp and inflationProject report on gdp and inflation
Project report on gdp and inflation
 
ECONOMY MATTERS: Corporate Profitability and Investment Trends
ECONOMY MATTERS: Corporate Profitability and Investment Trends ECONOMY MATTERS: Corporate Profitability and Investment Trends
ECONOMY MATTERS: Corporate Profitability and Investment Trends
 
Indicus Ma Foi Randstad Employment Trends Survey - Wave 1 - 2011
Indicus Ma Foi Randstad Employment Trends Survey - Wave 1 - 2011Indicus Ma Foi Randstad Employment Trends Survey - Wave 1 - 2011
Indicus Ma Foi Randstad Employment Trends Survey - Wave 1 - 2011
 
CII - 85th Business Outlook Survey October- December 2013
CII - 85th Business Outlook Survey October- December 2013CII - 85th Business Outlook Survey October- December 2013
CII - 85th Business Outlook Survey October- December 2013
 
Weekly media update 06 12_2021
Weekly media update 06 12_2021Weekly media update 06 12_2021
Weekly media update 06 12_2021
 
WHEN MONETARY POLICY FAILS, FISCAL POLICY IS USED
WHEN MONETARY POLICY FAILS, FISCAL POLICY IS USEDWHEN MONETARY POLICY FAILS, FISCAL POLICY IS USED
WHEN MONETARY POLICY FAILS, FISCAL POLICY IS USED
 
Analysis of Pakistan's Economy Crises
Analysis of Pakistan's Economy CrisesAnalysis of Pakistan's Economy Crises
Analysis of Pakistan's Economy Crises
 

Viewers also liked

Etude PwC sur les banques étrangères en Chine 2012
Etude PwC sur les banques étrangères en Chine 2012Etude PwC sur les banques étrangères en Chine 2012
Etude PwC sur les banques étrangères en Chine 2012PwC France
 
Etude PwC "Insurance 2020" : dommage et digital (2014)
Etude PwC "Insurance 2020" : dommage et digital (2014)Etude PwC "Insurance 2020" : dommage et digital (2014)
Etude PwC "Insurance 2020" : dommage et digital (2014)PwC France
 
Etude PwC 2012 Cities of Opportunities
Etude PwC 2012 Cities of OpportunitiesEtude PwC 2012 Cities of Opportunities
Etude PwC 2012 Cities of OpportunitiesPwC France
 
Etude sur l'industrie de la 3D
Etude sur l'industrie de la 3DEtude sur l'industrie de la 3D
Etude sur l'industrie de la 3DPwC France
 
Investissement responsable : la création de valeur à partir des enjeux enviro...
Investissement responsable : la création de valeur à partir des enjeux enviro...Investissement responsable : la création de valeur à partir des enjeux enviro...
Investissement responsable : la création de valeur à partir des enjeux enviro...PwC France
 
Etude PwC secteur hôtelier (2013)
Etude PwC secteur hôtelier (2013)Etude PwC secteur hôtelier (2013)
Etude PwC secteur hôtelier (2013)PwC France
 
Etude annuelle Aéronautique & Défense "Programmes under pressure" (2011)
Etude annuelle Aéronautique & Défense "Programmes under pressure" (2011)Etude annuelle Aéronautique & Défense "Programmes under pressure" (2011)
Etude annuelle Aéronautique & Défense "Programmes under pressure" (2011)PwC France
 
Etude PwC sur les transactions dans les services financiers en Europe au T2 2012
Etude PwC sur les transactions dans les services financiers en Europe au T2 2012Etude PwC sur les transactions dans les services financiers en Europe au T2 2012
Etude PwC sur les transactions dans les services financiers en Europe au T2 2012PwC France
 
Etude PwC/CIO/CSO sur la sécurité de l'information (2014)
Etude PwC/CIO/CSO sur la sécurité de l'information (2014)Etude PwC/CIO/CSO sur la sécurité de l'information (2014)
Etude PwC/CIO/CSO sur la sécurité de l'information (2014)PwC France
 

Viewers also liked (9)

Etude PwC sur les banques étrangères en Chine 2012
Etude PwC sur les banques étrangères en Chine 2012Etude PwC sur les banques étrangères en Chine 2012
Etude PwC sur les banques étrangères en Chine 2012
 
Etude PwC "Insurance 2020" : dommage et digital (2014)
Etude PwC "Insurance 2020" : dommage et digital (2014)Etude PwC "Insurance 2020" : dommage et digital (2014)
Etude PwC "Insurance 2020" : dommage et digital (2014)
 
Etude PwC 2012 Cities of Opportunities
Etude PwC 2012 Cities of OpportunitiesEtude PwC 2012 Cities of Opportunities
Etude PwC 2012 Cities of Opportunities
 
Etude sur l'industrie de la 3D
Etude sur l'industrie de la 3DEtude sur l'industrie de la 3D
Etude sur l'industrie de la 3D
 
Investissement responsable : la création de valeur à partir des enjeux enviro...
Investissement responsable : la création de valeur à partir des enjeux enviro...Investissement responsable : la création de valeur à partir des enjeux enviro...
Investissement responsable : la création de valeur à partir des enjeux enviro...
 
Etude PwC secteur hôtelier (2013)
Etude PwC secteur hôtelier (2013)Etude PwC secteur hôtelier (2013)
Etude PwC secteur hôtelier (2013)
 
Etude annuelle Aéronautique & Défense "Programmes under pressure" (2011)
Etude annuelle Aéronautique & Défense "Programmes under pressure" (2011)Etude annuelle Aéronautique & Défense "Programmes under pressure" (2011)
Etude annuelle Aéronautique & Défense "Programmes under pressure" (2011)
 
Etude PwC sur les transactions dans les services financiers en Europe au T2 2012
Etude PwC sur les transactions dans les services financiers en Europe au T2 2012Etude PwC sur les transactions dans les services financiers en Europe au T2 2012
Etude PwC sur les transactions dans les services financiers en Europe au T2 2012
 
Etude PwC/CIO/CSO sur la sécurité de l'information (2014)
Etude PwC/CIO/CSO sur la sécurité de l'information (2014)Etude PwC/CIO/CSO sur la sécurité de l'information (2014)
Etude PwC/CIO/CSO sur la sécurité de l'information (2014)
 

Similar to PwC Global Economy Watch (août 2014)

Prelude to Budget 2017-18
Prelude to Budget 2017-18Prelude to Budget 2017-18
Prelude to Budget 2017-18Inves Trekk
 
PwC Global Economy watch (mai 2014)
PwC Global Economy watch (mai 2014)PwC Global Economy watch (mai 2014)
PwC Global Economy watch (mai 2014)PwC France
 
Economic Reforms in India since 1991
Economic Reforms in India since 1991Economic Reforms in India since 1991
Economic Reforms in India since 1991Nabendu Maji
 
Indian Budget
Indian BudgetIndian Budget
Indian BudgetKanchan13
 
Economic Survey 2016-17
Economic Survey 2016-17Economic Survey 2016-17
Economic Survey 2016-17EdelmanIndiaPA
 
India Economic Survey 2017 by Edelman India
India Economic Survey 2017 by Edelman IndiaIndia Economic Survey 2017 by Edelman India
India Economic Survey 2017 by Edelman IndiaAklanta Kalita
 
PwC Global Economy watch (mars 2014)
PwC Global Economy watch (mars 2014)PwC Global Economy watch (mars 2014)
PwC Global Economy watch (mars 2014)PwC France
 
Indonesia Economic Outlook Q1 2019
Indonesia Economic Outlook Q1 2019Indonesia Economic Outlook Q1 2019
Indonesia Economic Outlook Q1 2019Febrio Kacaribu
 
Indonesia Economic Outlook Q1 2019
Indonesia Economic Outlook Q1 2019Indonesia Economic Outlook Q1 2019
Indonesia Economic Outlook Q1 2019febrionathan
 
Deloitte India: What the union budget 2021 brings?
Deloitte India: What the union budget 2021 brings?Deloitte India: What the union budget 2021 brings?
Deloitte India: What the union budget 2021 brings?aakash malhotra
 
233317454 budget-speech
233317454 budget-speech233317454 budget-speech
233317454 budget-speechBFSICM
 
Deciphering... India Budget 2017
Deciphering... India Budget 2017Deciphering... India Budget 2017
Deciphering... India Budget 2017Prashant Kotecha
 
PM Speech for 12th 5Year Plan
PM Speech for 12th 5Year PlanPM Speech for 12th 5Year Plan
PM Speech for 12th 5Year PlanAnkur Pandey
 

Similar to PwC Global Economy Watch (août 2014) (20)

Prelude to Budget 2017-18
Prelude to Budget 2017-18Prelude to Budget 2017-18
Prelude to Budget 2017-18
 
PwC Global Economy watch (mai 2014)
PwC Global Economy watch (mai 2014)PwC Global Economy watch (mai 2014)
PwC Global Economy watch (mai 2014)
 
Budget 2011 12
Budget 2011 12Budget 2011 12
Budget 2011 12
 
Economic Reforms in India since 1991
Economic Reforms in India since 1991Economic Reforms in India since 1991
Economic Reforms in India since 1991
 
MTBiz July 2014
MTBiz July 2014MTBiz July 2014
MTBiz July 2014
 
Indian Budget
Indian BudgetIndian Budget
Indian Budget
 
Union Budget 2016
Union Budget 2016Union Budget 2016
Union Budget 2016
 
Budget Analysis
Budget AnalysisBudget Analysis
Budget Analysis
 
Economic Survey 2016-17
Economic Survey 2016-17Economic Survey 2016-17
Economic Survey 2016-17
 
India Economic Survey 2017 by Edelman India
India Economic Survey 2017 by Edelman IndiaIndia Economic Survey 2017 by Edelman India
India Economic Survey 2017 by Edelman India
 
PwC Global Economy watch (mars 2014)
PwC Global Economy watch (mars 2014)PwC Global Economy watch (mars 2014)
PwC Global Economy watch (mars 2014)
 
Indonesia Economic Outlook Q1 2019
Indonesia Economic Outlook Q1 2019Indonesia Economic Outlook Q1 2019
Indonesia Economic Outlook Q1 2019
 
Indonesia Economic Outlook Q1 2019
Indonesia Economic Outlook Q1 2019Indonesia Economic Outlook Q1 2019
Indonesia Economic Outlook Q1 2019
 
Investeurs chronicles 14
Investeurs chronicles 14Investeurs chronicles 14
Investeurs chronicles 14
 
Deloitte India: What the union budget 2021 brings?
Deloitte India: What the union budget 2021 brings?Deloitte India: What the union budget 2021 brings?
Deloitte India: What the union budget 2021 brings?
 
Economy Matters, January 2014
Economy Matters, January 2014Economy Matters, January 2014
Economy Matters, January 2014
 
Findharm95
Findharm95Findharm95
Findharm95
 
233317454 budget-speech
233317454 budget-speech233317454 budget-speech
233317454 budget-speech
 
Deciphering... India Budget 2017
Deciphering... India Budget 2017Deciphering... India Budget 2017
Deciphering... India Budget 2017
 
PM Speech for 12th 5Year Plan
PM Speech for 12th 5Year PlanPM Speech for 12th 5Year Plan
PM Speech for 12th 5Year Plan
 

More from PwC France

Etude PwC "20ème édition de la CEO Survey" - Janvier 2017
Etude PwC "20ème édition de la CEO Survey" - Janvier 2017Etude PwC "20ème édition de la CEO Survey" - Janvier 2017
Etude PwC "20ème édition de la CEO Survey" - Janvier 2017PwC France
 
Etude PwC "Carbon Factor" (nov. 2015)
Etude PwC "Carbon Factor" (nov. 2015)Etude PwC "Carbon Factor" (nov. 2015)
Etude PwC "Carbon Factor" (nov. 2015)PwC France
 
Etude PwC : La transition énergétique pour la croissance verte (nov 2015)
Etude PwC : La transition énergétique pour la croissance verte (nov 2015)Etude PwC : La transition énergétique pour la croissance verte (nov 2015)
Etude PwC : La transition énergétique pour la croissance verte (nov 2015)PwC France
 
Etude PwC "Total Retail 2015" Sur quoi miser aujourd’hui pour réenchanter la ...
Etude PwC "Total Retail 2015" Sur quoi miser aujourd’hui pour réenchanter la ...Etude PwC "Total Retail 2015" Sur quoi miser aujourd’hui pour réenchanter la ...
Etude PwC "Total Retail 2015" Sur quoi miser aujourd’hui pour réenchanter la ...PwC France
 
GEMO 2016 : un digital de plus en plus cannibale ?
GEMO 2016  : un digital de plus en plus cannibale ?GEMO 2016  : un digital de plus en plus cannibale ?
GEMO 2016 : un digital de plus en plus cannibale ?PwC France
 
Infographie PwC GEMO 2016 sur l'industrie Médias et Loisirs (juin 2015)
Infographie PwC GEMO 2016 sur l'industrie Médias et Loisirs (juin 2015)Infographie PwC GEMO 2016 sur l'industrie Médias et Loisirs (juin 2015)
Infographie PwC GEMO 2016 sur l'industrie Médias et Loisirs (juin 2015)PwC France
 
Etude PwC Low Carbon Economy Index (oct. 2015)
Etude PwC Low Carbon Economy Index (oct. 2015)Etude PwC Low Carbon Economy Index (oct. 2015)
Etude PwC Low Carbon Economy Index (oct. 2015)PwC France
 
Etude FCD, ESSEC et PwC sur la distribution responsable (août 2015)
Etude FCD, ESSEC et PwC sur la distribution responsable (août 2015)Etude FCD, ESSEC et PwC sur la distribution responsable (août 2015)
Etude FCD, ESSEC et PwC sur la distribution responsable (août 2015)PwC France
 
Etude PwC IPO Watch
Etude PwC IPO WatchEtude PwC IPO Watch
Etude PwC IPO WatchPwC France
 
Etude PwC CEO Survey Talent "People Strategy for the Digital Age" (juillet 2015)
Etude PwC CEO Survey Talent "People Strategy for the Digital Age" (juillet 2015)Etude PwC CEO Survey Talent "People Strategy for the Digital Age" (juillet 2015)
Etude PwC CEO Survey Talent "People Strategy for the Digital Age" (juillet 2015)PwC France
 
Etude PwC Golden Age Index (juin 2015)
Etude PwC Golden Age Index (juin 2015)Etude PwC Golden Age Index (juin 2015)
Etude PwC Golden Age Index (juin 2015)PwC France
 
Etude PwC Global Economy Watch (juin 2015)
Etude PwC Global Economy Watch (juin 2015)Etude PwC Global Economy Watch (juin 2015)
Etude PwC Global Economy Watch (juin 2015)PwC France
 
Etude PwC et Essec "Grande consommation 1985 - 2015 - 2045"
Etude PwC et Essec "Grande consommation 1985 - 2015 - 2045"Etude PwC et Essec "Grande consommation 1985 - 2015 - 2045"
Etude PwC et Essec "Grande consommation 1985 - 2015 - 2045"PwC France
 
Etude PwC sur le Top 100 des entreprises les mieux valorisées au monde en 201...
Etude PwC sur le Top 100 des entreprises les mieux valorisées au monde en 201...Etude PwC sur le Top 100 des entreprises les mieux valorisées au monde en 201...
Etude PwC sur le Top 100 des entreprises les mieux valorisées au monde en 201...PwC France
 
Etude PwC "Point of View: Enterprise Portfolio & Program Management" (mai 2015)
Etude PwC "Point of View: Enterprise Portfolio & Program Management" (mai 2015)Etude PwC "Point of View: Enterprise Portfolio & Program Management" (mai 2015)
Etude PwC "Point of View: Enterprise Portfolio & Program Management" (mai 2015)PwC France
 
Etude PwC "Bridging the gap" sur les investisseurs institutionnels (mai 2015)
Etude PwC "Bridging the gap" sur les investisseurs institutionnels (mai 2015)Etude PwC "Bridging the gap" sur les investisseurs institutionnels (mai 2015)
Etude PwC "Bridging the gap" sur les investisseurs institutionnels (mai 2015)PwC France
 
Etude PwC, AFDEL et SNJV sur "Les 100 digital"
Etude PwC, AFDEL et SNJV sur "Les 100 digital"Etude PwC, AFDEL et SNJV sur "Les 100 digital"
Etude PwC, AFDEL et SNJV sur "Les 100 digital"PwC France
 
Etude PwC Global Economy Watch (mai 2015)
Etude PwC Global Economy Watch (mai 2015)Etude PwC Global Economy Watch (mai 2015)
Etude PwC Global Economy Watch (mai 2015)PwC France
 
Etude PwC sur l'économie collaborative (mai 2015)
Etude PwC sur l'économie collaborative (mai 2015)Etude PwC sur l'économie collaborative (mai 2015)
Etude PwC sur l'économie collaborative (mai 2015)PwC France
 
Etude PwC sur l'intérêt des investisseurs pour l’Afrique (avril 2015)
Etude PwC sur l'intérêt des investisseurs pour l’Afrique (avril 2015)Etude PwC sur l'intérêt des investisseurs pour l’Afrique (avril 2015)
Etude PwC sur l'intérêt des investisseurs pour l’Afrique (avril 2015)PwC France
 

More from PwC France (20)

Etude PwC "20ème édition de la CEO Survey" - Janvier 2017
Etude PwC "20ème édition de la CEO Survey" - Janvier 2017Etude PwC "20ème édition de la CEO Survey" - Janvier 2017
Etude PwC "20ème édition de la CEO Survey" - Janvier 2017
 
Etude PwC "Carbon Factor" (nov. 2015)
Etude PwC "Carbon Factor" (nov. 2015)Etude PwC "Carbon Factor" (nov. 2015)
Etude PwC "Carbon Factor" (nov. 2015)
 
Etude PwC : La transition énergétique pour la croissance verte (nov 2015)
Etude PwC : La transition énergétique pour la croissance verte (nov 2015)Etude PwC : La transition énergétique pour la croissance verte (nov 2015)
Etude PwC : La transition énergétique pour la croissance verte (nov 2015)
 
Etude PwC "Total Retail 2015" Sur quoi miser aujourd’hui pour réenchanter la ...
Etude PwC "Total Retail 2015" Sur quoi miser aujourd’hui pour réenchanter la ...Etude PwC "Total Retail 2015" Sur quoi miser aujourd’hui pour réenchanter la ...
Etude PwC "Total Retail 2015" Sur quoi miser aujourd’hui pour réenchanter la ...
 
GEMO 2016 : un digital de plus en plus cannibale ?
GEMO 2016  : un digital de plus en plus cannibale ?GEMO 2016  : un digital de plus en plus cannibale ?
GEMO 2016 : un digital de plus en plus cannibale ?
 
Infographie PwC GEMO 2016 sur l'industrie Médias et Loisirs (juin 2015)
Infographie PwC GEMO 2016 sur l'industrie Médias et Loisirs (juin 2015)Infographie PwC GEMO 2016 sur l'industrie Médias et Loisirs (juin 2015)
Infographie PwC GEMO 2016 sur l'industrie Médias et Loisirs (juin 2015)
 
Etude PwC Low Carbon Economy Index (oct. 2015)
Etude PwC Low Carbon Economy Index (oct. 2015)Etude PwC Low Carbon Economy Index (oct. 2015)
Etude PwC Low Carbon Economy Index (oct. 2015)
 
Etude FCD, ESSEC et PwC sur la distribution responsable (août 2015)
Etude FCD, ESSEC et PwC sur la distribution responsable (août 2015)Etude FCD, ESSEC et PwC sur la distribution responsable (août 2015)
Etude FCD, ESSEC et PwC sur la distribution responsable (août 2015)
 
Etude PwC IPO Watch
Etude PwC IPO WatchEtude PwC IPO Watch
Etude PwC IPO Watch
 
Etude PwC CEO Survey Talent "People Strategy for the Digital Age" (juillet 2015)
Etude PwC CEO Survey Talent "People Strategy for the Digital Age" (juillet 2015)Etude PwC CEO Survey Talent "People Strategy for the Digital Age" (juillet 2015)
Etude PwC CEO Survey Talent "People Strategy for the Digital Age" (juillet 2015)
 
Etude PwC Golden Age Index (juin 2015)
Etude PwC Golden Age Index (juin 2015)Etude PwC Golden Age Index (juin 2015)
Etude PwC Golden Age Index (juin 2015)
 
Etude PwC Global Economy Watch (juin 2015)
Etude PwC Global Economy Watch (juin 2015)Etude PwC Global Economy Watch (juin 2015)
Etude PwC Global Economy Watch (juin 2015)
 
Etude PwC et Essec "Grande consommation 1985 - 2015 - 2045"
Etude PwC et Essec "Grande consommation 1985 - 2015 - 2045"Etude PwC et Essec "Grande consommation 1985 - 2015 - 2045"
Etude PwC et Essec "Grande consommation 1985 - 2015 - 2045"
 
Etude PwC sur le Top 100 des entreprises les mieux valorisées au monde en 201...
Etude PwC sur le Top 100 des entreprises les mieux valorisées au monde en 201...Etude PwC sur le Top 100 des entreprises les mieux valorisées au monde en 201...
Etude PwC sur le Top 100 des entreprises les mieux valorisées au monde en 201...
 
Etude PwC "Point of View: Enterprise Portfolio & Program Management" (mai 2015)
Etude PwC "Point of View: Enterprise Portfolio & Program Management" (mai 2015)Etude PwC "Point of View: Enterprise Portfolio & Program Management" (mai 2015)
Etude PwC "Point of View: Enterprise Portfolio & Program Management" (mai 2015)
 
Etude PwC "Bridging the gap" sur les investisseurs institutionnels (mai 2015)
Etude PwC "Bridging the gap" sur les investisseurs institutionnels (mai 2015)Etude PwC "Bridging the gap" sur les investisseurs institutionnels (mai 2015)
Etude PwC "Bridging the gap" sur les investisseurs institutionnels (mai 2015)
 
Etude PwC, AFDEL et SNJV sur "Les 100 digital"
Etude PwC, AFDEL et SNJV sur "Les 100 digital"Etude PwC, AFDEL et SNJV sur "Les 100 digital"
Etude PwC, AFDEL et SNJV sur "Les 100 digital"
 
Etude PwC Global Economy Watch (mai 2015)
Etude PwC Global Economy Watch (mai 2015)Etude PwC Global Economy Watch (mai 2015)
Etude PwC Global Economy Watch (mai 2015)
 
Etude PwC sur l'économie collaborative (mai 2015)
Etude PwC sur l'économie collaborative (mai 2015)Etude PwC sur l'économie collaborative (mai 2015)
Etude PwC sur l'économie collaborative (mai 2015)
 
Etude PwC sur l'intérêt des investisseurs pour l’Afrique (avril 2015)
Etude PwC sur l'intérêt des investisseurs pour l’Afrique (avril 2015)Etude PwC sur l'intérêt des investisseurs pour l’Afrique (avril 2015)
Etude PwC sur l'intérêt des investisseurs pour l’Afrique (avril 2015)
 

Recently uploaded

Dividend Policy and Dividend Decision Theories.pptx
Dividend Policy and Dividend Decision Theories.pptxDividend Policy and Dividend Decision Theories.pptx
Dividend Policy and Dividend Decision Theories.pptxanshikagoel52
 
VIP Call Girls Thane Sia 8617697112 Independent Escort Service Thane
VIP Call Girls Thane Sia 8617697112 Independent Escort Service ThaneVIP Call Girls Thane Sia 8617697112 Independent Escort Service Thane
VIP Call Girls Thane Sia 8617697112 Independent Escort Service ThaneCall girls in Ahmedabad High profile
 
Monthly Market Risk Update: April 2024 [SlideShare]
Monthly Market Risk Update: April 2024 [SlideShare]Monthly Market Risk Update: April 2024 [SlideShare]
Monthly Market Risk Update: April 2024 [SlideShare]Commonwealth
 
Instant Issue Debit Cards - School Designs
Instant Issue Debit Cards - School DesignsInstant Issue Debit Cards - School Designs
Instant Issue Debit Cards - School Designsegoetzinger
 
The Economic History of the U.S. Lecture 17.pdf
The Economic History of the U.S. Lecture 17.pdfThe Economic History of the U.S. Lecture 17.pdf
The Economic History of the U.S. Lecture 17.pdfGale Pooley
 
call girls in Nand Nagri (DELHI) 🔝 >༒9953330565🔝 genuine Escort Service 🔝✔️✔️
call girls in  Nand Nagri (DELHI) 🔝 >༒9953330565🔝 genuine Escort Service 🔝✔️✔️call girls in  Nand Nagri (DELHI) 🔝 >༒9953330565🔝 genuine Escort Service 🔝✔️✔️
call girls in Nand Nagri (DELHI) 🔝 >༒9953330565🔝 genuine Escort Service 🔝✔️✔️9953056974 Low Rate Call Girls In Saket, Delhi NCR
 
VIP Kolkata Call Girl Serampore 👉 8250192130 Available With Room
VIP Kolkata Call Girl Serampore 👉 8250192130  Available With RoomVIP Kolkata Call Girl Serampore 👉 8250192130  Available With Room
VIP Kolkata Call Girl Serampore 👉 8250192130 Available With Roomdivyansh0kumar0
 
Call Girls Service Nagpur Maya Call 7001035870 Meet With Nagpur Escorts
Call Girls Service Nagpur Maya Call 7001035870 Meet With Nagpur EscortsCall Girls Service Nagpur Maya Call 7001035870 Meet With Nagpur Escorts
Call Girls Service Nagpur Maya Call 7001035870 Meet With Nagpur Escortsranjana rawat
 
Call US 📞 9892124323 ✅ Kurla Call Girls In Kurla ( Mumbai ) secure service
Call US 📞 9892124323 ✅ Kurla Call Girls In Kurla ( Mumbai ) secure serviceCall US 📞 9892124323 ✅ Kurla Call Girls In Kurla ( Mumbai ) secure service
Call US 📞 9892124323 ✅ Kurla Call Girls In Kurla ( Mumbai ) secure servicePooja Nehwal
 
How Automation is Driving Efficiency Through the Last Mile of Reporting
How Automation is Driving Efficiency Through the Last Mile of ReportingHow Automation is Driving Efficiency Through the Last Mile of Reporting
How Automation is Driving Efficiency Through the Last Mile of ReportingAggregage
 
Best VIP Call Girls Noida Sector 18 Call Me: 8448380779
Best VIP Call Girls Noida Sector 18 Call Me: 8448380779Best VIP Call Girls Noida Sector 18 Call Me: 8448380779
Best VIP Call Girls Noida Sector 18 Call Me: 8448380779Delhi Call girls
 
(DIYA) Bhumkar Chowk Call Girls Just Call 7001035870 [ Cash on Delivery ] Pun...
(DIYA) Bhumkar Chowk Call Girls Just Call 7001035870 [ Cash on Delivery ] Pun...(DIYA) Bhumkar Chowk Call Girls Just Call 7001035870 [ Cash on Delivery ] Pun...
(DIYA) Bhumkar Chowk Call Girls Just Call 7001035870 [ Cash on Delivery ] Pun...ranjana rawat
 
05_Annelore Lenoir_Docbyte_MeetupDora&Cybersecurity.pptx
05_Annelore Lenoir_Docbyte_MeetupDora&Cybersecurity.pptx05_Annelore Lenoir_Docbyte_MeetupDora&Cybersecurity.pptx
05_Annelore Lenoir_Docbyte_MeetupDora&Cybersecurity.pptxFinTech Belgium
 
Vip B Aizawl Call Girls #9907093804 Contact Number Escorts Service Aizawl
Vip B Aizawl Call Girls #9907093804 Contact Number Escorts Service AizawlVip B Aizawl Call Girls #9907093804 Contact Number Escorts Service Aizawl
Vip B Aizawl Call Girls #9907093804 Contact Number Escorts Service Aizawlmakika9823
 
Stock Market Brief Deck for 4/24/24 .pdf
Stock Market Brief Deck for 4/24/24 .pdfStock Market Brief Deck for 4/24/24 .pdf
Stock Market Brief Deck for 4/24/24 .pdfMichael Silva
 
02_Fabio Colombo_Accenture_MeetupDora&Cybersecurity.pptx
02_Fabio Colombo_Accenture_MeetupDora&Cybersecurity.pptx02_Fabio Colombo_Accenture_MeetupDora&Cybersecurity.pptx
02_Fabio Colombo_Accenture_MeetupDora&Cybersecurity.pptxFinTech Belgium
 
Q3 2024 Earnings Conference Call and Webcast Slides
Q3 2024 Earnings Conference Call and Webcast SlidesQ3 2024 Earnings Conference Call and Webcast Slides
Q3 2024 Earnings Conference Call and Webcast SlidesMarketing847413
 
Instant Issue Debit Cards - High School Spirit
Instant Issue Debit Cards - High School SpiritInstant Issue Debit Cards - High School Spirit
Instant Issue Debit Cards - High School Spiritegoetzinger
 
VIP Call Girls Service Dilsukhnagar Hyderabad Call +91-8250192130
VIP Call Girls Service Dilsukhnagar Hyderabad Call +91-8250192130VIP Call Girls Service Dilsukhnagar Hyderabad Call +91-8250192130
VIP Call Girls Service Dilsukhnagar Hyderabad Call +91-8250192130Suhani Kapoor
 

Recently uploaded (20)

Dividend Policy and Dividend Decision Theories.pptx
Dividend Policy and Dividend Decision Theories.pptxDividend Policy and Dividend Decision Theories.pptx
Dividend Policy and Dividend Decision Theories.pptx
 
VIP Call Girls Thane Sia 8617697112 Independent Escort Service Thane
VIP Call Girls Thane Sia 8617697112 Independent Escort Service ThaneVIP Call Girls Thane Sia 8617697112 Independent Escort Service Thane
VIP Call Girls Thane Sia 8617697112 Independent Escort Service Thane
 
Monthly Market Risk Update: April 2024 [SlideShare]
Monthly Market Risk Update: April 2024 [SlideShare]Monthly Market Risk Update: April 2024 [SlideShare]
Monthly Market Risk Update: April 2024 [SlideShare]
 
Instant Issue Debit Cards - School Designs
Instant Issue Debit Cards - School DesignsInstant Issue Debit Cards - School Designs
Instant Issue Debit Cards - School Designs
 
The Economic History of the U.S. Lecture 17.pdf
The Economic History of the U.S. Lecture 17.pdfThe Economic History of the U.S. Lecture 17.pdf
The Economic History of the U.S. Lecture 17.pdf
 
call girls in Nand Nagri (DELHI) 🔝 >༒9953330565🔝 genuine Escort Service 🔝✔️✔️
call girls in  Nand Nagri (DELHI) 🔝 >༒9953330565🔝 genuine Escort Service 🔝✔️✔️call girls in  Nand Nagri (DELHI) 🔝 >༒9953330565🔝 genuine Escort Service 🔝✔️✔️
call girls in Nand Nagri (DELHI) 🔝 >༒9953330565🔝 genuine Escort Service 🔝✔️✔️
 
VIP Kolkata Call Girl Serampore 👉 8250192130 Available With Room
VIP Kolkata Call Girl Serampore 👉 8250192130  Available With RoomVIP Kolkata Call Girl Serampore 👉 8250192130  Available With Room
VIP Kolkata Call Girl Serampore 👉 8250192130 Available With Room
 
Call Girls Service Nagpur Maya Call 7001035870 Meet With Nagpur Escorts
Call Girls Service Nagpur Maya Call 7001035870 Meet With Nagpur EscortsCall Girls Service Nagpur Maya Call 7001035870 Meet With Nagpur Escorts
Call Girls Service Nagpur Maya Call 7001035870 Meet With Nagpur Escorts
 
Call US 📞 9892124323 ✅ Kurla Call Girls In Kurla ( Mumbai ) secure service
Call US 📞 9892124323 ✅ Kurla Call Girls In Kurla ( Mumbai ) secure serviceCall US 📞 9892124323 ✅ Kurla Call Girls In Kurla ( Mumbai ) secure service
Call US 📞 9892124323 ✅ Kurla Call Girls In Kurla ( Mumbai ) secure service
 
Commercial Bank Economic Capsule - April 2024
Commercial Bank Economic Capsule - April 2024Commercial Bank Economic Capsule - April 2024
Commercial Bank Economic Capsule - April 2024
 
How Automation is Driving Efficiency Through the Last Mile of Reporting
How Automation is Driving Efficiency Through the Last Mile of ReportingHow Automation is Driving Efficiency Through the Last Mile of Reporting
How Automation is Driving Efficiency Through the Last Mile of Reporting
 
Best VIP Call Girls Noida Sector 18 Call Me: 8448380779
Best VIP Call Girls Noida Sector 18 Call Me: 8448380779Best VIP Call Girls Noida Sector 18 Call Me: 8448380779
Best VIP Call Girls Noida Sector 18 Call Me: 8448380779
 
(DIYA) Bhumkar Chowk Call Girls Just Call 7001035870 [ Cash on Delivery ] Pun...
(DIYA) Bhumkar Chowk Call Girls Just Call 7001035870 [ Cash on Delivery ] Pun...(DIYA) Bhumkar Chowk Call Girls Just Call 7001035870 [ Cash on Delivery ] Pun...
(DIYA) Bhumkar Chowk Call Girls Just Call 7001035870 [ Cash on Delivery ] Pun...
 
05_Annelore Lenoir_Docbyte_MeetupDora&Cybersecurity.pptx
05_Annelore Lenoir_Docbyte_MeetupDora&Cybersecurity.pptx05_Annelore Lenoir_Docbyte_MeetupDora&Cybersecurity.pptx
05_Annelore Lenoir_Docbyte_MeetupDora&Cybersecurity.pptx
 
Vip B Aizawl Call Girls #9907093804 Contact Number Escorts Service Aizawl
Vip B Aizawl Call Girls #9907093804 Contact Number Escorts Service AizawlVip B Aizawl Call Girls #9907093804 Contact Number Escorts Service Aizawl
Vip B Aizawl Call Girls #9907093804 Contact Number Escorts Service Aizawl
 
Stock Market Brief Deck for 4/24/24 .pdf
Stock Market Brief Deck for 4/24/24 .pdfStock Market Brief Deck for 4/24/24 .pdf
Stock Market Brief Deck for 4/24/24 .pdf
 
02_Fabio Colombo_Accenture_MeetupDora&Cybersecurity.pptx
02_Fabio Colombo_Accenture_MeetupDora&Cybersecurity.pptx02_Fabio Colombo_Accenture_MeetupDora&Cybersecurity.pptx
02_Fabio Colombo_Accenture_MeetupDora&Cybersecurity.pptx
 
Q3 2024 Earnings Conference Call and Webcast Slides
Q3 2024 Earnings Conference Call and Webcast SlidesQ3 2024 Earnings Conference Call and Webcast Slides
Q3 2024 Earnings Conference Call and Webcast Slides
 
Instant Issue Debit Cards - High School Spirit
Instant Issue Debit Cards - High School SpiritInstant Issue Debit Cards - High School Spirit
Instant Issue Debit Cards - High School Spirit
 
VIP Call Girls Service Dilsukhnagar Hyderabad Call +91-8250192130
VIP Call Girls Service Dilsukhnagar Hyderabad Call +91-8250192130VIP Call Girls Service Dilsukhnagar Hyderabad Call +91-8250192130
VIP Call Girls Service Dilsukhnagar Hyderabad Call +91-8250192130
 

PwC Global Economy Watch (août 2014)

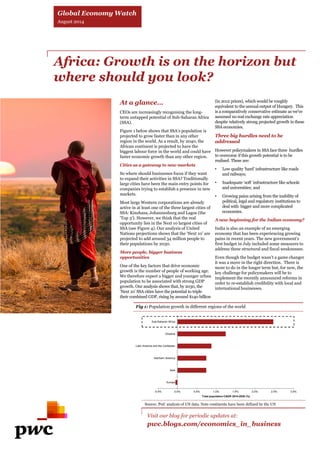
  • 1. Africa: Growth is on the horizon but where should you look? At a glance… CEOs are increasingly recognising the long-term untapped potential of Sub-Saharan Africa (SSA). Figure 1 below shows that SSA’s population is projected to grow faster than in any other region in the world. As a result, by 2040, the African continent is projected to have the biggest labour force in the world and could have faster economic growth than any other region. Cities as a gateway to newmarkets So where should businesses focus if they want to expand their activities in SSA? Traditionally large cities have been the main entry points for companies trying to establish a presence in new markets. Most largeWestern corporations are already active in at least one of the three largest cities of SSA: Kinshasa, Johannesburg and Lagos (the ‘Top 3’). However, we think that the real opportunity lies in the Next 10 largest cities of SSA (see Figure 4). Our analysis of United Nations projections shows that the ‘Next 10’ are projected to add around 34 million people to their populations by 2030. More people, bigger business opportunities One of the key factors that drive economic growth is the number of people of working age. We therefore expect a bigger and younger urban population to be associated with strong GDP growth. Our analysis shows that, by 2030, the ‘Next 10’ SSA cities have the potential to triple their combined GDP, rising by around $140 billion (in 2012 prices), whichwould be roughly equivalent to the annual output ofHungary. This is a comparatively conservative estimate aswe’ve assumed no real exchange rate appreciation despite relatively strong projected growth in these SSA economies. Three big hurdles need to be addressed However policymakers in SSAface three hurdles to overcome if this growth potential is to be realised. These are: • Low quality ‘hard’ infrastructure like roads and railways; • Inadequate ‘soft’ infrastructure like schools and universities; and • Growing pains arising fromthe inability of political, legal and regulatory institutions to deal with bigger andmore complicated economies. A newbeginning for the Indian economy? India is also an example of an emerging economy that has been experiencing growing pains in recent years. The new government’s first budget in July included some measures to address these structural and fiscal weaknesses. Even though the budget wasn’t a game changer it was a move in the right direction. There is more to do in the longer term but, for now, the key challenge for policymakers will be to implement the recently announced reforms in order to re-establish credibility with local and international businesses. Fig 1: Population growth in different regions of the world Sub-Saharan Africa Oceania Latin America and the Caribbean Northern America Asia Europe Visit our blog for periodic updates at: pwc.blogs.com/economics_in_business Global EconomyWatch August 2014 -0.5% 0.0% 0.5% 1.0% 1.5% 2.0% 2.5% 3.0% Total population CAGR 2014-2030 (%) Source: PwC analysis of UN data. Note continents have been defined by the UN
  • 2. Economic update: Contrasting E7 and G7 investment trends However, in the G7, households, businesses (and later governments) reacted by cutting down on their investment expenditure and using the proceeds to pay down their high levels of debt. …but is staging amodest rebound After years of private and public balance sheet restructuring, our analysis shows that there has been somemodest pick-up in investment in the G7 in recent years. Sustaining this will be key to keeping the recovery going. At the same time, excluding China, Figure 2 shows that E7 investment growth has largely stalled in recent years as some emerging economies have run into headwinds since 2011. For G7 businesses, stronger demand growth and rising capacity utilisation levels mean that investment will need to continue to rise, not just in machines and buildings but also in people and skills, which are key to corporate success in increasingly services-driven economies. G7 investmentwas hit the hardest… In the aftermath of the global financial crisis, investment levels among the advanced and emerging economies fell. Figure 2 shows that investment by households, businesses and governments in the G7 dropped by around 15% in real terms between 2007 and 2009 and still remain below pre-crisis levels. This contrasts with the experience of the E7 (the seven largest emerging economies), which also suffered a temporary drop in investment activity, but rebounded strongly soon after the peak of the crisis in late 2008. In part these diverging trends can be explained by the policy response. In the E7, most governments adopted stimulus measures to counter the slowdown. They could do this because, at the time, they had relative low public debt to GDP ratios. In China, for example, the government measures that were announcedwere in excess of half a trillion US dollars, centred around large scale infrastructure projects. Fig 2: Real investment levels in the E7 andG7 180 170 160 150 140 130 120 110 100 90 80 2007 Q1 2008 Q1 2009 Q1 2010 Q1 2011 Q1 2012 Q1 2013 Q1 2014 Q1 GDP weighted real investment level (2007 Q1: 100) E7 E7 (excluding China) G7 Will theModi Budget jump start India’s economy? Arun Jaitley, India’s FinanceMinister, presented theModi government’s first budget in July. In his speech, he outlined his roadmap for the economy, which includedmeasures to improve infrastructure, reform the tax system and allowmore foreign investment in the defence and insurance sectors. However, he steered away from announcing any large-scale changes to the economy. This budget, he said, was only the beginning of a journey towards achieving a target 7%-8%rate of GDP growth within the next 3-4 years. State of the economy: low growth, high inflation The new government, which came to power following a landslide victory in the elections held inMay, inherited a slowing economy afflicted by high inflation. Specifically, in 2013, GDP grew by 4.7% while the inflation rate (for wholesale prices) was around 6%. The Annual Economic Survey (AES), which was released by the government a day before the budget, presented a mixed but improving picture. Specifically, according to the AES, the economy was projected to expand by around 5.4%-5.9%in the 2014- 15 fiscal year (FY), which is a small improvement over previous years and similar to our projections. While we think the GDP growth target for this year is achievable, this is a long way off India’s target growth rate of closer to 7%- 8% per annum. In our main economic projections, we expect GDP growth to be around 6.5% in themedium-term unless more fundamental reforms are pushed through in future years. Source: PwC analysis using National Accounts Similarly, government projections show that the current account deficit is expected to stabilise at around 2% of GDP, as compared to 4.2% in FY 2011-12. Still a long way to go So what were the key measures included in the budget? Here are a few that are relevant for business: • Liberalising the defence and insurance sectors by raising foreign investment caps to 49%; • Plans to develop roads, railways and improve infrastructure in cities in partnership with private sector players; and • Tax reforms to hasten a uniform Goods and Services Tax (GST) regime across the country. Realistic but not bold The new government’smaiden budget is realistic, but lacks the boldmeasures that some commentators expected after the landslide election victory.We think this is because the government wants to focus on implementing and consolidating these reforms before introducing any other major changes. However, we also think that the announced measures are insufficient to push GDP growth rates to the target rate of 7%-8% within the next 3-4 years as a lotmore needs to be done to improve manufacturing productivity and output. Fig 3: Fiscal and current account balances (as a proportion of GDP) 2.8% 2.8% 4.2% 4.7% 1.7% 2.1% 6.5% 4.8% 5.7% 4.9% 4.5% 4.1% 7.0% 6.0% 5.0% 4.0% 3.0% 2.0% 1.0% 0.0% 2009-10 2010-11 2011-12 2012-13 2013-14 2014-15 Current account deficit and fiscal deficits, % of GDP Current Account Balance, % of GDP Fiscal deficit, % of GDP Source: Annual Economic Survey 2014, Government of India Similarly, inflation remained above the government’s comfort zone due to higher food prices. However, we expect the inflation rate to stabilise in the region of around 5-6% this year on the back of monetary tightening at the beginning of 2014. The twin deficits As we pointed out in theMay edition of the Global Economy Watch, quick and decisive action on structural reforms are key factors that could help boost investment levels in India and increase its medium termgrowth prospects.However, this is challenging as India faces persistent high fiscal and current account deficits (see Figure 3), which in turn reduces the government’s policymaking flexibility. However, the new government has already started to put in placemeasures to bring down the fiscal deficit from 4.5% of GDP in FY2013-14 to 4.1% in FY2014-15 and further down to 3.6%in FY2015-16, as show in Figure 3. For a more detailed discussion on the Indian budget please read our Economics in Business blog post: Can Modi’s budget boost India’s economy?
  • 3. Which cities hold the key to unleashing growth in Sub-Saharan Africa? • Constant real exchange rates, which could also be a relatively conservative assumption given that real exchange rates might be expected to rise in the long run in dollar terms for emerging economies with relatively rapid productivity growth. Key hurdles to be overcome to realise growth potential However, we see three key hurdles which could derail the pace at which the ‘Next 10’ grow. These are issues that most SSA countries have been trying to tackle for many decades with limited success: • Low quality of ‘hard’ infrastructure like highways, airports and trains, which increases the cost of doing business, eats away at business profits and discourages investment. Figure 6 shows that most SSA economies have sub-standard roads compared, for example, to countries in the Middle East and North African (MENA) region. • Inadequate ‘soft’ infrastructure like schools and universities, which could lead to a persistent skills gap that hampers long-term business growth. Figure 6 shows that this is a real risk in countries like Burkina Faso,Mali and Ethiopia where literacy rates remain low. • Growing pains stemming from the inability of regulators and policymakers to manage effectively a larger and more complex economic system as growth proceeds. These problems could, for example, manifest themselves in the form of credit or property bubbles developing as a result of rapid economic growth, or a failure to tackle issues relating to corruption and excessive bureaucracy that deter international investment. The challenge that policymakers are faced with is to convert Africa’s demographic dividend into economic reality by overcoming these hurdles, but history suggests this will not be a quick or easy process. Potential investors should therefore form their own plans to mitigate these problems (e.g. by supporting infrastructure and skills development programmes). *World Urbanisation Prospects: The 2014 Revision Sub-Saharan Africa is moving on to the C-suite’s agenda As labour costs in Asia start to increase and pressure remains to keep prices competitive, CEOs are increasingly recognising the untapped potential of the Sub-Saharan African (SSA) countries. This is mainly driven by Africa’s unparalleled demographic edge compared to other parts of the world: Africa is the world’s youngest continent and is expected to have the biggest labour force in the world by 2040. So where should businesses focus their attention within SSA? Cities are hubs of commerce, investment and production Cities are the typical entry points for businesses trying to expand in new overseas markets. This is because they enable closer interaction with customers in a relatively small geographic space which in turn helps contain distribution costs. MostWestern companies already have some presence in at least one of SSA’s ‘Top 3’ populous cities: Lagos, Kinshasa and Johannesburg (see Figure 4). However, we think the real opportunity lies in the ‘Next 10’ large cities in SSA, the populations of which are projected to almost double in size by 2030, growing by around 32 million people. In fact, the latest United Nations projections* show that, by 2030, two out of the ‘Next 10’ cities (Dar es Salaamand Luanda) could have bigger populations than London has now. By 2030, the ‘Next 10’ cities are projected to triple their economic size Urban population growth is expected to lead to more economic activity. Figure 5 shows that, on average, the ‘Next 10’ cities are expected to almost double their population and triple their economic output by 2030. Specifically, we estimate that economic activity in the ‘Next 10’ cities could grow by around $140 billion dollars by 2030 (at constant 2012 dollars). This is roughly equivalent to the current annual output of Bangladesh. These estimates are based on the following key assumptions: • National GDP growth rates follow those projected by the IMF in its latestWorld Economic Outlook report (which do not take into account the latest Nigerian GDP rebasing); • City GDP per capita grows in line with the rest of the country (which may be a conservative assumption); Fig 4: Population trends in the ‘Top 3’ and ‘Next 10’ cities in Sub-Saharan Africa (SSA) - 5 10 15 20 25 Ibadan (Nigeria) Addis Ababa (Ethiopia) Ouagadougou (Burkina Faso) Dakar (Senegal) Kano (Nigeria) Nairobi (Kenya) Abidjan (Côte d'Ivoire) Khartoum (Sudan) Luanda (Angola) Dar es Salaam (Tanzania) Johannesburg (South Africa) Kinshasa (Congo) Lagos (Nigeria) Urban area population (millions) 2014e 2030p ‘Next 10’ cities ‘Top 3’ cities Source: UN Urbanisation Prospects 2014 revision Fig 5: Bigger cities lead to bigger economic opportunities… Ouagadougou (Burkina Faso) Addis Ababa (Ethiopia) Lagos (Nigeria) Kinshasa (Congo) Abidjan (Côte d'Ivoire) Kano (Nigeria) Johannesburg (South Africa) Dar es Salaam (Tanzania) Nairobi (Kenya) Luanda (Angola) Ibadan (Nigeria) Khartoum (Sudan) Dakar (Senegal) 400% 350% 300% 250% 200% 150% 100% 50% 20% 40% 60% 80% 100% 120% 140% % change in city GDP at 2012 US$ (2014-2030) % change in city population (2014-2030) Note that size of bubble reflects estimated city GDP as at 2030 Source: PwC analysis Fig 6: But some SSA countries face significant gaps in their ‘hard’ and ‘soft’ infrastructure compared to theMENA - 20 40 60 80 100 Congo Kenya Cote d'Ivoire Angola Ethiopia Tanzania Nigeria South Africa Burkina Faso Mali Senegal Sudan MENA Roads paved (% of total roads) Source: World Bank - 50 100 Burkina Faso Mali Ethiopia Cote d'Ivoire Nigeria Senegal Congo Sudan Tanzania Angola Kenya MENA South Africa Literacy rate (% of people aged 15 and above)
  • 4. Projections: August 2014 Real Share of 2012 world GDP GDP growth Inflation PPP* MER* 2013 2014p 2015p 2016-2020p 2013 2014p 2015p 2016-2020p Global (market exchange rates) 1 00% 2.5 2.8 3.2 3.2 4.8 5.1 5.6 4.7 Global (PPP rates) 1 00% 3.0 3.3 3.7 3.6 United States 1 9.5% 22.5% 2.2 2.1 3.1 2.4 1 .5 1 .8 2.2 1 .9 China 1 4.7% 1 1 .4% 7 .6 7 .4 7 .3 7 .0 2.6 2.3 2.5 3.4 Japan 5.5% 8.3% 1 .5 1 .5 1 .5 1 .2 0.4 2.1 2.1 1 .5 United Kingdom 2.8% 3.4% 1 .7 3.0 2.6 2.4 2.6 1 .8 1 .9 2.0 Eurozone 1 3.5% 1 6.9% -0.5 1 .1 1 .5 1 .5 1 .4 0.8 1 .1 1 .5 France 2.7% 3.6% 0.1 1 .0 1 .1 1 .7 1 .0 0.7 1 .0 1 .5 Germany 3.8% 4.7% 0.5 2.0 1 .9 1 .3 1 .6 1 .2 1 .4 1 .7 Greece 0.3% 0.3% -3.9 0.4 1 .8 3.0 -0.9 -0.8 -0.1 1 .3 Ireland 0.2% 0.3% 0.2 3.1 2.9 2.5 0.5 0.4 1 .4 1 .5 Italy 2.2% 2.8% -1 .8 0.1 0.9 1 .0 1 .3 0.7 1 .0 1 .4 Netherlands 0.8% 1 .1% -0.8 0.2 1 .5 2.0 2.6 0.8 1 .2 1 .4 Portugal 0.3% 0.3% -1 .0 0.7 1 .7 1 .8 0.4 0.4 0.9 1 .5 Spain 1 .7% 1 .8% -1 .2 1 .1 1 .5 1 .5 1 .5 0.3 0.9 1 .0 Poland 1 .0% 0.7% 1 .6 3.1 3.3 3.5 1 .2 0.7 2.2 2.5 Russia 3.0% 2.8% 1 .2 0.5 1 .2 2.5 6.8 6.4 5.5 5.0 Turkey 1 .3% 1 .1% 4.0 2.6 3.8 4.5 7 .5 8.3 6.8 4.8 Australia 1 .2% 2.1% 2.4 3.3 2.7 3.1 2.2 2.6 2.6 2.7 India 5.7% 2.6% 4.6 5.3 6.6 6.5 6.3 5.7 6.0 6.0 Indonesia 1 .4% 1 .2% 5.8 5.3 5.8 6.3 6.4 6.1 5.8 5.1 South Korea 1 .9% 1 .6% 3.0 3.5 3.7 3.8 1 .3 2.3 3.0 2.9 Argentina 0.9% 0.7% 5.0 0.7 1 .8 3.3 1 0.6 1 1 .9 1 3.3 9.7 Brazil 2.8% 3.1% 2.3 1 .3 2.0 4.0 6.2 6.6 5.7 4.8 Canada 1 .8% 2.5% 2.0 2.1 2.5 2.2 1 .0 1 .8 1 .8 2.1 Mexico 2.2% 1 .6% 1 .3 2.6 3.7 3.6 3.8 3.9 3.7 3.6 South Africa 0.7% 0.5% 1 .9 1 .7 2.5 3.8 5.8 6.1 5.5 4.8 Nigeria 0.5% 0.4% 5.5 6.0 5.9 5.7 8.5 8.5 8.6 7 .3 Saudi Arabia 1 .1% 1 .0% 4.0 4.3 4.4 4.3 3.5 3.1 3.5 4.0 Sources: PwC analysis, National statistical authorities, Thomson Datastream and IMF. All inflation indicators relate to the Consumer Price Index (CPI), with the exception of the Indian indicator which refers to the Wholesale Price Index (WPI). Argentinian inflation figures are based on the old price index which measure CPI in Greater Buenos Aires. A new index the ‘National and urban Consumer Price Index’ (NuCPI) has now been released by INDEC the Argentinian statistical agency. We will monitor this new price index and will base our projection on this once we have several months of data available. Our Nigeria GDP projections relate to the new rebased GDP figures but are subject to high margins of error. Also note that the tables above form our main scenario projections and are therefore subject to considerable uncertainties. We recommend that our clients look at a range of alternative scenarios. Interest rate outlook of major economies Current rate (Last change) Expectation Next meeting Federal Reserve 0-0.25% (December 2008) QE tapering to continue during 2014 16-17 September European Central Bank 0.15% (June2014) On hold following easing in June 7 August Bank of England 0.5% (March 2009) Rate to rise gradually from late 2014 or early 2015 7 August Richard Boxshall T: +44 (0) 20 7213 2079 E: richard.boxshall@uk.pwc.com William Zimmern T: +44 (0) 20 7212 2750 E: william.zimmern@uk.pwc.com Barret Kupelian T: + 44 (0) 20 7213 1579 E: barret.g.kupelian@uk.pwc.com PwC’s Global Consumer Index Global consumer spending growth falls slightly to 3.5% this month, but remaining above long-term trends. Recent data suggests that industrial production in key economies such as China and the US have improved. Business confidence has increased slightly, which should contribute to further consumption growth in the coming months. 4.0% 3.5% 3.0% 2.5% 2.0% 1.5% 1.0% 0.5% 0.0% 3.5% Aug-13 Sep-13 Oct-13 Nov-13 Dec-13 Jan-14 Feb-14 Mar-14 Apr-14 May-14 Jun-14 Jul-14 YoY growth Long-term growth The GCI is a monthly updated index providing an early steer on consumer spending and growth prospects in the world’s 20 largest economies. For more information, please visit www.pwc.co.uk/globalconsumerindex We help you understand how big economic, demographic, social, and environmental changes affect your organisation by setting out scenarios that identify growth opportunities and risks on a global, regional, national and local level.We help make strategic and tactical operational, pricing and investment decisions to support business value creation.We work together with you to achieve sustainable growth. This publication has been prepared for general guidance on matters of interest only, and does not constitute professional advice. You should not act upon the information contained in this publication without obtaining specific professional advice. No representation or warranty (express or implied) is given as to the accuracy or completeness of the information contained in this publication, and, to the extent permitted by law, PricewaterhouseCoopers LLP, its members, employees and agents do not accept or assume any liability, responsibility or duty of care for any consequences of you or anyone else acting, or refraining to act, in reliance on the information contained in this publication or for any decision based on it. © 2014 PricewaterhouseCoopers LLP. All rights reserved. In this document, “PwC” refers to the UK member firm, and may sometimes refer to the PwC network. Each member firm is a separate legal entity. Please see www.pwc.com/structure for further details. 140123-203416-BK-OS