Zimbabwe Hyperinflation: A Brief Overview of What Happenedbuyzimbabwedollars
This presentation provides a brief overview of what happened during the Zimbabwe hyperinflation episode of 2008. A mix of political corruption, reckless government spending, low economic output, ridiculous monetary policy, and egregious debt monetization led to the downfall of Zimbabwe's national currency. This presentation explains why.
Key Terms:
Zimbabwe
Zimbabwe dollars
Zimbabwe hyperinflation
Hyperinflation in Zimbabwe
Buy Zimbabwe dollars
Buy Zimbabwe currency
Ang Pilipinas ay isa mga bansa na biniyayaan ng maraming likas na yaman. Mahalaga ang likas na yaman bilang sangkap sa paggawa ng produkto na ginagamit sa iba’t ibang sektor tulad ng industriya at paglilingkod, halimbawa, ang mga computer, sasakyan, makina, at pagkain ay naggawa mula sa mga likas na yaman. Napapansin mo ba na halos lahat na ng mga establisyamento sa ating lugar ay hindi na gumagamit ng plastic at sa harap ay supot na papel na? Ano kaya ang pangunahing dahilan hinggil sa pagbabagong ito?
Ang likas na yaman ng Pilipinas sa kasalukuyan…
Kagubatan – mabilis at patuloy na pagliit ng forest cover mula sa 17 ektarya noong 1934 ay naging 6. 43 milyong ektaraya noong 2003.
Yamang tubig – pagbaba ng kabuuang timbang ng mga nahuhuling isda sa 3 kilo bawat araw mula sa dating 10 kilo.
Yamang lupa – pagkasira ng halos 50% ng matabang lupain sa huling sampung taon
Since the late 1990s, aggregate inflation has been less sensitive to changes in economic conditions than it has in previous decades. Analysis using the Phillips curve model at the component level shows that cyclical sensitivity of inflation varies substantially for different types of goods and services. In particular, inflation for most service components (such as shelter) and food has remained largely “pro-cyclical” (that is, rising during economic expansions and falling during economic contractions), but inflation for many types of goods (such as motor vehicles) has not. The lack of cyclical sensitivity in price inflation for goods helps explain the decreased cyclical sensitivity of aggregate inflation over the past two decades.
Also during that period, inflation expectations have become more anchored and less dependent on past inflation. Analysis using the Phillips curve model with 10 different measures of aggregate inflation suggests that that process is probably incomplete. In particular, both past inflation and the constant term in the Phillips curve model appear to help explain the dynamics of inflation through the lens of that model.
Presentation by Yiqun Gloria Chen, an analyst in CBO’s Macroeconomic Analysis Division, at the University of Michigan’s 66th Annual Economic Outlook Conference.
This PPT focuses on topic of human migration, Internal And International Migration, Effect of Immigration and Emigration on economy, covering cases of India and Unites states.
concepts of NATIONAL INCOME, GROSS DOMESTIC PRODUCT, GNP. NET INCOME, PER CAPTA INCOME, CALCULATION OF NATIONAL INCOME AT CURRENT RATE & CONSTANT RATE, IMPORTANCE OF ESTIMATION, PROBLEMS IN ESTIMATION, CURRENT INDIAN GDP, INDIAN ECONOMIC STATUS.
This presentation is based on the business cycle as a whole and its effects in the employment, production, inflation as well as government interference.
This revision presentation for business students introduces the concept of the economic cycle. GDP, consumer spending, business investment are described as are possible business strategies that are adopted during an economic downturn.
Factors in a time series analysis can be tested for leading / behavior by calculating the correlation coefficient for a range of time lags
The amount of time lag between two indicators can be measured by finding the time difference at the maximum correlation coefficient
Leading / lagging indicators have wide application in many areas beyond economics
Maintenance Leading and Lagging Key Performance Indicators (KPIs)Ricky Smith CMRP
“It is not possible to manage what you cannot control and you cannot control what you cannot measure!” (Peter Drucker)
Performance measurement is a fundamental principle of management. The measurement of performance is important because it identifies current performance gaps between current and desired performance and provides indication of progress towards closing the gaps. Carefully selected key performance indicators identify precisely where to take action to improve performance.
This paper deals with the identification of key performance indicators for the maintenance function, by first looking at the ways that maintenance performance metrics relate to manufacturing metrics. Since performance measurements for maintenance must include both results metrics and metrics for the process that produces the results, this document presents a representation for the business process for maintenance. The document then identifies typical business process and results metrics that can be used as key performance indicators for the maintenance function.
This slide is the overview of USA's great Downturn or great Depression in 1929 to 1933 in which USA GDP nearly decreased to 33% while the unemployment rate rose to 25% it describes some of the features of depression in economies and their effects on them. It also gives a few indications of depression that how it we can know that any economy is in depression. It tells us few statistics of unemployment during depression of USA
The presentation tells about all the aspects that led to the great economic depression in 1929. All the historical, financial and other factors are looked upon with the help of online available data.
KCIs - EXAMPLE WILLIAM RICHMOND ‘old model’ econom.docxDIPESH30
KCIs - EXAMPLE
WILLIAM RICHMOND
‘old model’ economic development
The term has been used to describe Australian economic development (as measured by
the European yardstick of increases in GDP) up to the end of the 1920s. The central
characteristic of the period is that rural industries (i.e. those based on the use of land)
provided the main basis of economic development (i.e. increases in GDP). Three phases
of ‘old model’ have been identified: the first, until about 1860 when new land was being
brought into use; the second, until about 1890 when capital was being applied to land so
that land could be used more intensively for the grazing of sheep and the production of
wool; and the third, until the end of the 1920s when the more intensive use of land was
based on the ‘new rural industries, i.e. those involving the use of land for agriculture
rather than the grazing of sheep. It was the second of these phases that resulted in a rapid
increase in production) and a level of GDP per head considerably in excess of any other
comparable country.
trade protection
This term refers to a policy of protecting (or shielding) producers within an economy
from competition from overseas producers. In Australian economic history it refers
particularly to the protection of producers within the manufacturing sector, in order that
the Australian manufacturing sector could develop. The main instrument of the policy
was the tariff (in effect a tax on imports) which made overseas produced goods less
competitive relative to domestically produced goods. The policy was implemented in the
1920s when there were major increases in tariff levels, and in the context of the 1930s
Depression, this being one factor in the relatively rapid recovery from the Depression.
The policy continued to characterise the Australian economy in post-WWII decades. In
so far as trade protection resulted in the extensive development of industries that were
economically inefficient it has been held to be one of the main factors underlying the
poor economic performance of the Australian economy for most of the twentieth century.
the price of iron ore since the year 2000
The price of iron ore was approximately $12-$14 per tonne in the early 2000s then started
to increase sharply after 2004, reaching a peak of nearly $180 per tonne in 2011. After
this time it fell steadily to about $50 - $60 per tonne. The significance of this lies in the
fact that iron ore is the largest export commodity. There were major positive economic
effects through linkages to other industries, both through the expenditure of incomes
made by owners and employees and (‘backwards’) through the supply of inputs to
producers of iron ore. There was also large-scale investment associated with the
development of new mines and on infrastructure associated with mining projects. A
further effect was that the value of the Australian dollar (because ...
Andrés Solimano, President and Founder of the International Center for Globalization and Development, presented on the history of recessions in the 20th century on 11 June 2019 at the OECD Development Centre for their "DEV Talks" series.
Click here to access the section of the Center for Democracy and T.docxmonicafrancis71118
Click here to access the section of the Center for Democracy and Technology (CDT) website devoted to health privacy. CDT is, by the way, a champion of online civil liberties and human rights and is dedicated to keeping the Internet open and free. Review the insights, posts, and press releases posted in CDT's health privacy section and respond to the following:
1
ECON3600
TOPIC 4 – 1929-1974: ‘New model’ economic development
The 1930s Depression
While one can play around with the figures, the magnitude of the Depression is
indicated in broad terms by the fact that, over the (relatively few) years during which
the Depression was at its most severe aggregate GDP declined, on average, by 3 per
cent per annum.
The total number of people that this had to be shared around (i.e. the total population)
grew at a markedly slower rate than had been the case in the previous decade, due
largely to an almost complete cessation of immigration and a fall in the birth rate – the
latter a reaction to economic circumstances. The population still grew, however, at
around 1 per cent per annum on average, with the result that economic growth
(defined in terms of GDP/head) declined at an average yearly rate, over the early
years of the 1930s, of 4 per cent. In the worst year of the Depression (1931) this
figure was around 10 per cent.
The very obvious manifestation of this decline was the rate of unemployment. The
level of unemployment rose markedly from about the middle of 1929 to reach a peak
of 30 per cent in the June quarter of 1932. In other words at this time nearly 1 in 3
people looking for employment was unable to find it.
Not surprisingly the economic downturn had a fundamental social effect. In personal
terms, for many people, it was a traumatic experience, in both a material and
emotional sense. For many the effects were prolonged, and for some stayed with
them, influencing their attitudes for the rest of their lives.
Causes of the Depression
As previously noted, by the closing years of the 1920s Australia was already on a
downhill path in terms of the major economic indicators. Old model economic
development, which had received a second wind, enabling the development of rural
industries that made even more intensive use of land, and which seemed to provide
the basis for the much-sought economic expansion and increase in population, was
running out of steam.
There is little doubt, however, that events in the rest of the world are the major
explanation for the Depression and certainly for its severity. As one economic
historian has put it ‘the primacy of external factors is not in doubt’.
The plunge into Depression by the United States in 1929, and the knock-on effects of
this in just about every major industrialised country (including Great Britain) had
some fundamental implications for the small Australian economy, heavily dependent
as it was on rural exports.
.
1
ECON3600
TOPIC 4 – 1929-1974: ‘New model’ economic development
The 1930s Depression
While one can play around with the figures, the magnitude of the Depression is
indicated in broad terms by the fact that, over the (relatively few) years during which
the Depression was at its most severe aggregate GDP declined, on average, by 3 per
cent per annum.
The total number of people that this had to be shared around (i.e. the total population)
grew at a markedly slower rate than had been the case in the previous decade, due
largely to an almost complete cessation of immigration and a fall in the birth rate – the
latter a reaction to economic circumstances. The population still grew, however, at
around 1 per cent per annum on average, with the result that economic growth
(defined in terms of GDP/head) declined at an average yearly rate, over the early
years of the 1930s, of 4 per cent. In the worst year of the Depression (1931) this
figure was around 10 per cent.
The very obvious manifestation of this decline was the rate of unemployment. The
level of unemployment rose markedly from about the middle of 1929 to reach a peak
of 30 per cent in the June quarter of 1932. In other words at this time nearly 1 in 3
people looking for employment was unable to find it.
Not surprisingly the economic downturn had a fundamental social effect. In personal
terms, for many people, it was a traumatic experience, in both a material and
emotional sense. For many the effects were prolonged, and for some stayed with
them, influencing their attitudes for the rest of their lives.
Causes of the Depression
As previously noted, by the closing years of the 1920s Australia was already on a
downhill path in terms of the major economic indicators. Old model economic
development, which had received a second wind, enabling the development of rural
industries that made even more intensive use of land, and which seemed to provide
the basis for the much-sought economic expansion and increase in population, was
running out of steam.
There is little doubt, however, that events in the rest of the world are the major
explanation for the Depression and certainly for its severity. As one economic
historian has put it ‘the primacy of external factors is not in doubt’.
The plunge into Depression by the United States in 1929, and the knock-on effects of
this in just about every major industrialised country (including Great Britain) had
some fundamental implications for the small Australian economy, heavily dependent
as it was on rural exports.
2
Both the demand for exports and their price (which had been falling anyway in the
years prior to the Depression) fell sharply and so did the income earned from them.
From a national point of view this income was vital in paying the large interest bill
incurred by the high level of borrowing that had been undertaken earlier in the 1920s.
Thus the h ...
What are the main advantages of using HR recruiter services.pdfHumanResourceDimensi1
HR recruiter services offer top talents to companies according to their specific needs. They handle all recruitment tasks from job posting to onboarding and help companies concentrate on their business growth. With their expertise and years of experience, they streamline the hiring process and save time and resources for the company.
Affordable Stationery Printing Services in Jaipur | Navpack n PrintNavpack & Print
Looking for professional printing services in Jaipur? Navpack n Print offers high-quality and affordable stationery printing for all your business needs. Stand out with custom stationery designs and fast turnaround times. Contact us today for a quote!
Discover the innovative and creative projects that highlight my journey throu...dylandmeas
Discover the innovative and creative projects that highlight my journey through Full Sail University. Below, you’ll find a collection of my work showcasing my skills and expertise in digital marketing, event planning, and media production.
Business Valuation Principles for EntrepreneursBen Wann
This insightful presentation is designed to equip entrepreneurs with the essential knowledge and tools needed to accurately value their businesses. Understanding business valuation is crucial for making informed decisions, whether you're seeking investment, planning to sell, or simply want to gauge your company's worth.
What is the TDS Return Filing Due Date for FY 2024-25.pdfseoforlegalpillers
It is crucial for the taxpayers to understand about the TDS Return Filing Due Date, so that they can fulfill your TDS obligations efficiently. Taxpayers can avoid penalties by sticking to the deadlines and by accurate filing of TDS. Timely filing of TDS will make sure about the availability of tax credits. You can also seek the professional guidance of experts like Legal Pillers for timely filing of the TDS Return.
Explore our most comprehensive guide on lookback analysis at SafePaaS, covering access governance and how it can transform modern ERP audits. Browse now!
Skye Residences | Extended Stay Residences Near Toronto Airportmarketingjdass
Experience unparalleled EXTENDED STAY and comfort at Skye Residences located just minutes from Toronto Airport. Discover sophisticated accommodations tailored for discerning travelers.
Website Link :
https://skyeresidences.com/
https://skyeresidences.com/about-us/
https://skyeresidences.com/gallery/
https://skyeresidences.com/rooms/
https://skyeresidences.com/near-by-attractions/
https://skyeresidences.com/commute/
https://skyeresidences.com/contact/
https://skyeresidences.com/queen-suite-with-sofa-bed/
https://skyeresidences.com/queen-suite-with-sofa-bed-and-balcony/
https://skyeresidences.com/queen-suite-with-sofa-bed-accessible/
https://skyeresidences.com/2-bedroom-deluxe-queen-suite-with-sofa-bed/
https://skyeresidences.com/2-bedroom-deluxe-king-queen-suite-with-sofa-bed/
https://skyeresidences.com/2-bedroom-deluxe-queen-suite-with-sofa-bed-accessible/
#Skye Residences Etobicoke, #Skye Residences Near Toronto Airport, #Skye Residences Toronto, #Skye Hotel Toronto, #Skye Hotel Near Toronto Airport, #Hotel Near Toronto Airport, #Near Toronto Airport Accommodation, #Suites Near Toronto Airport, #Etobicoke Suites Near Airport, #Hotel Near Toronto Pearson International Airport, #Toronto Airport Suite Rentals, #Pearson Airport Hotel Suites
Accpac to QuickBooks Conversion Navigating the Transition with Online Account...PaulBryant58
This article provides a comprehensive guide on how to
effectively manage the convert Accpac to QuickBooks , with a particular focus on utilizing online accounting services to streamline the process.
RMD24 | Retail media: hoe zet je dit in als je geen AH of Unilever bent? Heid...BBPMedia1
Grote partijen zijn al een tijdje onderweg met retail media. Ondertussen worden in dit domein ook de kansen zichtbaar voor andere spelers in de markt. Maar met die kansen ontstaan ook vragen: Zelf retail media worden of erop adverteren? In welke fase van de funnel past het en hoe integreer je het in een mediaplan? Wat is nu precies het verschil met marketplaces en Programmatic ads? In dit half uur beslechten we de dilemma's en krijg je antwoorden op wanneer het voor jou tijd is om de volgende stap te zetten.
RMD24 | Debunking the non-endemic revenue myth Marvin Vacquier Droop | First ...BBPMedia1
Marvin neemt je in deze presentatie mee in de voordelen van non-endemic advertising op retail media netwerken. Hij brengt ook de uitdagingen in beeld die de markt op dit moment heeft op het gebied van retail media voor niet-leveranciers.
Retail media wordt gezien als het nieuwe advertising-medium en ook mediabureaus richten massaal retail media-afdelingen op. Merken die niet in de betreffende winkel liggen staan ook nog niet in de rij om op de retail media netwerken te adverteren. Marvin belicht de uitdagingen die er zijn om echt aansluiting te vinden op die markt van non-endemic advertising.
India Orthopedic Devices Market: Unlocking Growth Secrets, Trends and Develop...Kumar Satyam
According to TechSci Research report, “India Orthopedic Devices Market -Industry Size, Share, Trends, Competition Forecast & Opportunities, 2030”, the India Orthopedic Devices Market stood at USD 1,280.54 Million in 2024 and is anticipated to grow with a CAGR of 7.84% in the forecast period, 2026-2030F. The India Orthopedic Devices Market is being driven by several factors. The most prominent ones include an increase in the elderly population, who are more prone to orthopedic conditions such as osteoporosis and arthritis. Moreover, the rise in sports injuries and road accidents are also contributing to the demand for orthopedic devices. Advances in technology and the introduction of innovative implants and prosthetics have further propelled the market growth. Additionally, government initiatives aimed at improving healthcare infrastructure and the increasing prevalence of lifestyle diseases have led to an upward trend in orthopedic surgeries, thereby fueling the market demand for these devices.
Putting the SPARK into Virtual Training.pptxCynthia Clay
This 60-minute webinar, sponsored by Adobe, was delivered for the Training Mag Network. It explored the five elements of SPARK: Storytelling, Purpose, Action, Relationships, and Kudos. Knowing how to tell a well-structured story is key to building long-term memory. Stating a clear purpose that doesn't take away from the discovery learning process is critical. Ensuring that people move from theory to practical application is imperative. Creating strong social learning is the key to commitment and engagement. Validating and affirming participants' comments is the way to create a positive learning environment.
Falcon stands out as a top-tier P2P Invoice Discounting platform in India, bridging esteemed blue-chip companies and eager investors. Our goal is to transform the investment landscape in India by establishing a comprehensive destination for borrowers and investors with diverse profiles and needs, all while minimizing risk. What sets Falcon apart is the elimination of intermediaries such as commercial banks and depository institutions, allowing investors to enjoy higher yields.
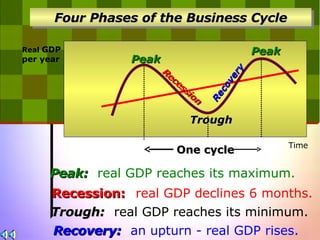
1. Peak Trough Recovery Real GDP per year Peak: real GDP reaches its maximum. Recession: real GDP declines 6 months. Recovery: an upturn - real GDP rises. Trough: real GDP reaches its minimum. Recession Time Peak Four Phases of the Business Cycle One cycle
2. Four Phases of Business Cycle Characteristics of Expansions and Recessions Expansions 1.Low unemployment 2. Increase in real GDP 3. Rapid job growth 4. Increasing prices Recessions 1. High unemployment 2. Decrease in Real GDP 3. Reduced job growth 4. Decreasing prices
3. THE BUSINESS CYCLE Phases of the Business Cycle PEAK Level of business activity Time RECESSION TROUGH RECOVERY GROWTH TREND
6. Business Cycles – upturns and downturns in business activity Expansion – period of growth where the GDP increases . Laid off workers (auto) are called back to work. Car dealers sell more cars. Fed raises interest rates to prevent overheating. Peak – High point of expansion ( where real GDP stops increasing ). Skilled workers become hard to find. Inflation usually at its Highest point .
7. Recession - contraction for 2 quarters There have been 11 recessions since World War II. They have ranged from 6 months to 16 months , averaging 11 months . Expansions average about 4 years . Recessions usually cost the layoff of 1 out of every 20 workers [ 1 out of every 4 or 5 families ]. There has been a recession every decade for over 200 years.
8. Trough – pit of a recession The trough is “ bad news ” and “good news.” It is the bottom of the “ valley” of the downturn and the foot of the “hill” of expansion. Trough ( “ base ” ) – demand, production And unemployment are at their lowest point . Real GDP begins to increase again. A trough marks the “pit of a recession” , but – the start of an expansionary phase of the business cycle. The Fed lowers interest rates.
12. The Great Depression [How Bad?] 100,000 businesses failed. Stock values fell from $89 billion to $15 billion. From 381 to 41. $74 billion was lost. 25% unemployment rate [15 million](125 million in the U.S.) [Unemployment was 3% in 1929.] Unemployment stayed above 14.3% from 1931-1940. Average unemployment was 18% 10,797 banks failed out of over 25,000, taking the life savings of 9 million people.
13. Smoot-Hawley Tariff of 1930 Smoot-Hawley Tariff of 1930 -so high it decreased imports 60% and hurt all international trade. International trade plummeted from $60 billion in 1928 to $25 billion in 1938. Smoot-Hawley Tariffs on over 12,000 products went up. Agricultural tariffs went from 20% to 34%, clocks from 45% to 55%, woolen products from 50% to 60%, wines, spirits, & beverages from 36% to 47%, corn and butter tariffs were doubled, over 800 production items were taxed. By 1933, world trade was about 1/3 of the 1929 level. All nations were losers. This policy put the “Great” in the “Great Depression” . Reed Smoot Willis Hawley
18. Six Million “Rosie the Riveters ” [ when everything came up “Rosies”] World War II Production of these items brought us out of the Great Depression. 300,000 warplanes 124,000 ships 289,000 combat vehicles and tanks 36 billion yards of cotton goods 41 billion rounds of ammunition 2.4 million military trucks 111,527 tank guns and howitzers [I n 1944, war spending was 40 % of GDP ] $288 billion was spent on the war, $100 billion in the first six months. Unemployment hit an all-time low of 1.2% and personal savings were 25.5%
20. Unemployment , Inflation , & Business Cycles Inflation – “too many dollars chasing too few goods.” Deflation – “too few dollars chasing too many goods.”