The document contains summaries and graphs related to key macroeconomic concepts including:
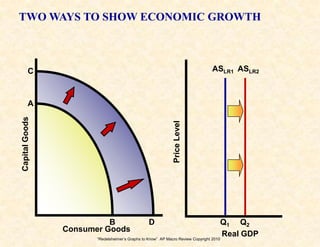
1) The production possibilities curve shows opportunity costs and efficiency levels of an economy.
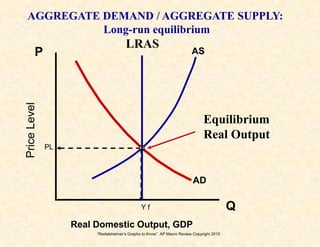
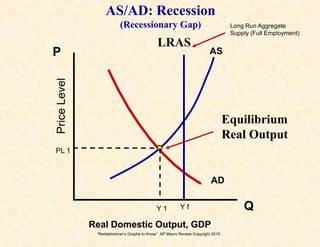
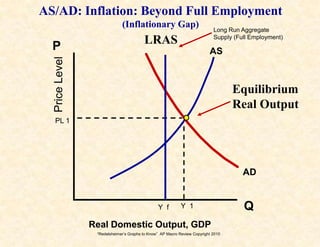
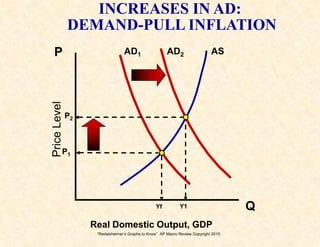
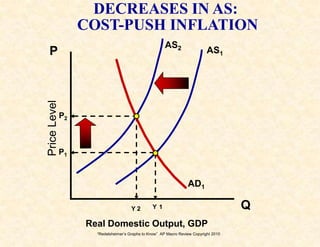
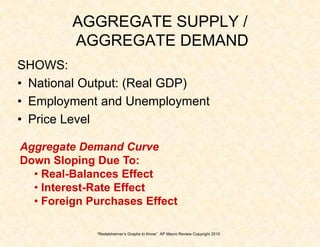
2) The aggregate demand/aggregate supply model shows equilibrium, recession, and inflation conditions based on the relationship between output and price levels.
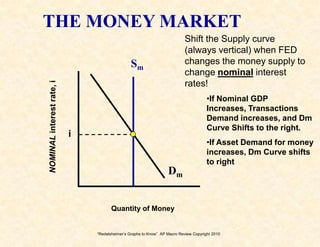
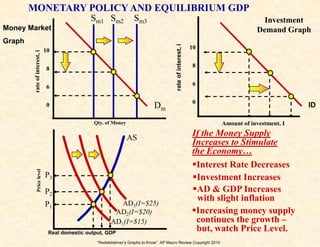
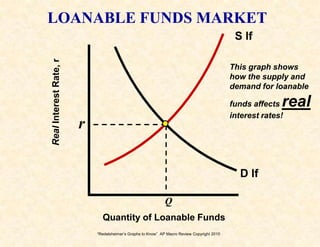
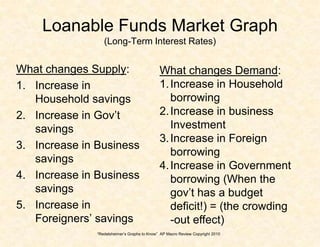
3) The money market and loanable funds market graphs demonstrate how interest rates are determined by the supply and demand for money and loanable funds.
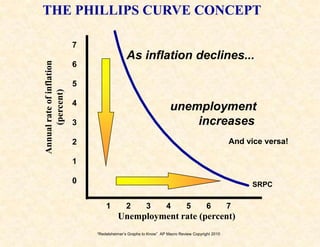
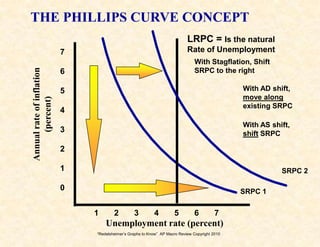
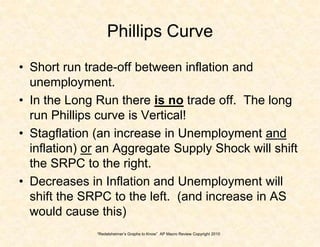
4) The Phillips curve illustrates the relationship between inflation and unemployment in the short and long run.


![MACROECONOMİC CONCEPTS FOR AP EXAMS MASSIVE_MACRO_REVIEW[1].ppt](https://cdn.slidesharecdn.com/ss_thumbnails/massivemacroreview1-240914123444-3484593f-thumbnail.jpg?width=640&height=640&fit=bounds)


