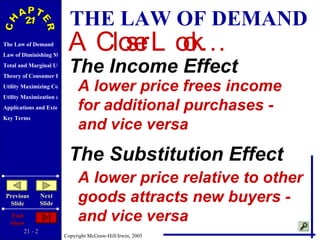
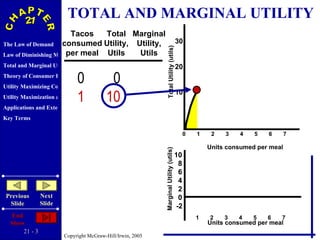
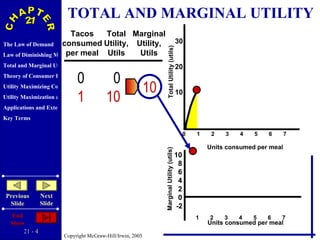
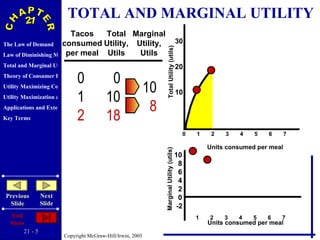
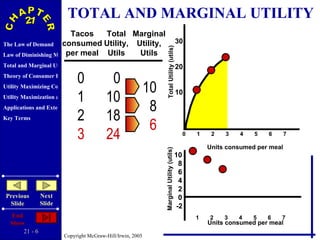
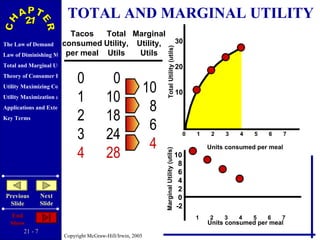
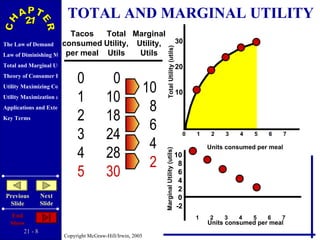
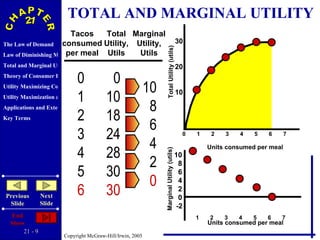
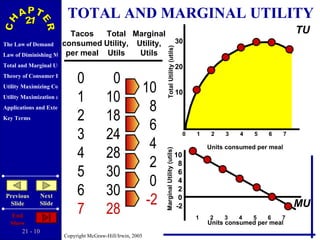
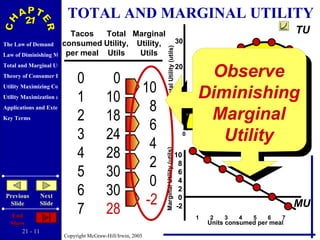
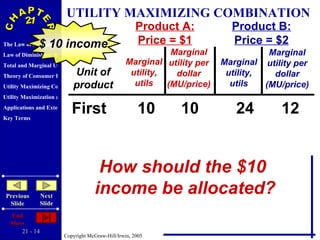
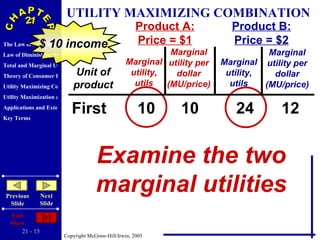
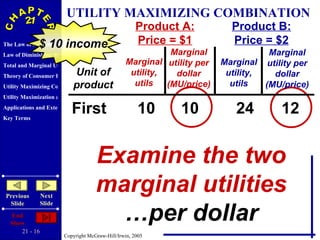
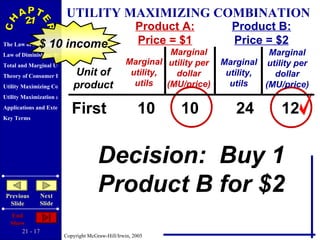
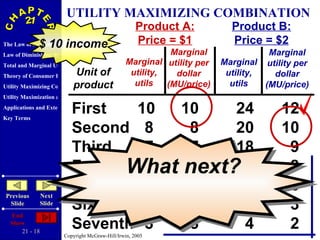
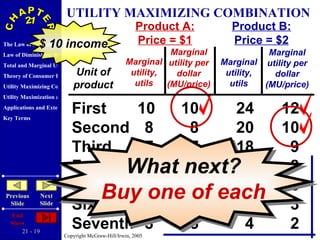
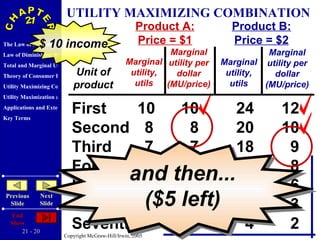
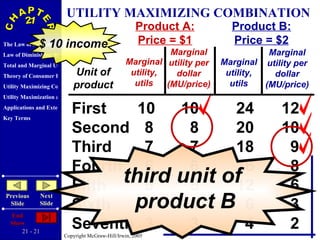
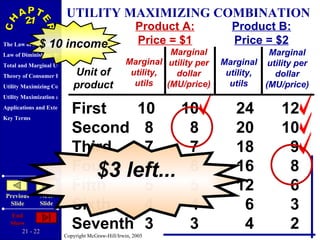
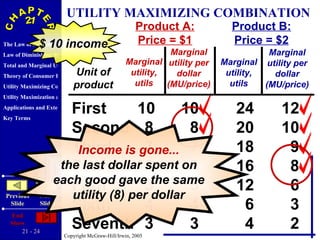
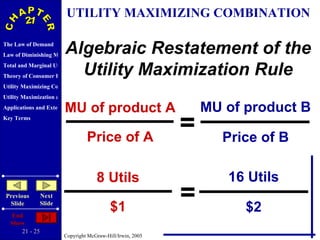
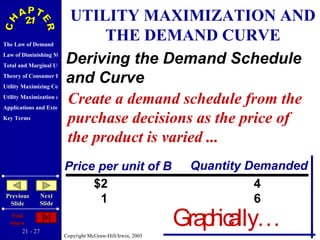
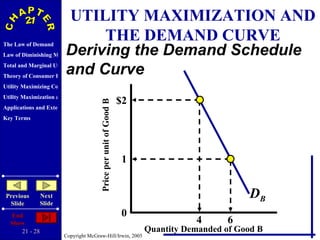
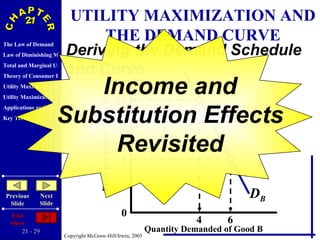
Consumer Behavior and Utility Maximization 21 C H A P T E R
THE LAW OF DEMAND A Closer Look… The Income Effect  A lower price frees income for additional purchases - and vice versa The Substitution Effect  A lower price relative to other goods attracts new buyers - and vice versa
TOTAL AND MARGINAL UTILITY Tacos consumed per meal Total Utility, Utils Marginal Utility, Utils 0 1 0 10 Units consumed per meal Units consumed per meal 30 20 10 Total Utility (utils) Marginal Utility (utils) 10 8 6 4 2 0 -2 0  1  2  3  4  5  6  7 1  2  3  4  5  6  7
TOTAL AND MARGINAL UTILITY Tacos consumed per meal Total Utility, Utils Marginal Utility, Utils 0 1 0 10 10 Units consumed per meal Units consumed per meal 30 20 10 Total Utility (utils) Marginal Utility (utils) 10 8 6 4 2 0 -2 0  1  2  3  4  5  6  7 1  2  3  4  5  6  7
TOTAL AND MARGINAL UTILITY Tacos consumed per meal Total Utility, Utils Marginal Utility, Utils 0 1 2 0 10 18 10 8 Units consumed per meal Units consumed per meal 30 20 10 Total Utility (utils) Marginal Utility (utils) 10 8 6 4 2 0 -2 0  1  2  3  4  5  6  7 1  2  3  4  5  6  7
TOTAL AND MARGINAL UTILITY Tacos consumed per meal Total Utility, Utils Marginal Utility, Utils 0 1 2 3 0 10 18 24 10 8 6 0  1  2  3  4  5  6  7 Units consumed per meal Units consumed per meal 30 20 10 Total Utility (utils) Marginal Utility (utils) 10 8 6 4 2 0 -2 1  2  3  4  5  6  7
TOTAL AND MARGINAL UTILITY Tacos consumed per meal Total Utility, Utils Marginal Utility, Utils 0 1 2 3 4 0 10 18 24 28 10 8 6 4 Units consumed per meal Units consumed per meal 30 20 10 Total Utility (utils) Marginal Utility (utils) 10 8 6 4 2 0 -2 0  1  2  3  4  5  6  7 1  2  3  4  5  6  7
TOTAL AND MARGINAL UTILITY Tacos consumed per meal Total Utility, Utils Marginal Utility, Utils 0 1 2 3 4 5 0 10 18 24 28 30 10 8 6 4 2 Units consumed per meal Units consumed per meal 30 20 10 Total Utility (utils) Marginal Utility (utils) 10 8 6 4 2 0 -2 0  1  2  3  4  5  6  7 1  2  3  4  5  6  7
TOTAL AND MARGINAL UTILITY Tacos consumed per meal Total Utility, Utils Marginal Utility, Utils 0 1 2 3 4 5 6 0 10 18 24 28 30 30 10 8 6 4 2 0 Units consumed per meal Units consumed per meal 30 20 10 Total Utility (utils) Marginal Utility (utils) 10 8 6 4 2 0 -2 0  1  2  3  4  5  6  7 1  2  3  4  5  6  7
TOTAL AND MARGINAL UTILITY Tacos consumed per meal Total Utility, Utils Marginal Utility, Utils 0 1 2 3 4 5 6 7 0 10 18 24 28 30 30 28 10 8 6 4 2 0 -2 Units consumed per meal Units consumed per meal 30 20 10 Total Utility (utils) Marginal Utility (utils) 10 8 6 4 2 0 -2 TU MU 0  1  2  3  4  5  6  7 1  2  3  4  5  6  7
TOTAL AND MARGINAL UTILITY Tacos consumed per meal Total Utility, Utils Marginal Utility, Utils 0 1 2 3 4 5 6 7 0 10 18 24 28 30 30 28 10 8 6 4 2 0 -2 Units consumed per meal Units consumed per meal 30 20 10 Total Utility (utils) Marginal Utility (utils) 10 8 6 4 2 0 -2 TU MU 0  1  2  3  4  5  6  7 1  2  3  4  5  6  7 Observe Diminishing Marginal Utility
THEORY OF CONSUMER BEHAVIOR Consumer Choice and  Budget Constraint Subject to a Budget  Constraint
THEORY OF CONSUMER BEHAVIOR Utility Maximizing Rule The consumer’s money income should be allocated so that the last dollar spent on each product yields the same amount of extra (marginal) utility. Illustrated...
First  10   10  24   12 UTILITY MAXIMIZING COMBINATION How should the $10  income be allocated? Unit of product Product A: Price = $1 Product B: Price = $2 Marginal utility, utils Marginal utility per dollar (MU/price) Marginal utility, utils Marginal utility per dollar (MU/price) $ 10 income
First  10   10  24   12 UTILITY MAXIMIZING COMBINATION Examine the two marginal utilities Unit of product Product A: Price = $1 Product B: Price = $2 Marginal utility, utils Marginal utility per dollar (MU/price) Marginal utility, utils Marginal utility per dollar (MU/price) $ 10 income
First  10   10  24   12 UTILITY MAXIMIZING COMBINATION Examine the two marginal utilities … per dollar Unit of product Product A: Price = $1 Product B: Price = $2 Marginal utility, utils Marginal utility per dollar (MU/price) Marginal utility, utils Marginal utility per dollar (MU/price) $ 10 income
First  10   10  24   12 UTILITY MAXIMIZING COMBINATION Decision:  Buy 1 Product B for $2 Unit of product Product A: Price = $1 Product B: Price = $2 Marginal utility, utils Marginal utility per dollar (MU/price) Marginal utility, utils Marginal utility per dollar (MU/price) $ 10 income
First  10   10  24   12 Second   8   8  20   10 Third   7   7  18   9 Fourth   6   6  16   8 Fifth   5   5  12   6 Sixth   4   4   6   3 Seventh   3   3   4   2 UTILITY MAXIMIZING COMBINATION Unit of product Product A: Price = $1 Product B: Price = $2 Marginal utility, utils Marginal utility per dollar (MU/price) Marginal utility, utils Marginal utility per dollar (MU/price) $ 10 income What next?
First  10   10  24   12 Second   8   8  20   10 Third   7   7  18   9 Fourth   6   6  16   8 Fifth   5   5  12   6 Sixth   4   4   6   3 Seventh   3   3   4   2 UTILITY MAXIMIZING COMBINATION Unit of product Product A: Price = $1 Product B: Price = $2 Marginal utility, utils Marginal utility per dollar (MU/price) Marginal utility, utils Marginal utility per dollar (MU/price) $ 10 income What next? Buy one of each
First  10   10  24   12 Second   8   8  20   10 Third   7   7  18   9 Fourth   6   6  16   8 Fifth   5   5  12   6 Sixth   4   4   6   3 Seventh   3   3   4   2 UTILITY MAXIMIZING COMBINATION Unit of product Product A: Price = $1 Product B: Price = $2 Marginal utility, utils Marginal utility per dollar (MU/price) Marginal utility, utils Marginal utility per dollar (MU/price) $ 10 income and then... ($5 left)
First  10   10  24   12 Second   8   8  20   10 Third   7   7  18   9 Fourth   6   6  16   8 Fifth   5   5  12   6 Sixth   4   4   6   3 Seventh   3   3   4   2 UTILITY MAXIMIZING COMBINATION Unit of product Product A: Price = $1 Product B: Price = $2 Marginal utility, utils Marginal utility per dollar (MU/price) Marginal utility, utils Marginal utility per dollar (MU/price) $ 10 income third unit of  product B
First  10   10  24   12 Second   8   8  20   10 Third   7   7  18   9 Fourth   6   6  16   8 Fifth   5   5  12   6 Sixth   4   4   6   3 Seventh   3   3   4   2 UTILITY MAXIMIZING COMBINATION Unit of product Product A: Price = $1 Product B: Price = $2 Marginal utility, utils Marginal utility per dollar (MU/price) Marginal utility, utils Marginal utility per dollar (MU/price) $ 10 income $3 left...
First  10   10  24   12 Second   8   8  20   10 Third   7   7  18   9 Fourth   6   6  16   8 Fifth   5   5  12   6 Sixth   4   4   6   3 Seventh   3   3   4   2 UTILITY MAXIMIZING COMBINATION Unit of product Product A: Price = $1 Product B: Price = $2 Marginal utility, utils Marginal utility per dollar (MU/price) Marginal utility, utils Marginal utility per dollar (MU/price) $ 10 income $3 left... Buy both!
First  10   10  24   12 Second   8   8  20   10 Third   7   7  18   9 Fourth   6   6  16   8 Fifth   5   5  12   6 Sixth   4   4   6   3 Seventh   3   3   4   2 UTILITY MAXIMIZING COMBINATION Unit of product Product A: Price = $1 Product B: Price = $2 Marginal utility, utils Marginal utility per dollar (MU/price) Marginal utility, utils Marginal utility per dollar (MU/price) $ 10 income Income is gone... the last dollar spent on each good gave the same utility (8) per dollar
Algebraic Restatement of the Utility Maximization Rule = UTILITY MAXIMIZING COMBINATION MU of product A Price of A MU of product B Price of B 8 Utils $1 16 Utils $2 =
UTILITY MAXIMIZATION AND THE DEMAND CURVE Deriving the Demand Schedule and Curve
UTILITY MAXIMIZATION AND THE DEMAND CURVE Create a demand schedule from the purchase decisions as the price of the product is varied ... Price per unit of B  Quantity Demanded  $2 4 1 6 Graphically… Deriving the Demand Schedule and Curve
UTILITY MAXIMIZATION AND THE DEMAND CURVE Deriving the Demand Schedule and Curve Quantity Demanded of Good B Price per unit of Good B $2 1 0 4 6 D B
UTILITY MAXIMIZATION AND THE DEMAND CURVE Deriving the Demand Schedule and Curve Quantity Demanded of Good B Price per unit of Good B $2 1 0 4 6 D B Income and Substitution Effects Revisited
APPLICATIONS AND EXTENSIONS Vending Machines The Diamond-Water Paradox
income effect substitution effect utility total utility marginal utility law of diminishing marginal utility rational behavior budget constraint utility-maximizing rule KEY TERMS END BACK Copyright McGraw-Hill/Irwin, Inc.  2005
Next… Chapter 22 The Costs Of Production Indifference Curve Analysis

AP MIcro - Consumer Behavior Ch. 21

  • 1.
    Consumer Behavior andUtility Maximization 21 C H A P T E R
  • 2.
    THE LAW OFDEMAND A Closer Look… The Income Effect A lower price frees income for additional purchases - and vice versa The Substitution Effect A lower price relative to other goods attracts new buyers - and vice versa
  • 3.
    TOTAL AND MARGINALUTILITY Tacos consumed per meal Total Utility, Utils Marginal Utility, Utils 0 1 0 10 Units consumed per meal Units consumed per meal 30 20 10 Total Utility (utils) Marginal Utility (utils) 10 8 6 4 2 0 -2 0 1 2 3 4 5 6 7 1 2 3 4 5 6 7
  • 4.
    TOTAL AND MARGINALUTILITY Tacos consumed per meal Total Utility, Utils Marginal Utility, Utils 0 1 0 10 10 Units consumed per meal Units consumed per meal 30 20 10 Total Utility (utils) Marginal Utility (utils) 10 8 6 4 2 0 -2 0 1 2 3 4 5 6 7 1 2 3 4 5 6 7
  • 5.
    TOTAL AND MARGINALUTILITY Tacos consumed per meal Total Utility, Utils Marginal Utility, Utils 0 1 2 0 10 18 10 8 Units consumed per meal Units consumed per meal 30 20 10 Total Utility (utils) Marginal Utility (utils) 10 8 6 4 2 0 -2 0 1 2 3 4 5 6 7 1 2 3 4 5 6 7
  • 6.
    TOTAL AND MARGINALUTILITY Tacos consumed per meal Total Utility, Utils Marginal Utility, Utils 0 1 2 3 0 10 18 24 10 8 6 0 1 2 3 4 5 6 7 Units consumed per meal Units consumed per meal 30 20 10 Total Utility (utils) Marginal Utility (utils) 10 8 6 4 2 0 -2 1 2 3 4 5 6 7
  • 7.
    TOTAL AND MARGINALUTILITY Tacos consumed per meal Total Utility, Utils Marginal Utility, Utils 0 1 2 3 4 0 10 18 24 28 10 8 6 4 Units consumed per meal Units consumed per meal 30 20 10 Total Utility (utils) Marginal Utility (utils) 10 8 6 4 2 0 -2 0 1 2 3 4 5 6 7 1 2 3 4 5 6 7
  • 8.
    TOTAL AND MARGINALUTILITY Tacos consumed per meal Total Utility, Utils Marginal Utility, Utils 0 1 2 3 4 5 0 10 18 24 28 30 10 8 6 4 2 Units consumed per meal Units consumed per meal 30 20 10 Total Utility (utils) Marginal Utility (utils) 10 8 6 4 2 0 -2 0 1 2 3 4 5 6 7 1 2 3 4 5 6 7
  • 9.
    TOTAL AND MARGINALUTILITY Tacos consumed per meal Total Utility, Utils Marginal Utility, Utils 0 1 2 3 4 5 6 0 10 18 24 28 30 30 10 8 6 4 2 0 Units consumed per meal Units consumed per meal 30 20 10 Total Utility (utils) Marginal Utility (utils) 10 8 6 4 2 0 -2 0 1 2 3 4 5 6 7 1 2 3 4 5 6 7
  • 10.
    TOTAL AND MARGINALUTILITY Tacos consumed per meal Total Utility, Utils Marginal Utility, Utils 0 1 2 3 4 5 6 7 0 10 18 24 28 30 30 28 10 8 6 4 2 0 -2 Units consumed per meal Units consumed per meal 30 20 10 Total Utility (utils) Marginal Utility (utils) 10 8 6 4 2 0 -2 TU MU 0 1 2 3 4 5 6 7 1 2 3 4 5 6 7
  • 11.
    TOTAL AND MARGINALUTILITY Tacos consumed per meal Total Utility, Utils Marginal Utility, Utils 0 1 2 3 4 5 6 7 0 10 18 24 28 30 30 28 10 8 6 4 2 0 -2 Units consumed per meal Units consumed per meal 30 20 10 Total Utility (utils) Marginal Utility (utils) 10 8 6 4 2 0 -2 TU MU 0 1 2 3 4 5 6 7 1 2 3 4 5 6 7 Observe Diminishing Marginal Utility
  • 12.
    THEORY OF CONSUMERBEHAVIOR Consumer Choice and Budget Constraint Subject to a Budget Constraint
  • 13.
    THEORY OF CONSUMERBEHAVIOR Utility Maximizing Rule The consumer’s money income should be allocated so that the last dollar spent on each product yields the same amount of extra (marginal) utility. Illustrated...
  • 14.
    First 10 10 24 12 UTILITY MAXIMIZING COMBINATION How should the $10 income be allocated? Unit of product Product A: Price = $1 Product B: Price = $2 Marginal utility, utils Marginal utility per dollar (MU/price) Marginal utility, utils Marginal utility per dollar (MU/price) $ 10 income
  • 15.
    First 10 10 24 12 UTILITY MAXIMIZING COMBINATION Examine the two marginal utilities Unit of product Product A: Price = $1 Product B: Price = $2 Marginal utility, utils Marginal utility per dollar (MU/price) Marginal utility, utils Marginal utility per dollar (MU/price) $ 10 income
  • 16.
    First 10 10 24 12 UTILITY MAXIMIZING COMBINATION Examine the two marginal utilities … per dollar Unit of product Product A: Price = $1 Product B: Price = $2 Marginal utility, utils Marginal utility per dollar (MU/price) Marginal utility, utils Marginal utility per dollar (MU/price) $ 10 income
  • 17.
    First 10 10 24 12 UTILITY MAXIMIZING COMBINATION Decision: Buy 1 Product B for $2 Unit of product Product A: Price = $1 Product B: Price = $2 Marginal utility, utils Marginal utility per dollar (MU/price) Marginal utility, utils Marginal utility per dollar (MU/price) $ 10 income
  • 18.
    First 10 10 24 12 Second 8 8 20 10 Third 7 7 18 9 Fourth 6 6 16 8 Fifth 5 5 12 6 Sixth 4 4 6 3 Seventh 3 3 4 2 UTILITY MAXIMIZING COMBINATION Unit of product Product A: Price = $1 Product B: Price = $2 Marginal utility, utils Marginal utility per dollar (MU/price) Marginal utility, utils Marginal utility per dollar (MU/price) $ 10 income What next?
  • 19.
    First 10 10 24 12 Second 8 8 20 10 Third 7 7 18 9 Fourth 6 6 16 8 Fifth 5 5 12 6 Sixth 4 4 6 3 Seventh 3 3 4 2 UTILITY MAXIMIZING COMBINATION Unit of product Product A: Price = $1 Product B: Price = $2 Marginal utility, utils Marginal utility per dollar (MU/price) Marginal utility, utils Marginal utility per dollar (MU/price) $ 10 income What next? Buy one of each
  • 20.
    First 10 10 24 12 Second 8 8 20 10 Third 7 7 18 9 Fourth 6 6 16 8 Fifth 5 5 12 6 Sixth 4 4 6 3 Seventh 3 3 4 2 UTILITY MAXIMIZING COMBINATION Unit of product Product A: Price = $1 Product B: Price = $2 Marginal utility, utils Marginal utility per dollar (MU/price) Marginal utility, utils Marginal utility per dollar (MU/price) $ 10 income and then... ($5 left)
  • 21.
    First 10 10 24 12 Second 8 8 20 10 Third 7 7 18 9 Fourth 6 6 16 8 Fifth 5 5 12 6 Sixth 4 4 6 3 Seventh 3 3 4 2 UTILITY MAXIMIZING COMBINATION Unit of product Product A: Price = $1 Product B: Price = $2 Marginal utility, utils Marginal utility per dollar (MU/price) Marginal utility, utils Marginal utility per dollar (MU/price) $ 10 income third unit of product B
  • 22.
    First 10 10 24 12 Second 8 8 20 10 Third 7 7 18 9 Fourth 6 6 16 8 Fifth 5 5 12 6 Sixth 4 4 6 3 Seventh 3 3 4 2 UTILITY MAXIMIZING COMBINATION Unit of product Product A: Price = $1 Product B: Price = $2 Marginal utility, utils Marginal utility per dollar (MU/price) Marginal utility, utils Marginal utility per dollar (MU/price) $ 10 income $3 left...
  • 23.
    First 10 10 24 12 Second 8 8 20 10 Third 7 7 18 9 Fourth 6 6 16 8 Fifth 5 5 12 6 Sixth 4 4 6 3 Seventh 3 3 4 2 UTILITY MAXIMIZING COMBINATION Unit of product Product A: Price = $1 Product B: Price = $2 Marginal utility, utils Marginal utility per dollar (MU/price) Marginal utility, utils Marginal utility per dollar (MU/price) $ 10 income $3 left... Buy both!
  • 24.
    First 10 10 24 12 Second 8 8 20 10 Third 7 7 18 9 Fourth 6 6 16 8 Fifth 5 5 12 6 Sixth 4 4 6 3 Seventh 3 3 4 2 UTILITY MAXIMIZING COMBINATION Unit of product Product A: Price = $1 Product B: Price = $2 Marginal utility, utils Marginal utility per dollar (MU/price) Marginal utility, utils Marginal utility per dollar (MU/price) $ 10 income Income is gone... the last dollar spent on each good gave the same utility (8) per dollar
  • 25.
    Algebraic Restatement ofthe Utility Maximization Rule = UTILITY MAXIMIZING COMBINATION MU of product A Price of A MU of product B Price of B 8 Utils $1 16 Utils $2 =
  • 26.
    UTILITY MAXIMIZATION ANDTHE DEMAND CURVE Deriving the Demand Schedule and Curve
  • 27.
    UTILITY MAXIMIZATION ANDTHE DEMAND CURVE Create a demand schedule from the purchase decisions as the price of the product is varied ... Price per unit of B Quantity Demanded $2 4 1 6 Graphically… Deriving the Demand Schedule and Curve
  • 28.
    UTILITY MAXIMIZATION ANDTHE DEMAND CURVE Deriving the Demand Schedule and Curve Quantity Demanded of Good B Price per unit of Good B $2 1 0 4 6 D B
  • 29.
    UTILITY MAXIMIZATION ANDTHE DEMAND CURVE Deriving the Demand Schedule and Curve Quantity Demanded of Good B Price per unit of Good B $2 1 0 4 6 D B Income and Substitution Effects Revisited
  • 30.
    APPLICATIONS AND EXTENSIONSVending Machines The Diamond-Water Paradox
  • 31.
    income effect substitutioneffect utility total utility marginal utility law of diminishing marginal utility rational behavior budget constraint utility-maximizing rule KEY TERMS END BACK Copyright McGraw-Hill/Irwin, Inc. 2005
  • 32.
    Next… Chapter 22The Costs Of Production Indifference Curve Analysis