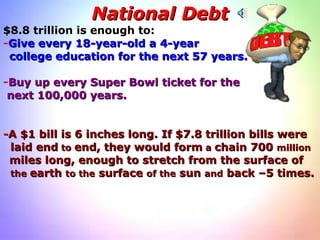
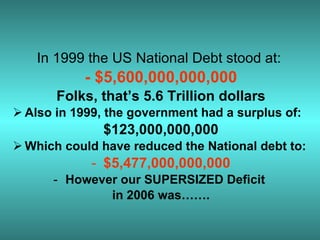
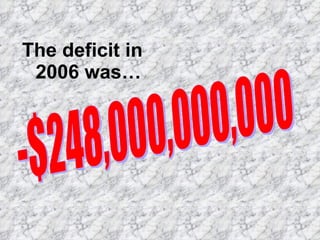
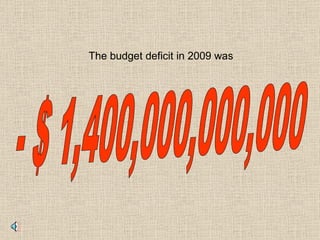
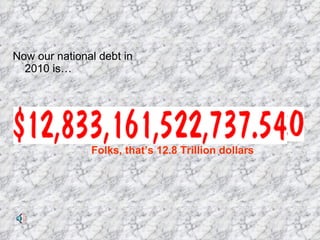
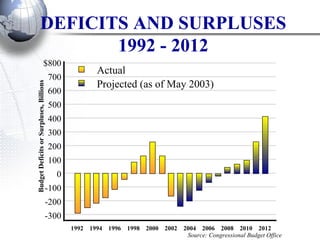
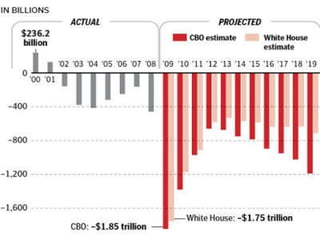
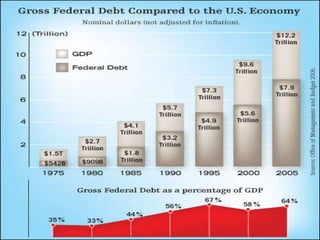
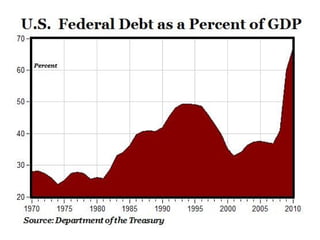
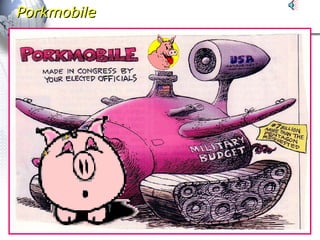
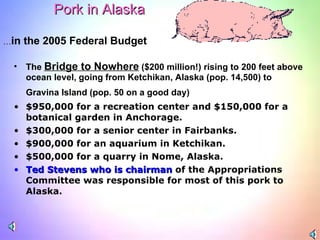
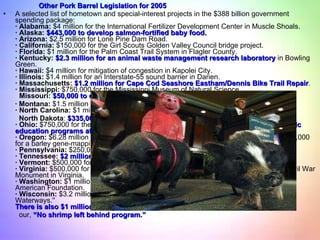
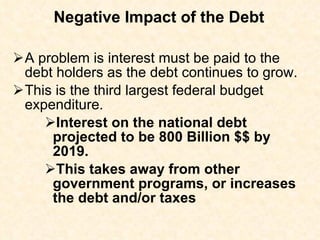
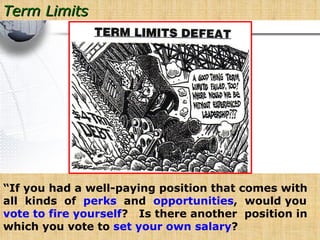
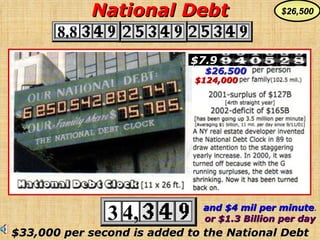
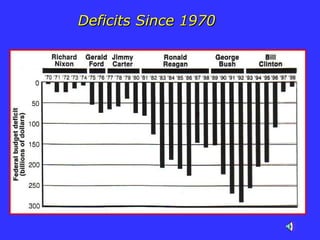
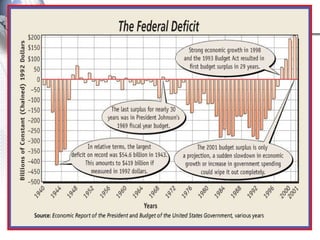
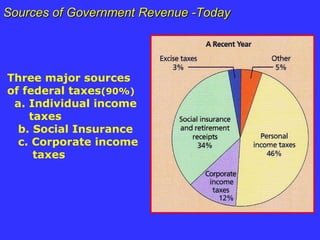
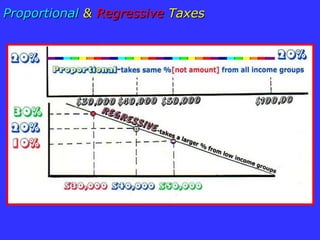
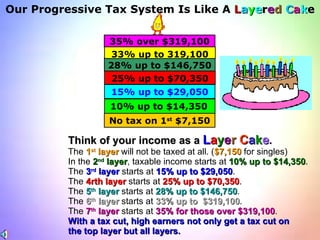
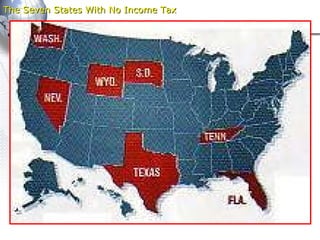
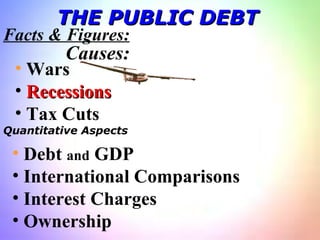
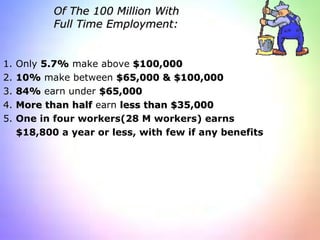
The document discusses national debt and deficits. It notes that the US national debt was $5.6 trillion in 1999 and $12.8 trillion in 2010. It explains that debt is the accumulation of yearly deficits and surpluses, with deficits added to the debt and surpluses reducing it. The document also discusses "pork barrel" spending projects by Congress and debates around taxation and proportional versus progressive tax systems.


![The “ Debt ” and The “Deficit ” Deficit ($1.4 T .) Debt ($12.3 trillion) Reasons for Debt 1. Lack of political will 2. Tax cuts 3. Recessions (transfers) 4. Wartime financing Attention Deficit Hyperactivity Disorder [ADHD] Congressmen have trouble focusing attention on the deficit. $ 12.3](https://image.slidesharecdn.com/thenationaldebt-110510132003-phpapp01/85/The-National-Debt-16-320.jpg)

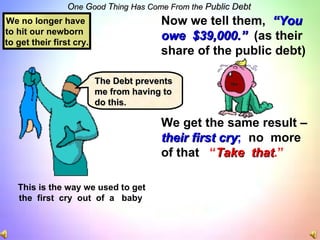
![The “no” answer entails three points . 1. Refinancing –It refinances the debt by selling new bonds and uses the proceeds to pay off holders of the bonds. 2. Taxation – if bankruptcy were imminent the G could always raise taxes. 3. Creating Money – bankruptcy could be avoided by printing the money ( inflationary ). I’m not paying no $39,000 and I hope you will not either. Economic Implications of the Debt: False Issues [The “G” doesn’t have to pay the entire debt off because it never “dies.” ] [The “G” will live forever so it will keep “rolling it over in perpetuity” ] Going Bankrupt? Whew! $39,000 each. Where our debt comes from?](https://image.slidesharecdn.com/thenationaldebt-110510132003-phpapp01/85/The-National-Debt-24-320.jpg)
![Income Distribution [the debt is transferred from all taxpayers to the bond holders [ the rich], so more income disparity] Incentives – larger taxes dampen incentives to bear risk, to innovate, to invest, or just to work. * Children will not inherit as large of a “national factory” Foreign-Owned Public Debt External Public Debt Economic Issues F rom T he Debt Abe Lincoln, with the Debt at $1 billion in 1864, said, “Men can readily perceive that they cannot be much oppressed by a debt which they owe themselves.”](https://image.slidesharecdn.com/thenationaldebt-110510132003-phpapp01/85/The-National-Debt-28-320.jpg)
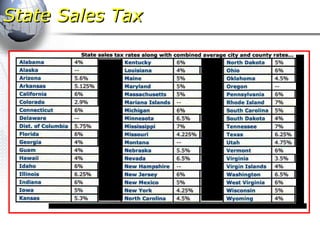
![Tax Debate (continued) T ax B ased O n A Proportional (“Flat Rate”) T ax [“20%”] $ 200 (tax of $ 40 so $ 160 to live on) [ now less likely to get in crime] $ 350 (tax of $ 70 so +$ 280 to live on) [ also lessens crime potential] $ 500 (tax of $ 100 so +$ 400 to live on) $ 1,000 (tax of $ 200 so +$ 800 to live on $ 5,000 (tax of $ 1,000 so +$ 4,000 to live on) Progressive Tax System No tax up to $7,150, then 10%(The poor group made $10,400 a year) 0%....................Up to $7,150 10%...........$7,151 - $14,300 15%.........$14,301 - $29,050 25%.........$29,051 - $73,550 28%.......$73,551 - $146,750 33%.....$146,751 - $319,100 35%.....$319,101 +](https://image.slidesharecdn.com/thenationaldebt-110510132003-phpapp01/85/The-National-Debt-39-320.jpg)
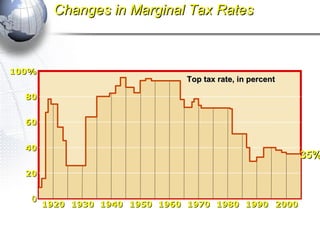
![Marginal Tax Rate 1913-2005 Top Marginal Tax Rates Year Tax Rate 1900 No Tax 1914 1% [over $3,000] [Only 1 in 270 paid this tax at all] 1930 30% [1 in every 32 was now paying taxes] 1940 81% [1 in every 3 was paying taxes] 1943 * Paycheck withholding (by the boss) was launched to stop cheating. 1950 91% 1970 70% [E veryone was paying with taxable Y] 1980 70% 2002 38.6% 2005 35% Medicare tax – 1.45% for an individual [ 2.9% for self employed ] for every dollar earned . Harrison Ford – received $25 million for 20 days work on a movie . 1.45% of $ 25 million = $362,500 x 2 = $725,000 medicare tax. [Over his 35 years on the Big Screen, his films grossed over $10 bil . Jim Carrey – gets $20 million per movie, so his tax is $580,000 . [1.45% of $20 million = $290,000 x 2 = $580,000 .]](https://image.slidesharecdn.com/thenationaldebt-110510132003-phpapp01/85/The-National-Debt-43-320.jpg)
![Nation’s Wealthiest 5 % Pay 55 % of Income Taxes Ave. Tax Rate Top 1 % ($293,000) paid over 1/3 of all taxes – average 28% Top 5 % (+ $121,000; 6.3 mil.) paid 55% - average 24% Top 10 % (+80,000) paid 62% of all taxes – average 21.4% Top 25 % (+$50,000) paid 81% of all taxes – average 18% Top 50 % (+$25,000) paid 96% of all taxes – average 16% Bottom 50 % (63 mil. earned -$23,000) paid o nly 4 % of all taxes. There are 7.5 million millionaires & 341 billionaires . [691 in world] 40 millionaires are in the U.S. Senate](https://image.slidesharecdn.com/thenationaldebt-110510132003-phpapp01/85/The-National-Debt-44-320.jpg)
![Billionaires of the World in 2003 [The U.S. has 50%] 691 in 2004 Worth 2.2 T [341 in U.S.]](https://image.slidesharecdn.com/thenationaldebt-110510132003-phpapp01/85/The-National-Debt-45-320.jpg)


![Final presentation 1[1]](https://cdn.slidesharecdn.com/ss_thumbnails/finalpresentation-11-111209132310-phpapp02-thumbnail.jpg?width=640&height=640&fit=bounds)

![Final presentation 1[1]](https://cdn.slidesharecdn.com/ss_thumbnails/finalpresentation-11-111209131842-phpapp02-thumbnail.jpg?width=640&height=640&fit=bounds)


