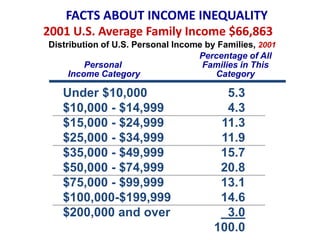
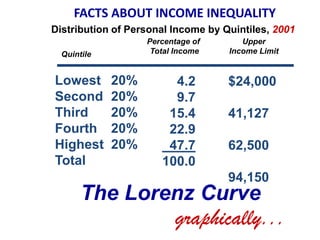
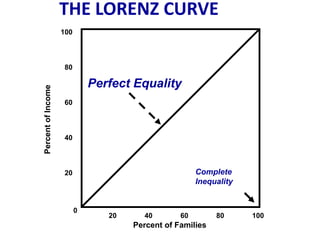
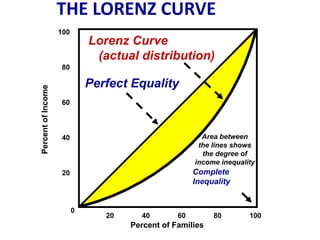
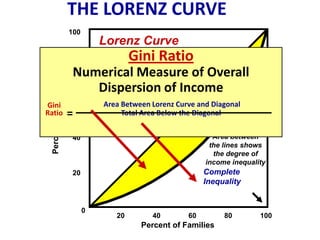
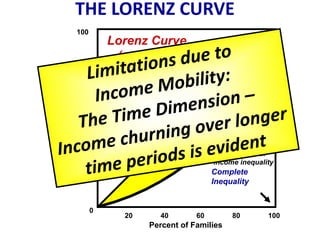
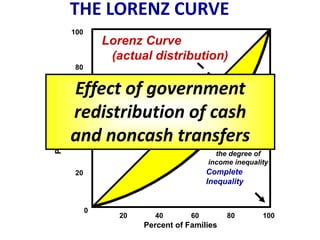
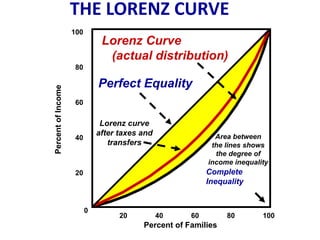
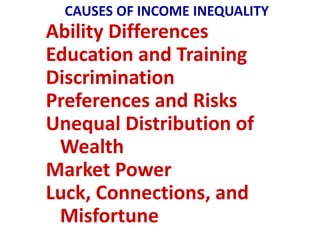
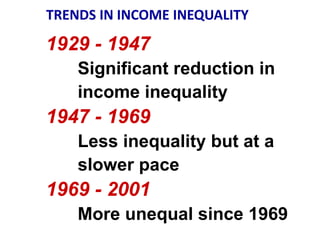
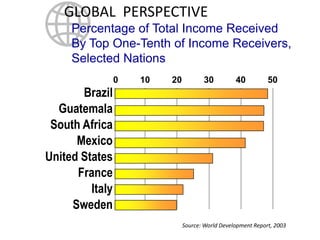
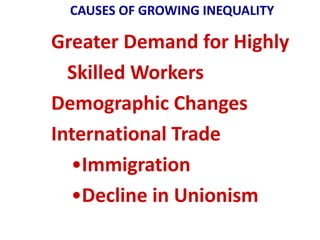
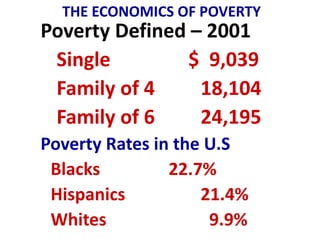
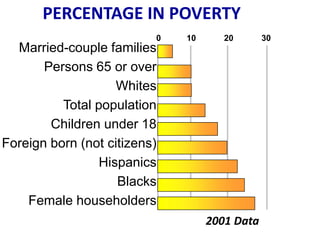
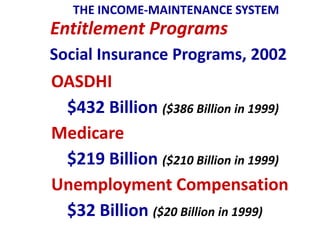
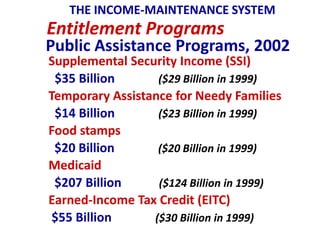
34
CHAPTER


INCOME INEQUALITY
   AND POVERTY
FACTS ABOUT INCOME INEQUALITY
2001 U.S. Average Family Income $66,863
Distribution of U.S. Personal Income by Families, 2001
                                   Percentage of All
         Personal                   Families in This
     Income Category                   Category

   Under $10,000                         5.3
   $10,000 - $14,999                     4.3
   $15,000 - $24,999                    11.3
   $25,000 - $34,999                    11.9
   $35,000 - $49,999                    15.7
   $50,000 - $74,999                    20.8
   $75,000 - $99,999                    13.1
   $100,000-$199,999                    14.6
   $200,000 and over                     3.0
                                       100.0
FACTS ABOUT INCOME INEQUALITY
Distribution of Personal Income by Quintiles, 2001
                   Percentage of       Upper
  Quintile          Total Income    Income Limit


Lowest       20%        4.2         $24,000
Second       20%        9.7
Third        20%       15.4         41,127
Fourth       20%       22.9
Highest      20%       47.7         62,500
Total                 100.0
                                    94,150
       The Lorenz Curve
                         graphically...
THE LORENZ CURVE
                    100


                     80

                              Perfect Equality
Percent of Income


                     60


                     40


                     20                                Complete
                                                       Inequality


                          0
                                 20     40        60        80      100
                                      Percent of Families
THE LORENZ CURVE
                    100
                              Lorenz Curve
                               (actual distribution)
                     80

                              Perfect Equality
Percent of Income


                     60


                     40                                  Area between
                                                        the lines shows
                                                         the degree of
                                                       income inequality
                     20                                Complete
                                                       Inequality


                          0
                                 20     40        60        80        100
                                      Percent of Families
THE LORENZ CURVE
                      100
                                Lorenz Curve
                                    Gini Ratio
                                 (actual distribution)
                       80
                       Numerical Measure of Overall
                          Perfect Equality
                          Dispersion of Income
  Percent of Income


Gini                   60       Area Between Lorenz Curve and Diagonal
Ratio                 =              Total Area Below the Diagonal


                       40                                     Area between
                                                             the lines shows
                                                              the degree of
                                                            income inequality
                       20                                   Complete
                                                            Inequality


                            0
                                   20        40        60        80        100
                                          Percent of Families
THE LORENZ CURVE
                    100
                              Lorenz Curve
                               (actual distribution)
                     80

                              Perfect Equality
Percent of Income


                     60


                     40                                  Area between
                                                        the lines shows
                                                         the degree of
                                                       income inequality
                     20                                Complete
                                                       Inequality


                          0
                                 20     40        60        80        100
                                      Percent of Families
THE LORENZ CURVE
                    100
                              Lorenz Curve
                               (actual distribution)
                     80

                              Perfect Equality
                    Effect of government
Percent of Income


                     60
                    redistribution of cash
                    and noncash transfers
                     40                                  Area between
                                                        the lines shows
                                                         the degree of
                                                       income inequality
                     20                                Complete
                                                       Inequality


                          0
                                 20     40        60        80        100
                                      Percent of Families
THE LORENZ CURVE
                    100
                               Lorenz Curve
                                (actual distribution)
                     80

                              Perfect Equality
Percent of Income


                     60

                               Lorenz curve
                              after taxes and                Area between
                     40
                                 transfers                  the lines shows
                                                             the degree of
                                                           income inequality
                     20                                    Complete
                                                           Inequality


                          0
                                    20          40    60        80        100
                                          Percent of Families
CAUSES OF INCOME INEQUALITY
Ability Differences
Education and Training
Discrimination
Preferences and Risks
Unequal Distribution of
 Wealth
Market Power
Luck, Connections, and
 Misfortune
TRENDS IN INCOME INEQUALITY

1929 - 1947
    Significant reduction in
    income inequality
1947 - 1969
    Less inequality but at a
    slower pace
1969 - 2001
    More unequal since 1969
GLOBAL PERSPECTIVE
     Percentage of Total Income Received
     By Top One-Tenth of Income Receivers,
     Selected Nations
                 0   10   20          30          40          50
       Brazil
  Guatemala
 South Africa
      Mexico
United States
      France
         Italy
     Sweden
                               Source: World Development Report, 2003
CAUSES OF GROWING INEQUALITY

Greater Demand for Highly
  Skilled Workers
Demographic Changes
International Trade
  •Immigration
  •Decline in Unionism
EQUALITY VERSUS EFFICIENCY
The Case for Equality
 Maximizing Total Utility
The Case for Inequality
 Incentives and Efficiency
Tradeoff Between Equality
 and Efficiency
THE ECONOMICS OF POVERTY
Poverty Defined – 2001
 Single        $ 9,039
 Family of 4     18,104
 Family of 6     24,195
Poverty Rates in the U.S
 Blacks         22.7%
 Hispanics          21.4%
 Whites              9.9%
THE ECONOMICS OF POVERTY
Incidence of Poverty
Poverty Rate
Poverty Trends
The “Invisible” Poor
 •Short-Periods of Time
 •Geographic Isolation
 •Politically Invisible –
  Are Easy to Ignore
PERCENTAGE IN POVERTY
                          0   10      20       30
  Married-couple families
       Persons 65 or over
                    Whites
          Total population
        Children under 18
Foreign born (not citizens)
                 Hispanics
                    Blacks
    Female householders
                                   2001 Data
THE INCOME-MAINTENANCE SYSTEM
Entitlement Programs
Social Insurance Programs, 2002
OASDHI
 $432 Billion ($386 Billion in 1999)
Medicare
 $219 Billion ($210 Billion in 1999)
Unemployment Compensation
 $32 Billion ($20 Billion in 1999)
THE INCOME-MAINTENANCE SYSTEM
Entitlement Programs
Public Assistance Programs, 2002
Supplemental Security Income (SSI)
 $35 Billion      ($29 Billion in 1999)
Temporary Assistance for Needy Families
 $14 Billion      ($23 Billion in 1999)
Food stamps
 $20 Billion      ($20 Billion in 1999)
Medicaid
 $207 Billion     ($124 Billion in 1999)
Earned-Income Tax Credit (EITC)
 $55 Billion     ($30 Billion in 1999)
WELFARE: GOALS AND CONFLICTS
Common Features
  •Minimum Annual Income
  •Benefit-Reduction Rate
Conflicts Among Goals
  •Eliminating Poverty
  •Maintaining Work
   Incentives
  •Holding Down Costs
WELFARE: GOALS AND CONFLICTS
Welfare Reform
Growing Government Dependence
Personal Responsibility Act 1996
Temporary Assistance to Needy
 Families
  •5-Year Lifetime Limit
  •Must Work After 2 Years
  •Reduced Food-Stamp Eligibility
  •Tightened Some Definitions
  •5-Year Waiting Period on New
   Legal Immigrants
income inequality                       unemployment compensation
Lorenz curve                            public assistance programs
Gini Ratio
                                        Supplemental Security Income
income mobility
                                          (SSI)
noncash transfers
equality-efficiency tradeoff            Temporary Assistance for
poverty rate                              Needy Families (TANF)
entitlement programs                    food stamp program
social insurance programs               Medicaid
OASDHI                                  earned-income tax credit
Medicare                                  (EITC)


    Copyright McGraw-Hill/Irwin, 2005                    BACK     END
Next:

Labor Market Institutions
and Issues:
Unionism, Discrimination,
Immigration
              Chapter 35

AP Micro Income Inequality

  • 1.
  • 2.
    FACTS ABOUT INCOMEINEQUALITY 2001 U.S. Average Family Income $66,863 Distribution of U.S. Personal Income by Families, 2001 Percentage of All Personal Families in This Income Category Category Under $10,000 5.3 $10,000 - $14,999 4.3 $15,000 - $24,999 11.3 $25,000 - $34,999 11.9 $35,000 - $49,999 15.7 $50,000 - $74,999 20.8 $75,000 - $99,999 13.1 $100,000-$199,999 14.6 $200,000 and over 3.0 100.0
  • 3.
    FACTS ABOUT INCOMEINEQUALITY Distribution of Personal Income by Quintiles, 2001 Percentage of Upper Quintile Total Income Income Limit Lowest 20% 4.2 $24,000 Second 20% 9.7 Third 20% 15.4 41,127 Fourth 20% 22.9 Highest 20% 47.7 62,500 Total 100.0 94,150 The Lorenz Curve graphically...
  • 4.
    THE LORENZ CURVE 100 80 Perfect Equality Percent of Income 60 40 20 Complete Inequality 0 20 40 60 80 100 Percent of Families
  • 5.
    THE LORENZ CURVE 100 Lorenz Curve (actual distribution) 80 Perfect Equality Percent of Income 60 40 Area between the lines shows the degree of income inequality 20 Complete Inequality 0 20 40 60 80 100 Percent of Families
  • 6.
    THE LORENZ CURVE 100 Lorenz Curve Gini Ratio (actual distribution) 80 Numerical Measure of Overall Perfect Equality Dispersion of Income Percent of Income Gini 60 Area Between Lorenz Curve and Diagonal Ratio = Total Area Below the Diagonal 40 Area between the lines shows the degree of income inequality 20 Complete Inequality 0 20 40 60 80 100 Percent of Families
  • 7.
    THE LORENZ CURVE 100 Lorenz Curve (actual distribution) 80 Perfect Equality Percent of Income 60 40 Area between the lines shows the degree of income inequality 20 Complete Inequality 0 20 40 60 80 100 Percent of Families
  • 8.
    THE LORENZ CURVE 100 Lorenz Curve (actual distribution) 80 Perfect Equality Effect of government Percent of Income 60 redistribution of cash and noncash transfers 40 Area between the lines shows the degree of income inequality 20 Complete Inequality 0 20 40 60 80 100 Percent of Families
  • 9.
    THE LORENZ CURVE 100 Lorenz Curve (actual distribution) 80 Perfect Equality Percent of Income 60 Lorenz curve after taxes and Area between 40 transfers the lines shows the degree of income inequality 20 Complete Inequality 0 20 40 60 80 100 Percent of Families
  • 10.
    CAUSES OF INCOMEINEQUALITY Ability Differences Education and Training Discrimination Preferences and Risks Unequal Distribution of Wealth Market Power Luck, Connections, and Misfortune
  • 11.
    TRENDS IN INCOMEINEQUALITY 1929 - 1947 Significant reduction in income inequality 1947 - 1969 Less inequality but at a slower pace 1969 - 2001 More unequal since 1969
  • 12.
    GLOBAL PERSPECTIVE Percentage of Total Income Received By Top One-Tenth of Income Receivers, Selected Nations 0 10 20 30 40 50 Brazil Guatemala South Africa Mexico United States France Italy Sweden Source: World Development Report, 2003
  • 13.
    CAUSES OF GROWINGINEQUALITY Greater Demand for Highly Skilled Workers Demographic Changes International Trade •Immigration •Decline in Unionism
  • 14.
    EQUALITY VERSUS EFFICIENCY TheCase for Equality Maximizing Total Utility The Case for Inequality Incentives and Efficiency Tradeoff Between Equality and Efficiency
  • 15.
    THE ECONOMICS OFPOVERTY Poverty Defined – 2001 Single $ 9,039 Family of 4 18,104 Family of 6 24,195 Poverty Rates in the U.S Blacks 22.7% Hispanics 21.4% Whites 9.9%
  • 16.
    THE ECONOMICS OFPOVERTY Incidence of Poverty Poverty Rate Poverty Trends The “Invisible” Poor •Short-Periods of Time •Geographic Isolation •Politically Invisible – Are Easy to Ignore
  • 17.
    PERCENTAGE IN POVERTY 0 10 20 30 Married-couple families Persons 65 or over Whites Total population Children under 18 Foreign born (not citizens) Hispanics Blacks Female householders 2001 Data
  • 18.
    THE INCOME-MAINTENANCE SYSTEM EntitlementPrograms Social Insurance Programs, 2002 OASDHI $432 Billion ($386 Billion in 1999) Medicare $219 Billion ($210 Billion in 1999) Unemployment Compensation $32 Billion ($20 Billion in 1999)
  • 19.
    THE INCOME-MAINTENANCE SYSTEM EntitlementPrograms Public Assistance Programs, 2002 Supplemental Security Income (SSI) $35 Billion ($29 Billion in 1999) Temporary Assistance for Needy Families $14 Billion ($23 Billion in 1999) Food stamps $20 Billion ($20 Billion in 1999) Medicaid $207 Billion ($124 Billion in 1999) Earned-Income Tax Credit (EITC) $55 Billion ($30 Billion in 1999)
  • 20.
    WELFARE: GOALS ANDCONFLICTS Common Features •Minimum Annual Income •Benefit-Reduction Rate Conflicts Among Goals •Eliminating Poverty •Maintaining Work Incentives •Holding Down Costs
  • 21.
    WELFARE: GOALS ANDCONFLICTS Welfare Reform Growing Government Dependence Personal Responsibility Act 1996 Temporary Assistance to Needy Families •5-Year Lifetime Limit •Must Work After 2 Years •Reduced Food-Stamp Eligibility •Tightened Some Definitions •5-Year Waiting Period on New Legal Immigrants
  • 22.
    income inequality unemployment compensation Lorenz curve public assistance programs Gini Ratio Supplemental Security Income income mobility (SSI) noncash transfers equality-efficiency tradeoff Temporary Assistance for poverty rate Needy Families (TANF) entitlement programs food stamp program social insurance programs Medicaid OASDHI earned-income tax credit Medicare (EITC) Copyright McGraw-Hill/Irwin, 2005 BACK END
  • 23.
    Next: Labor Market Institutions andIssues: Unionism, Discrimination, Immigration Chapter 35