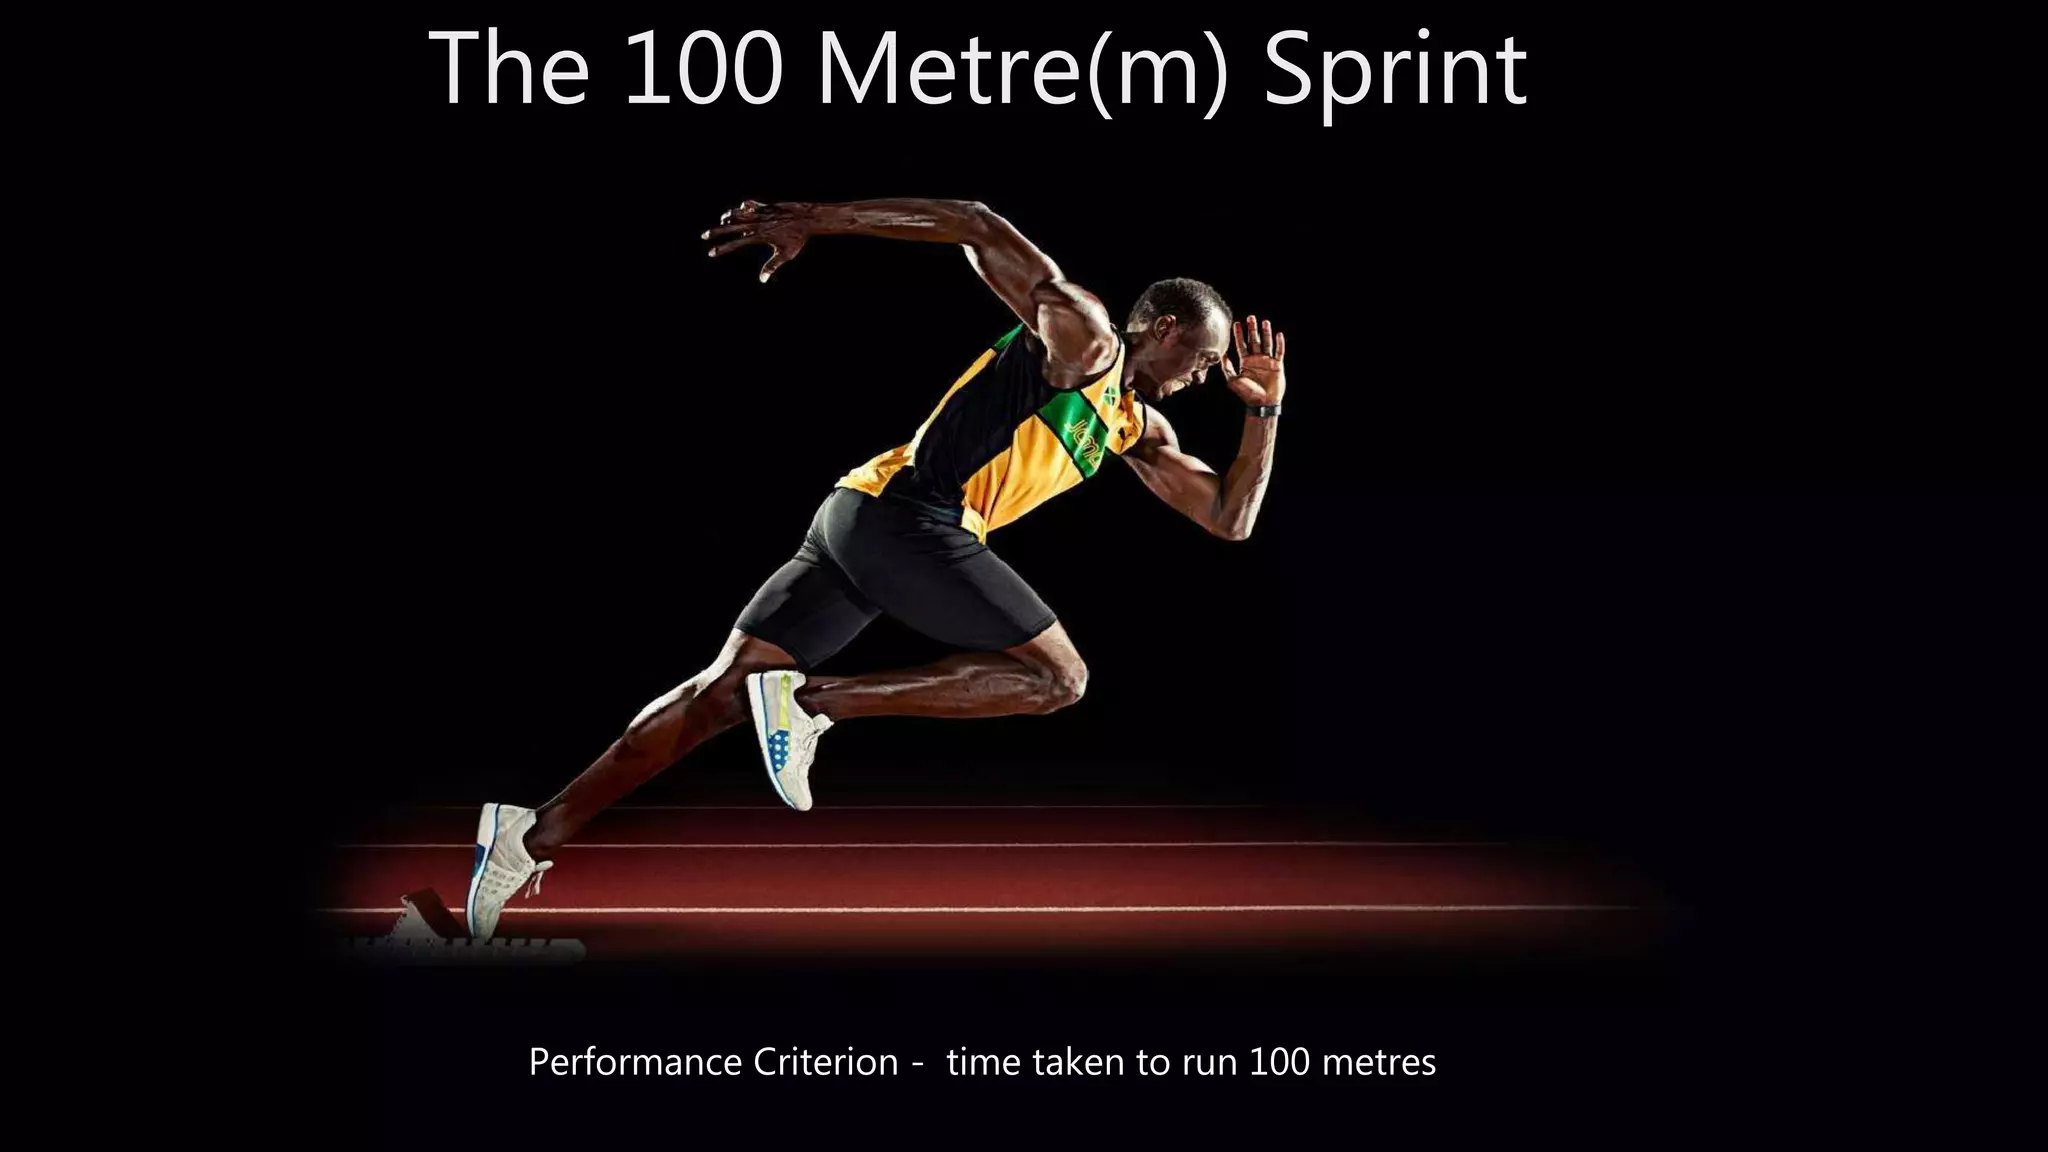
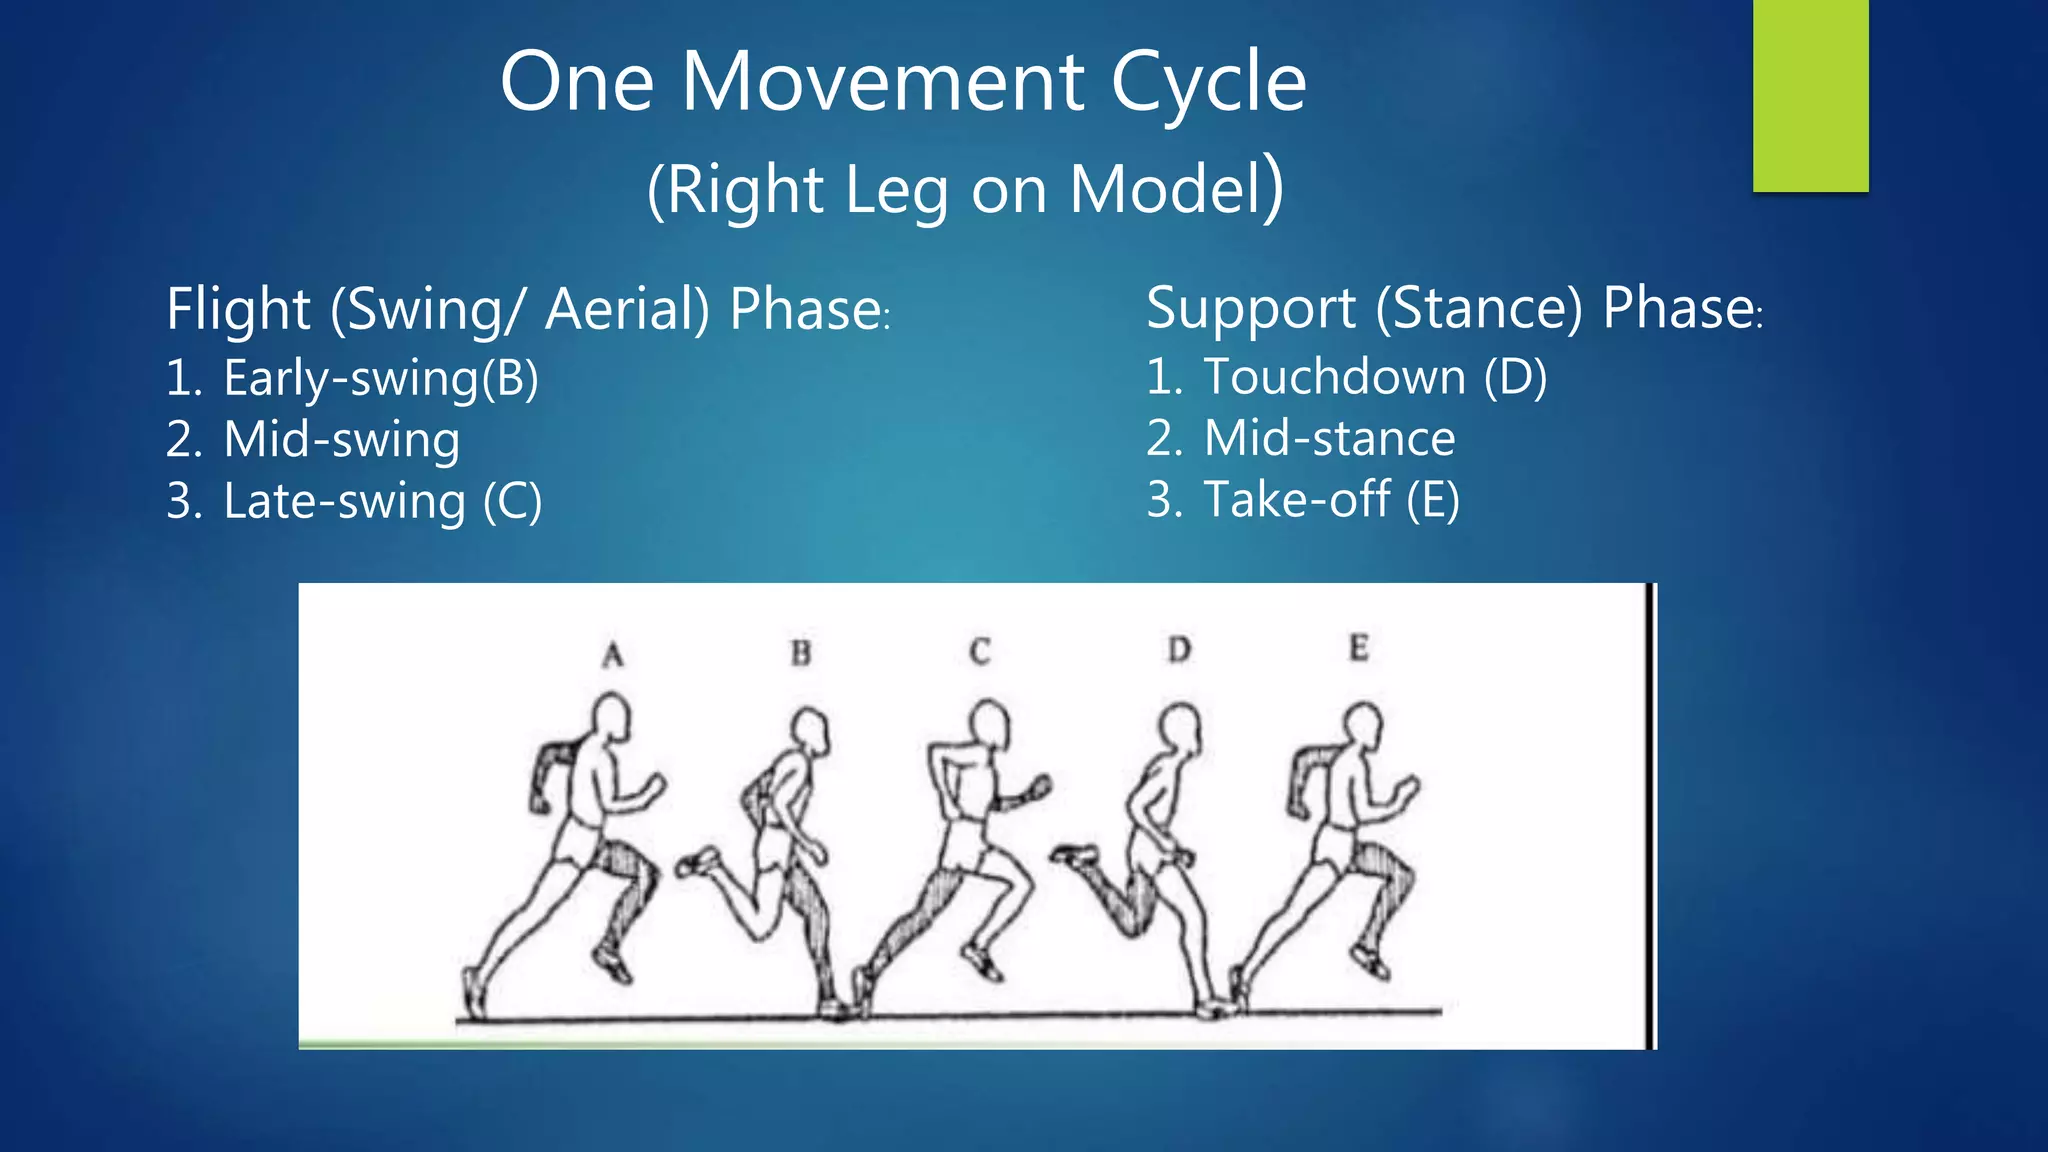
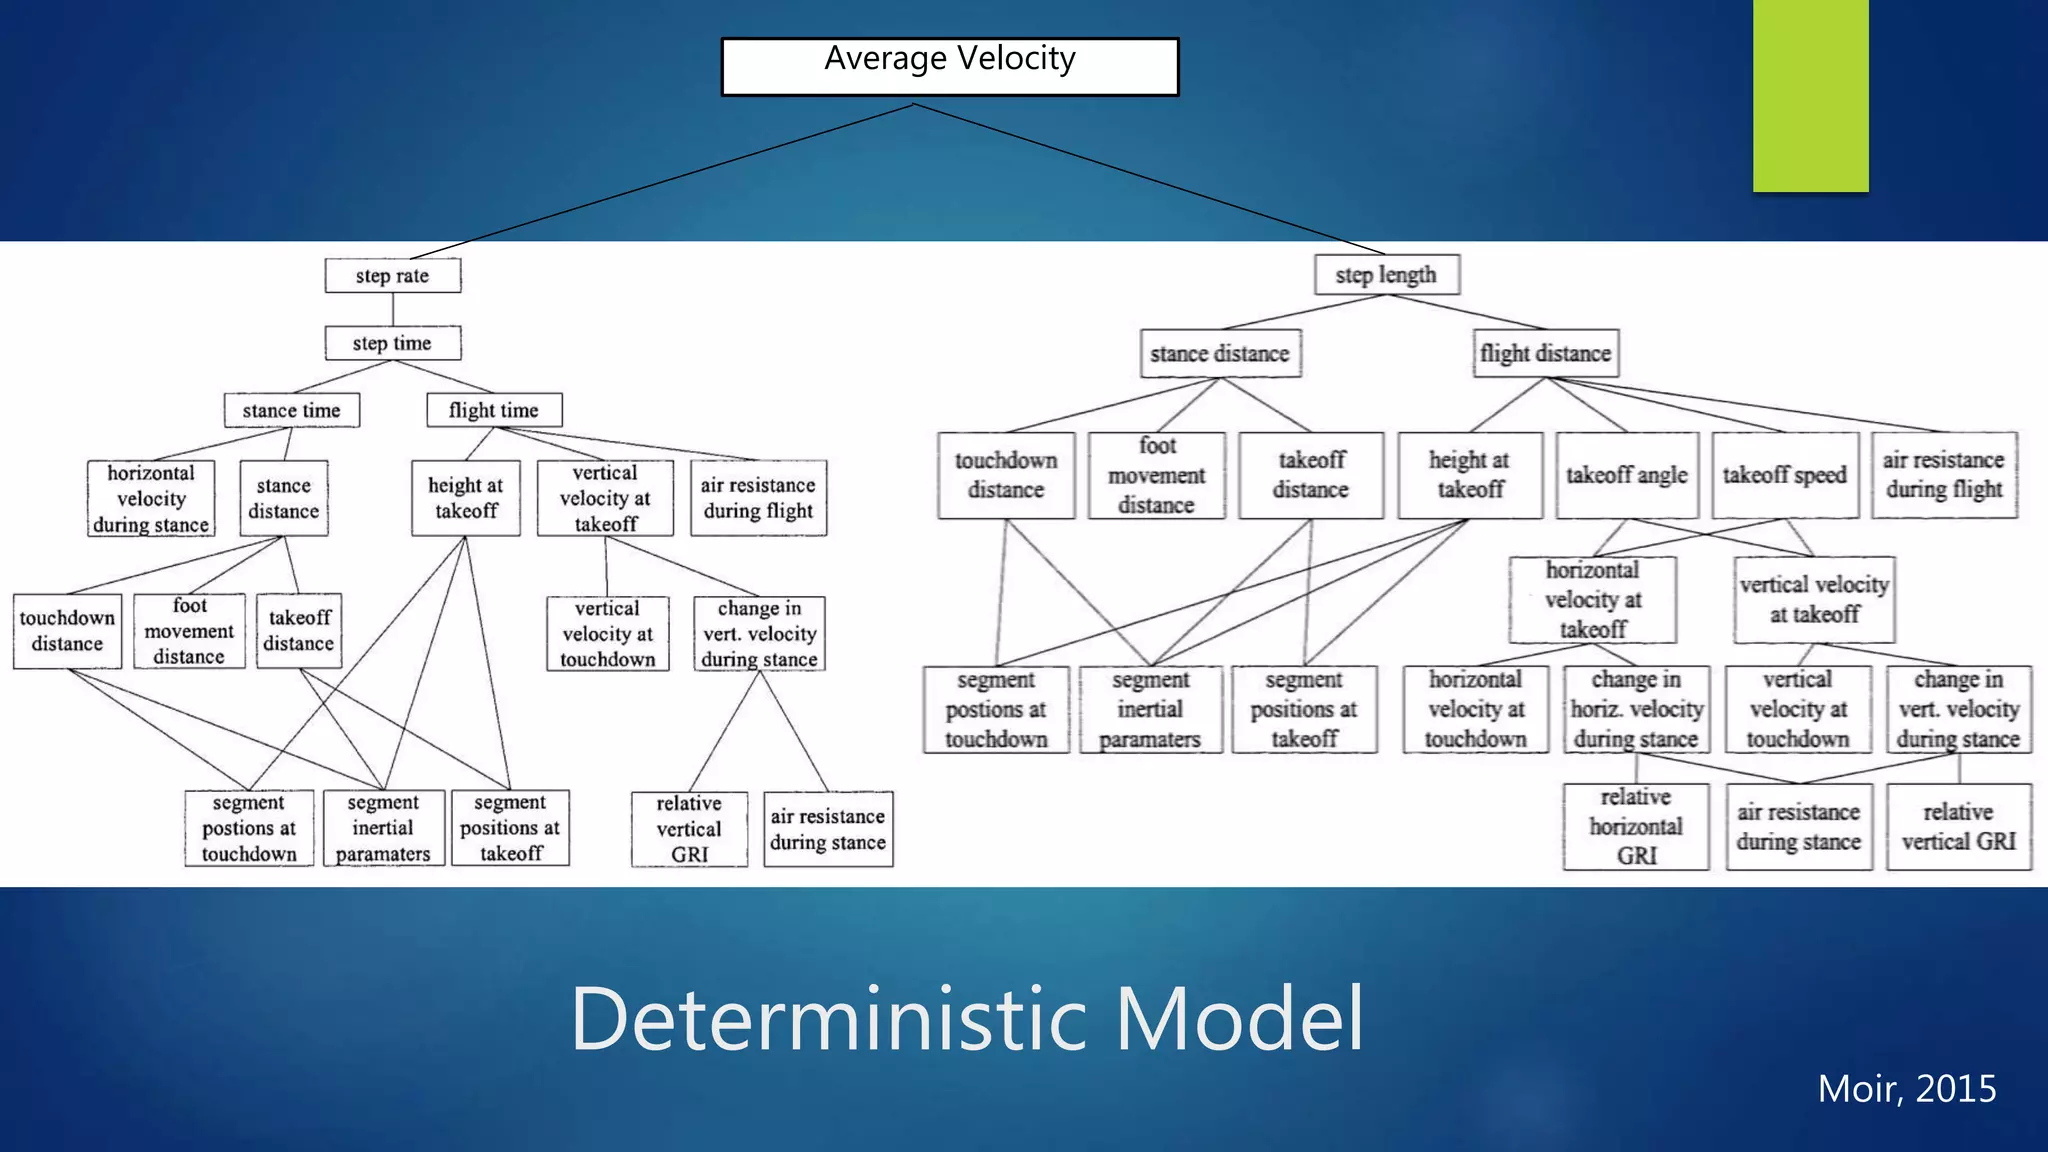
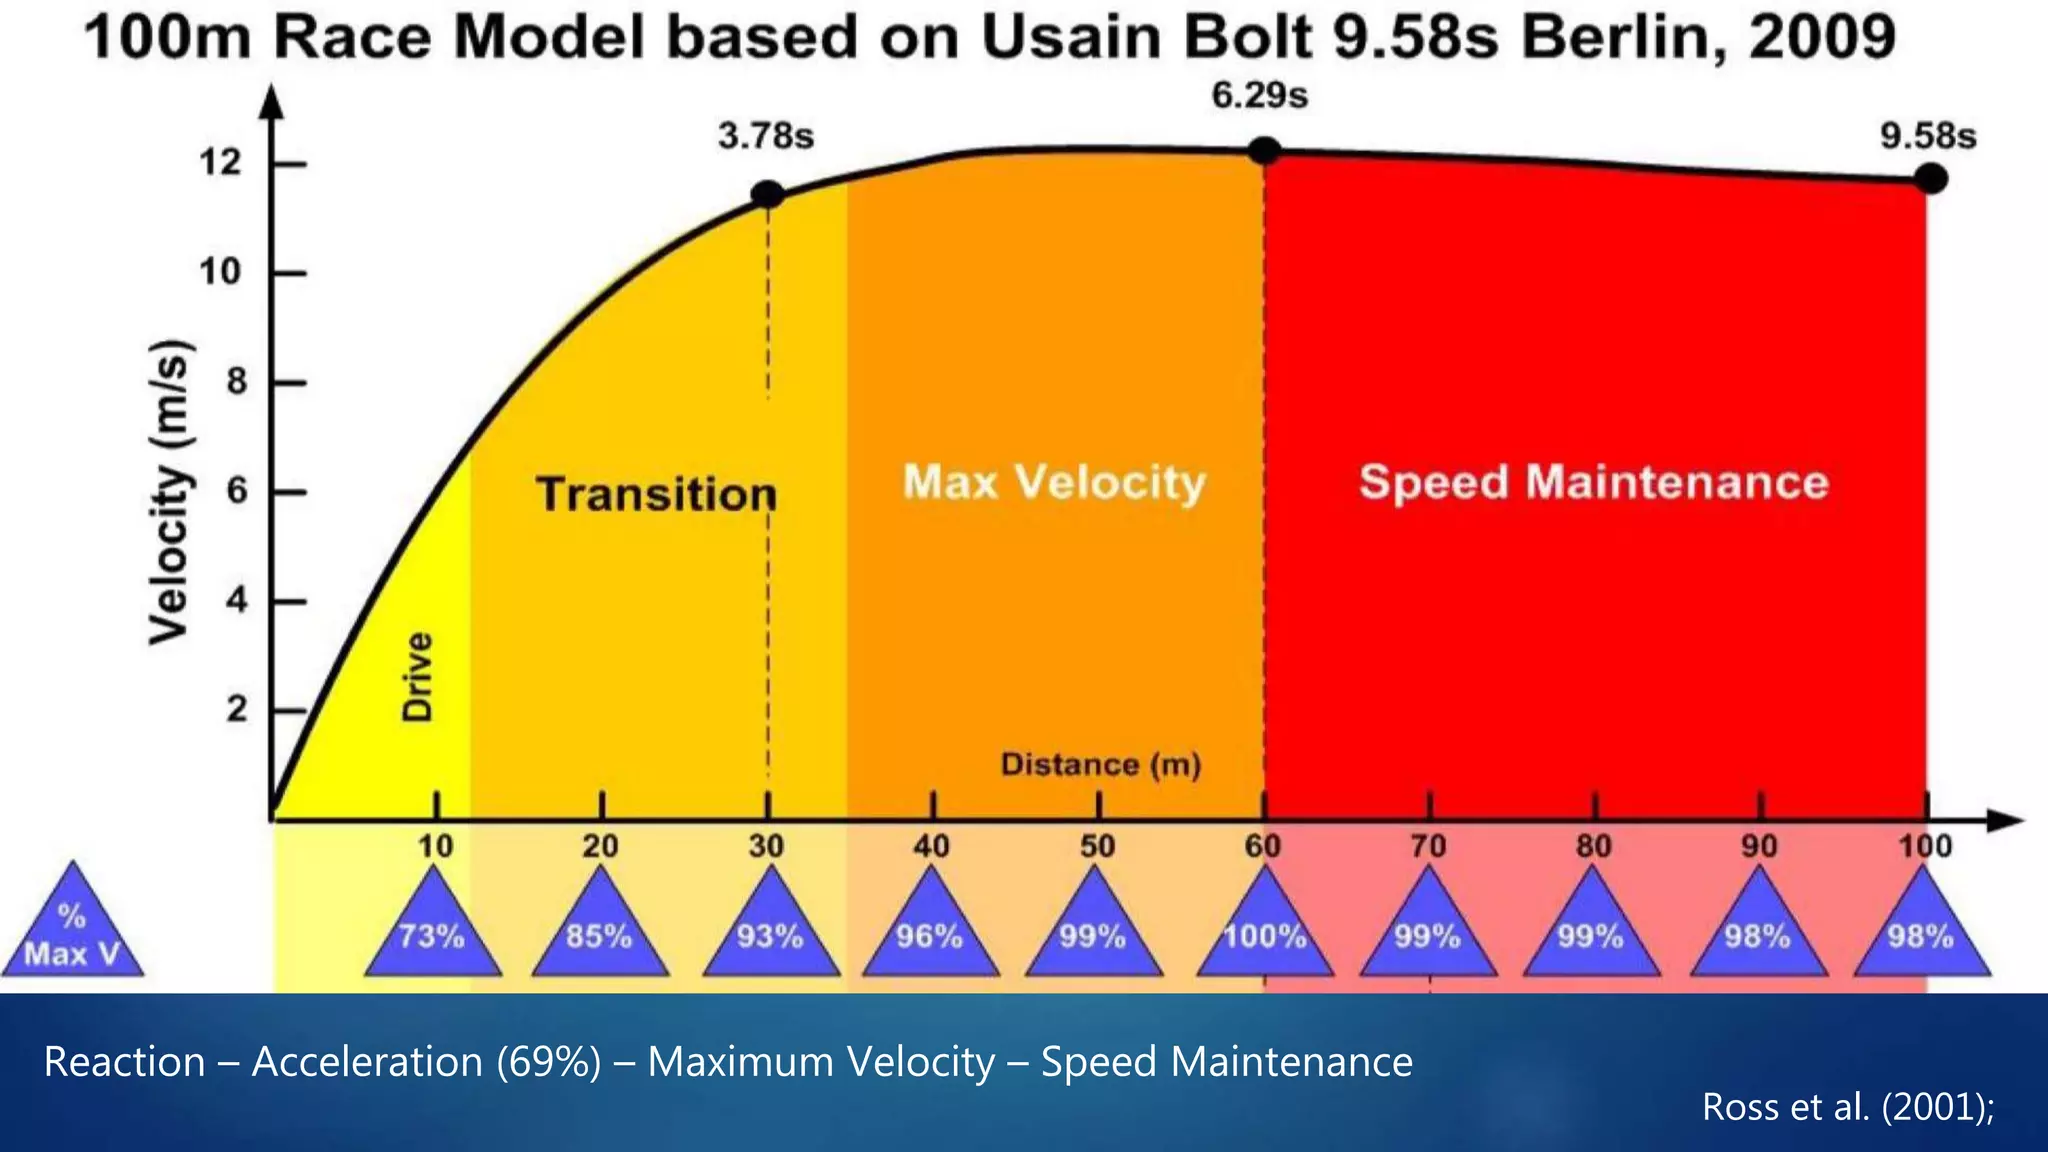
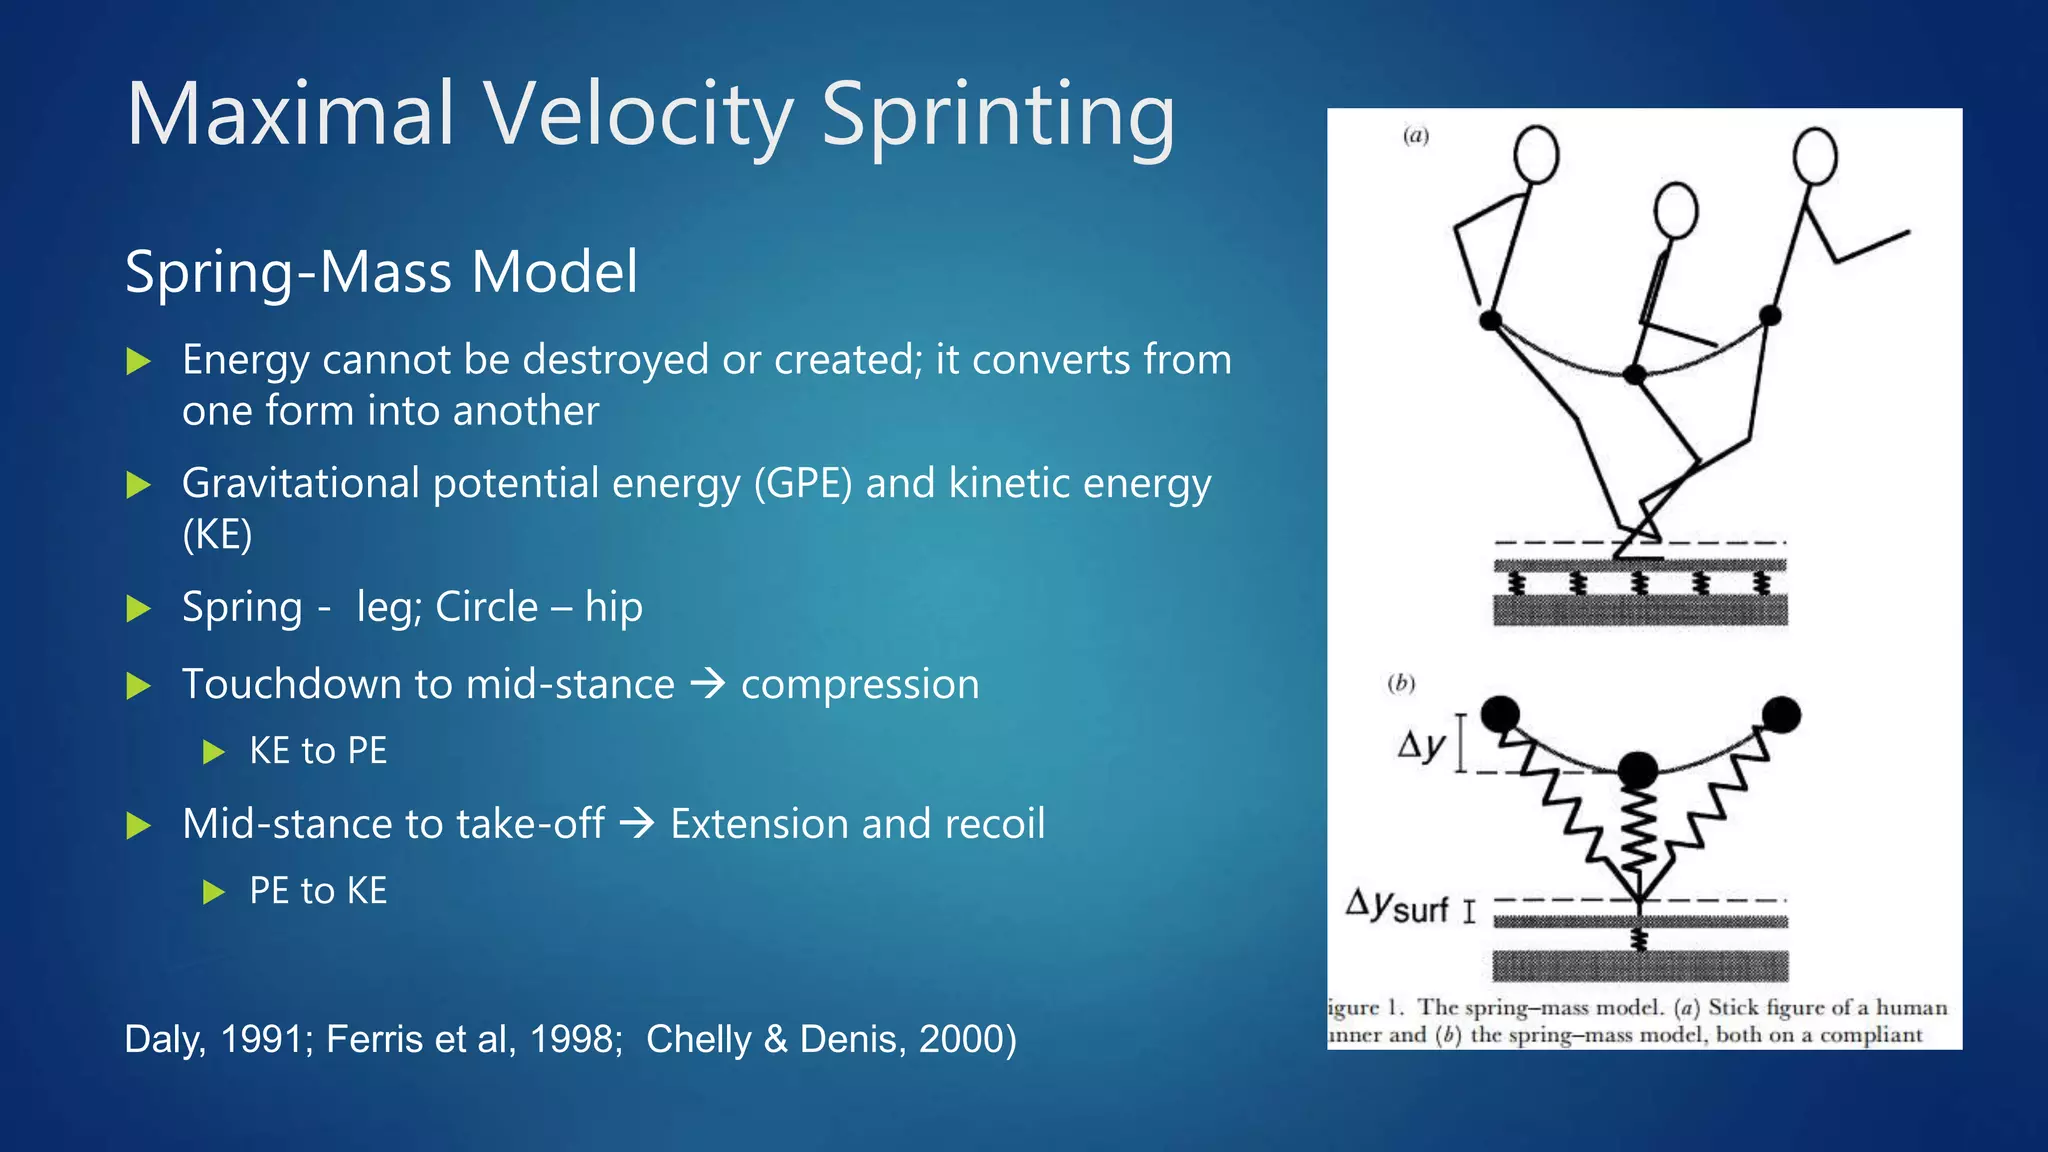
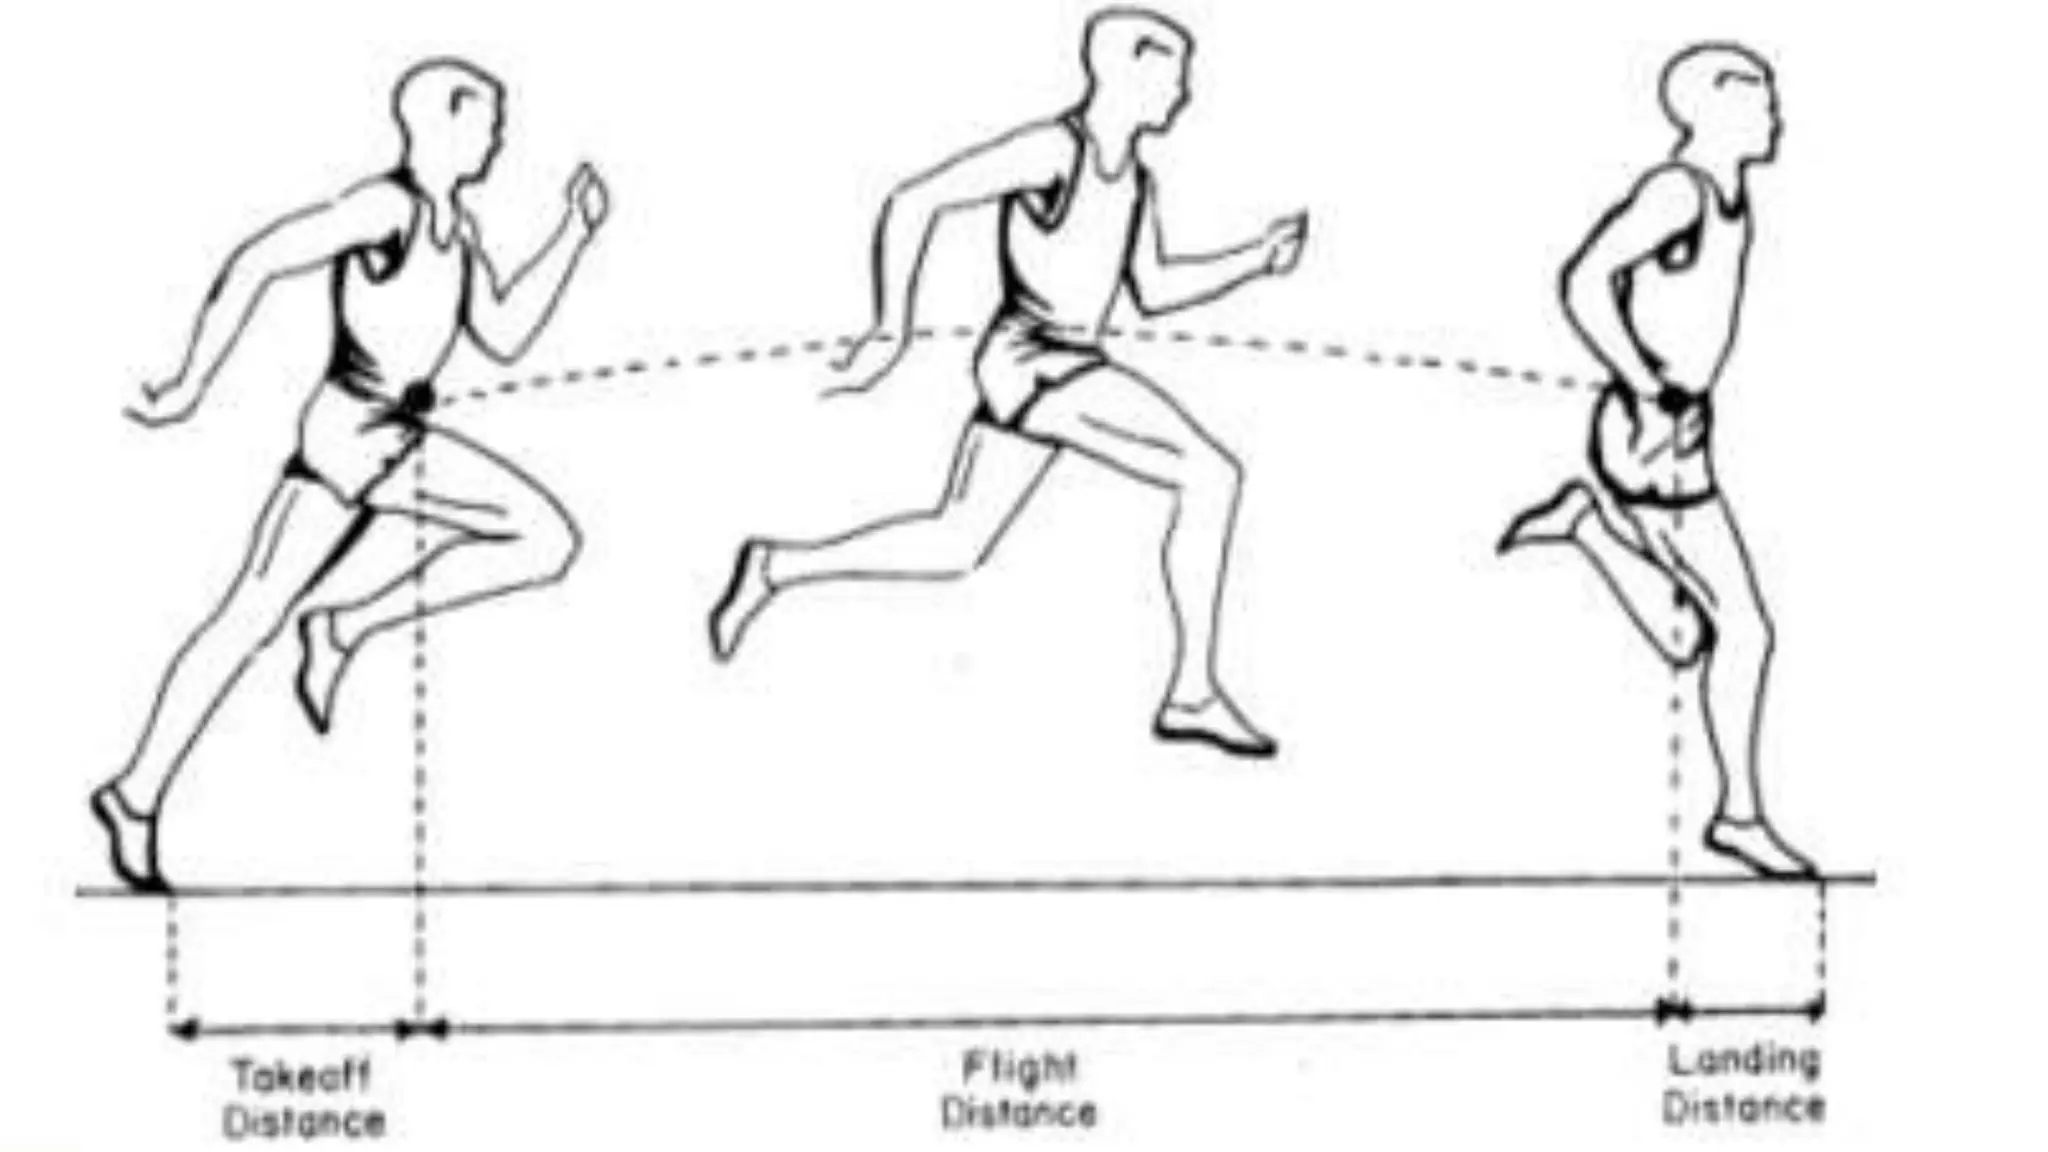
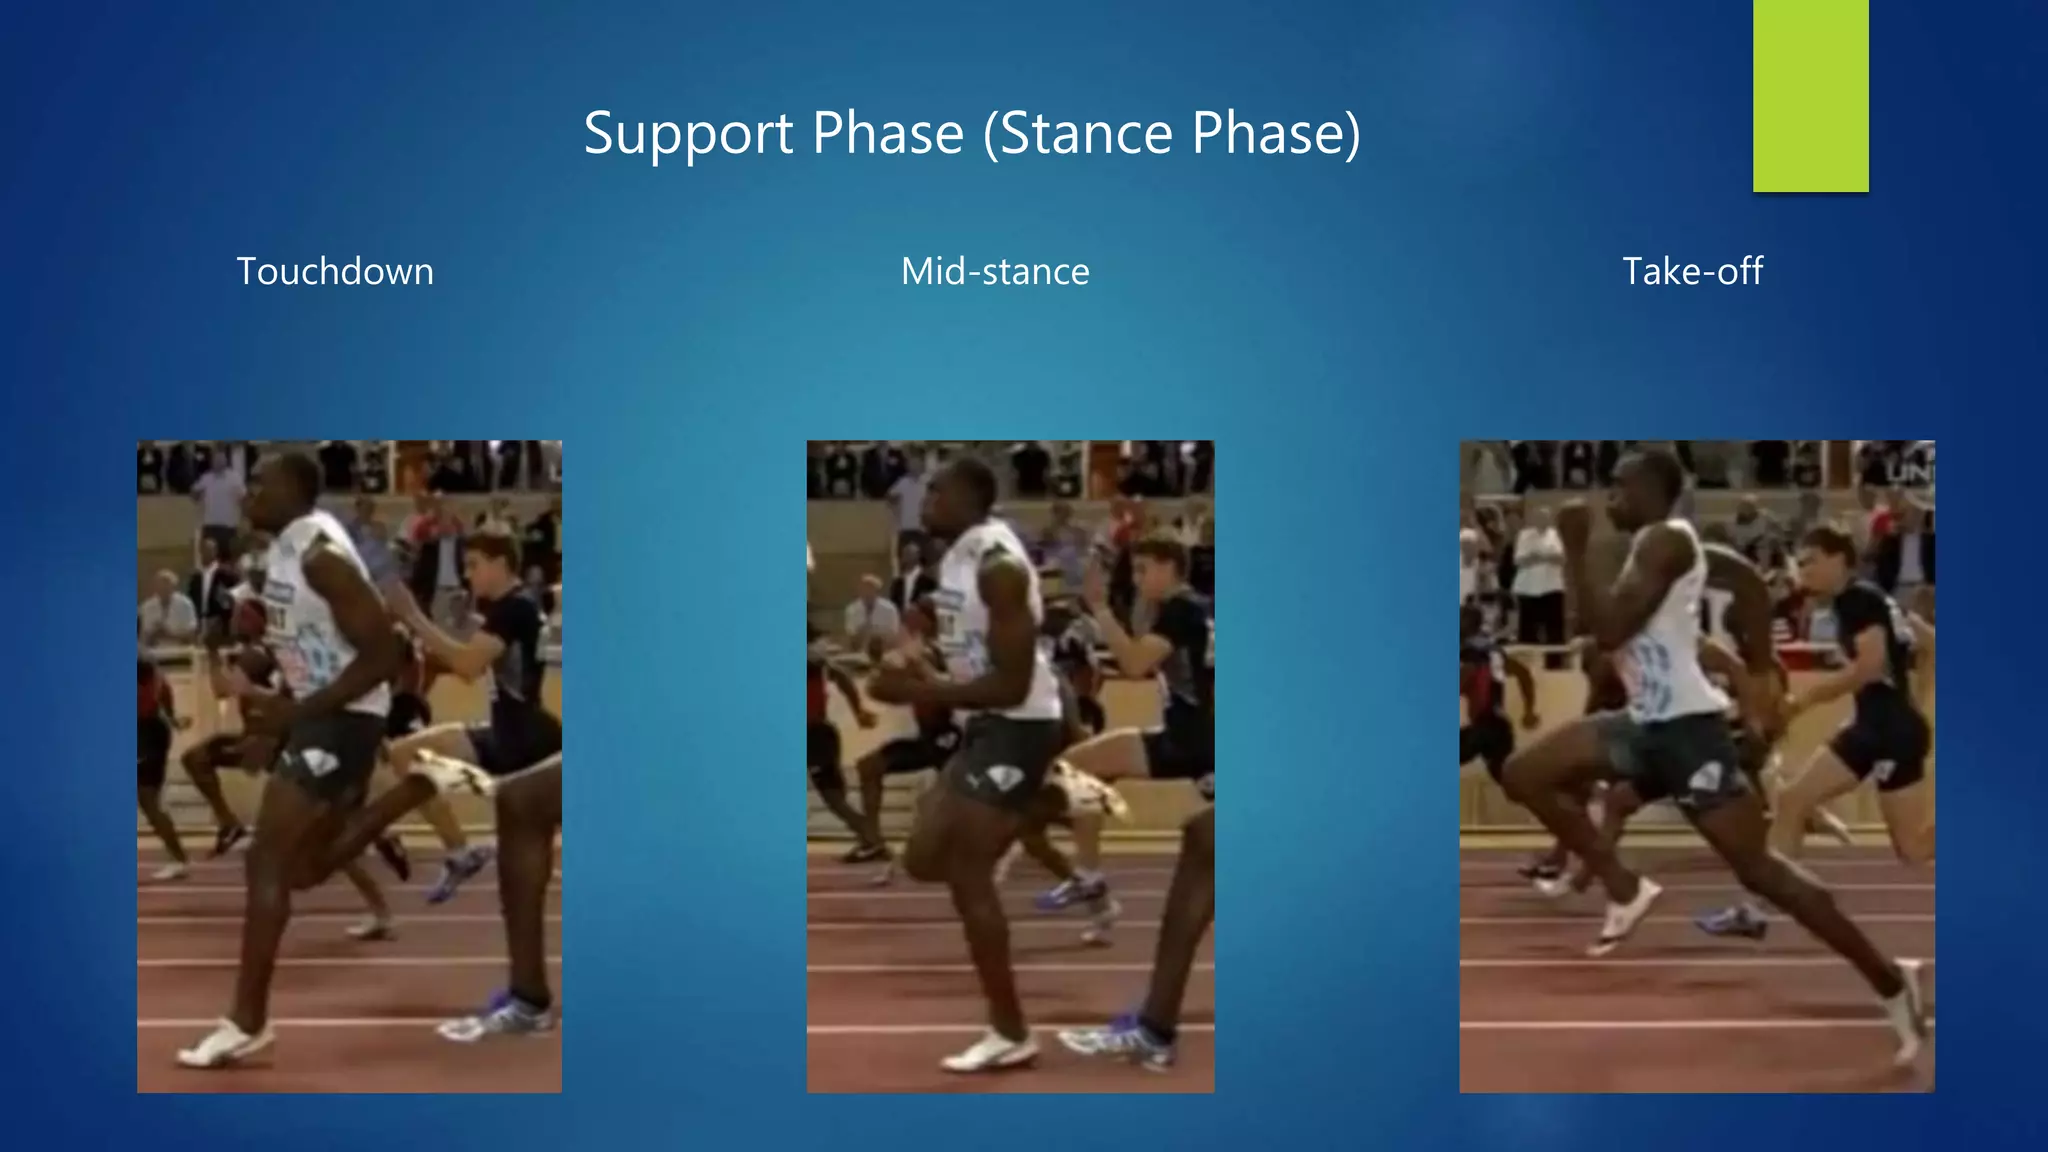
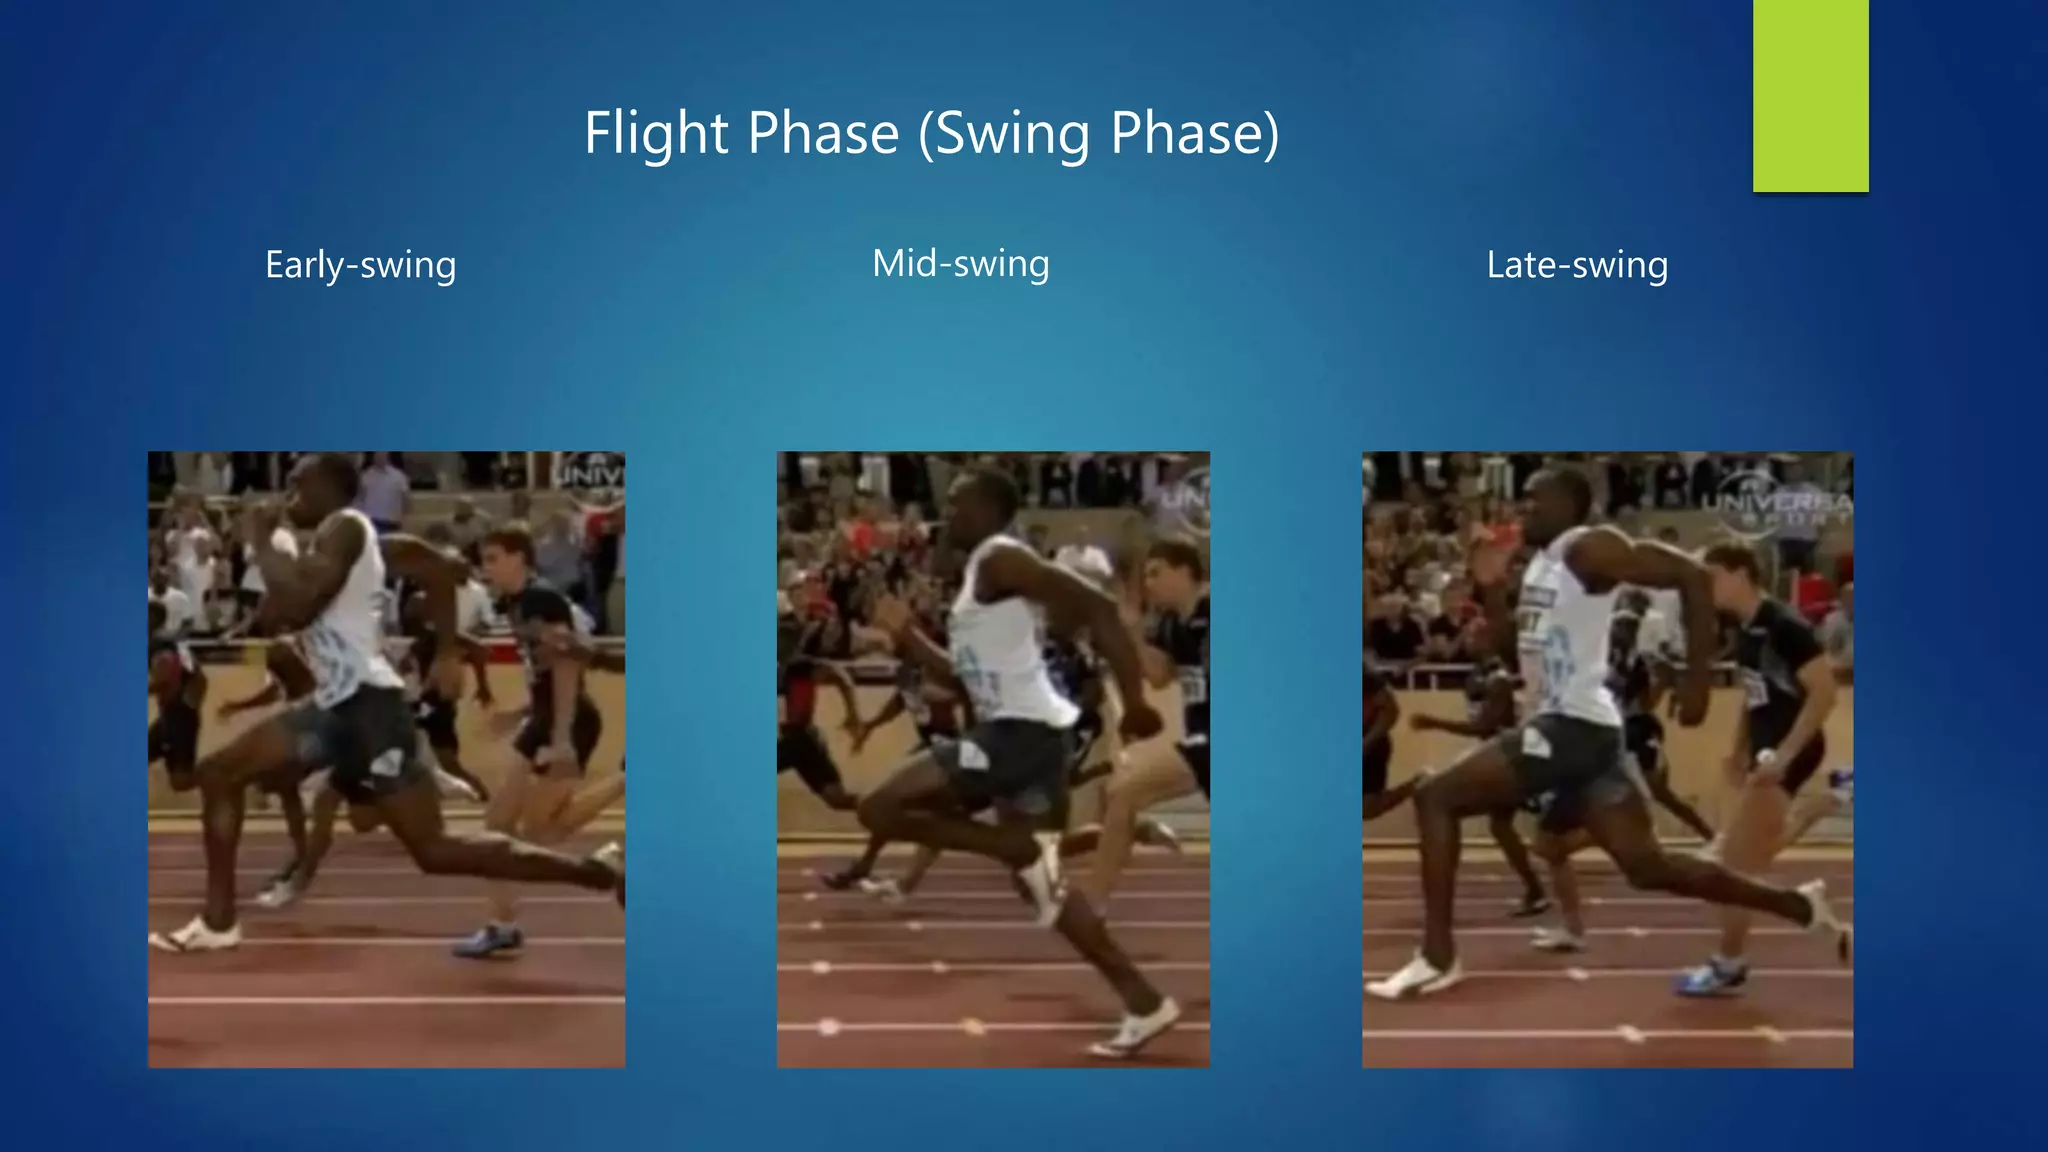
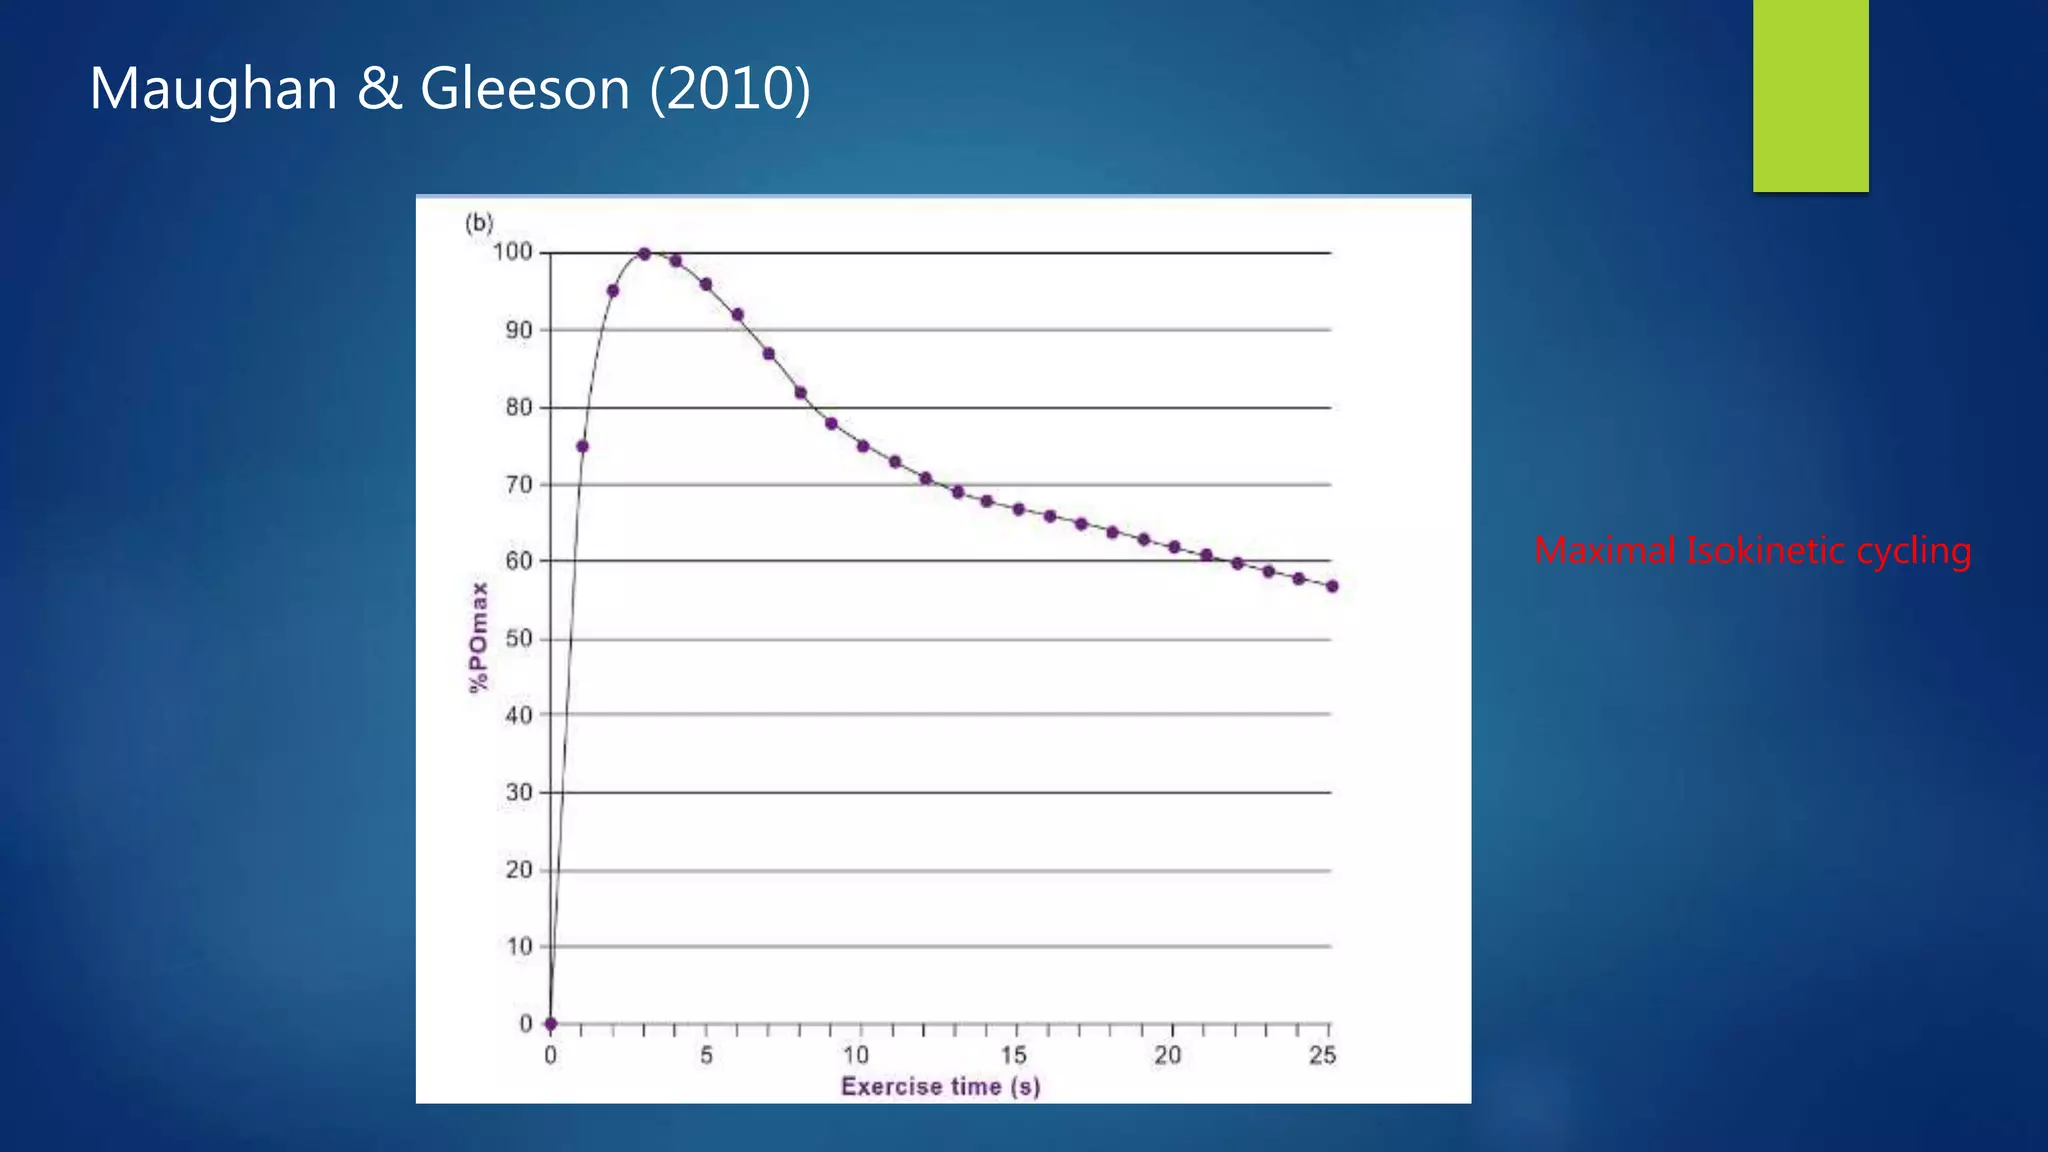
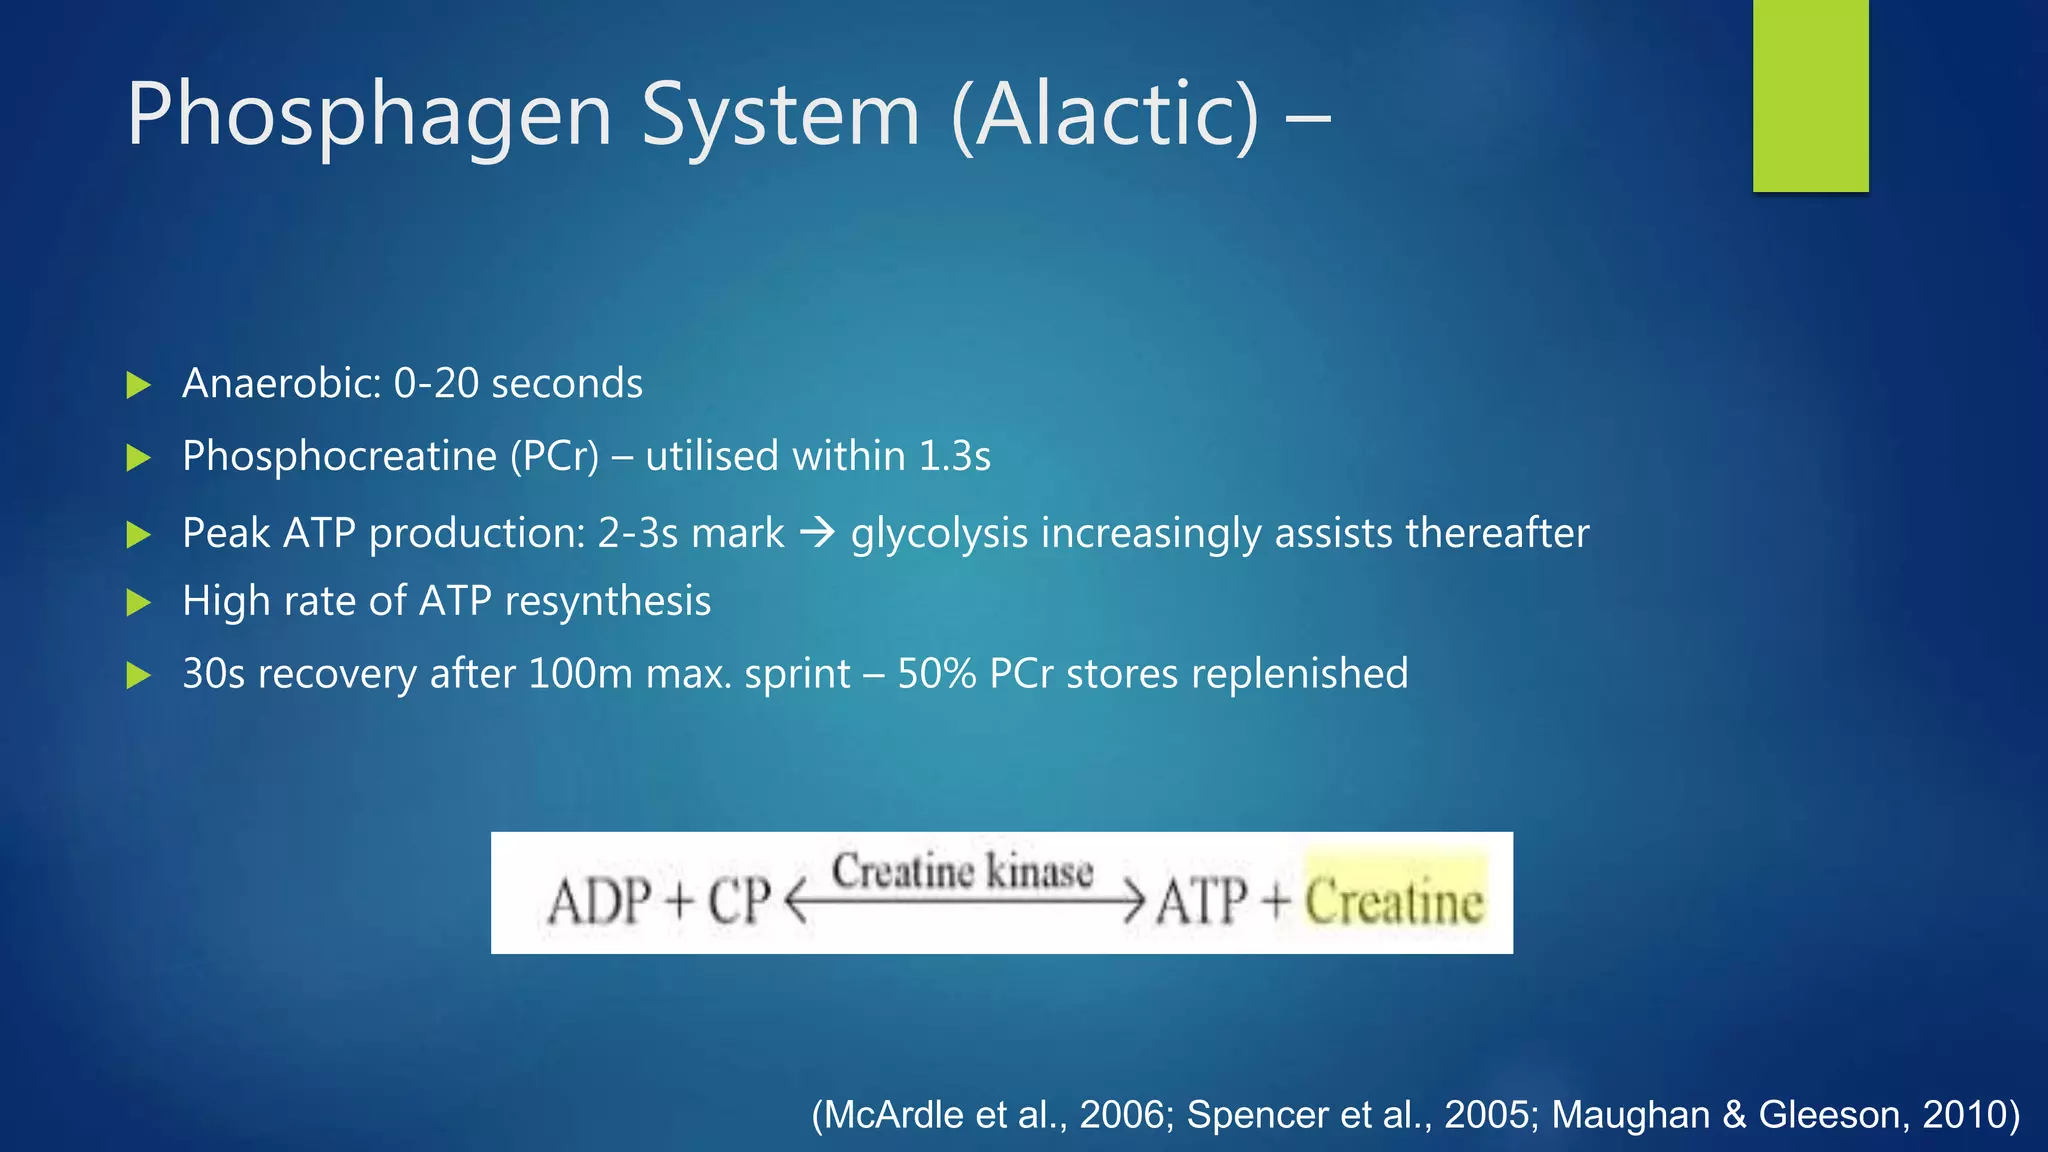
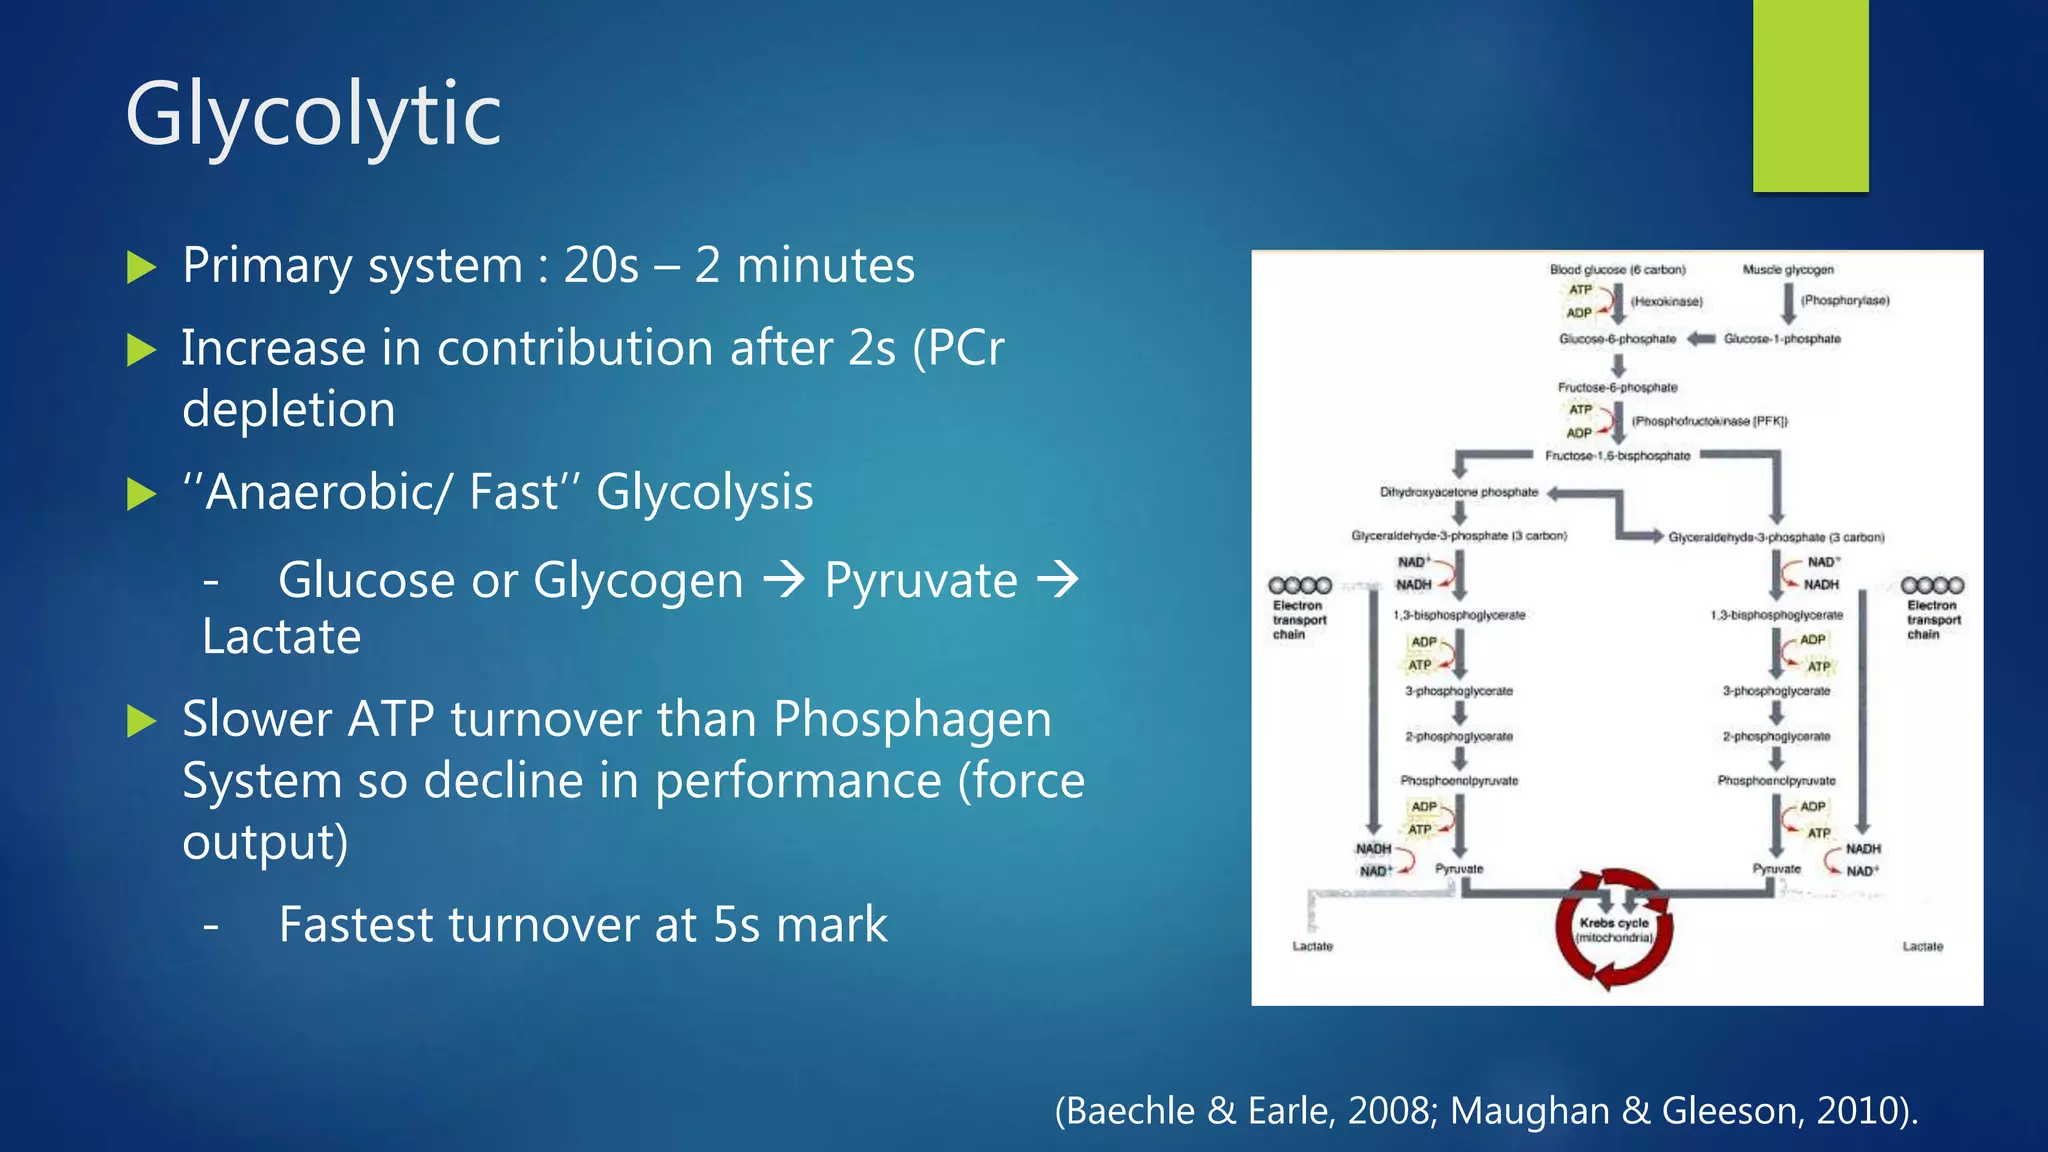
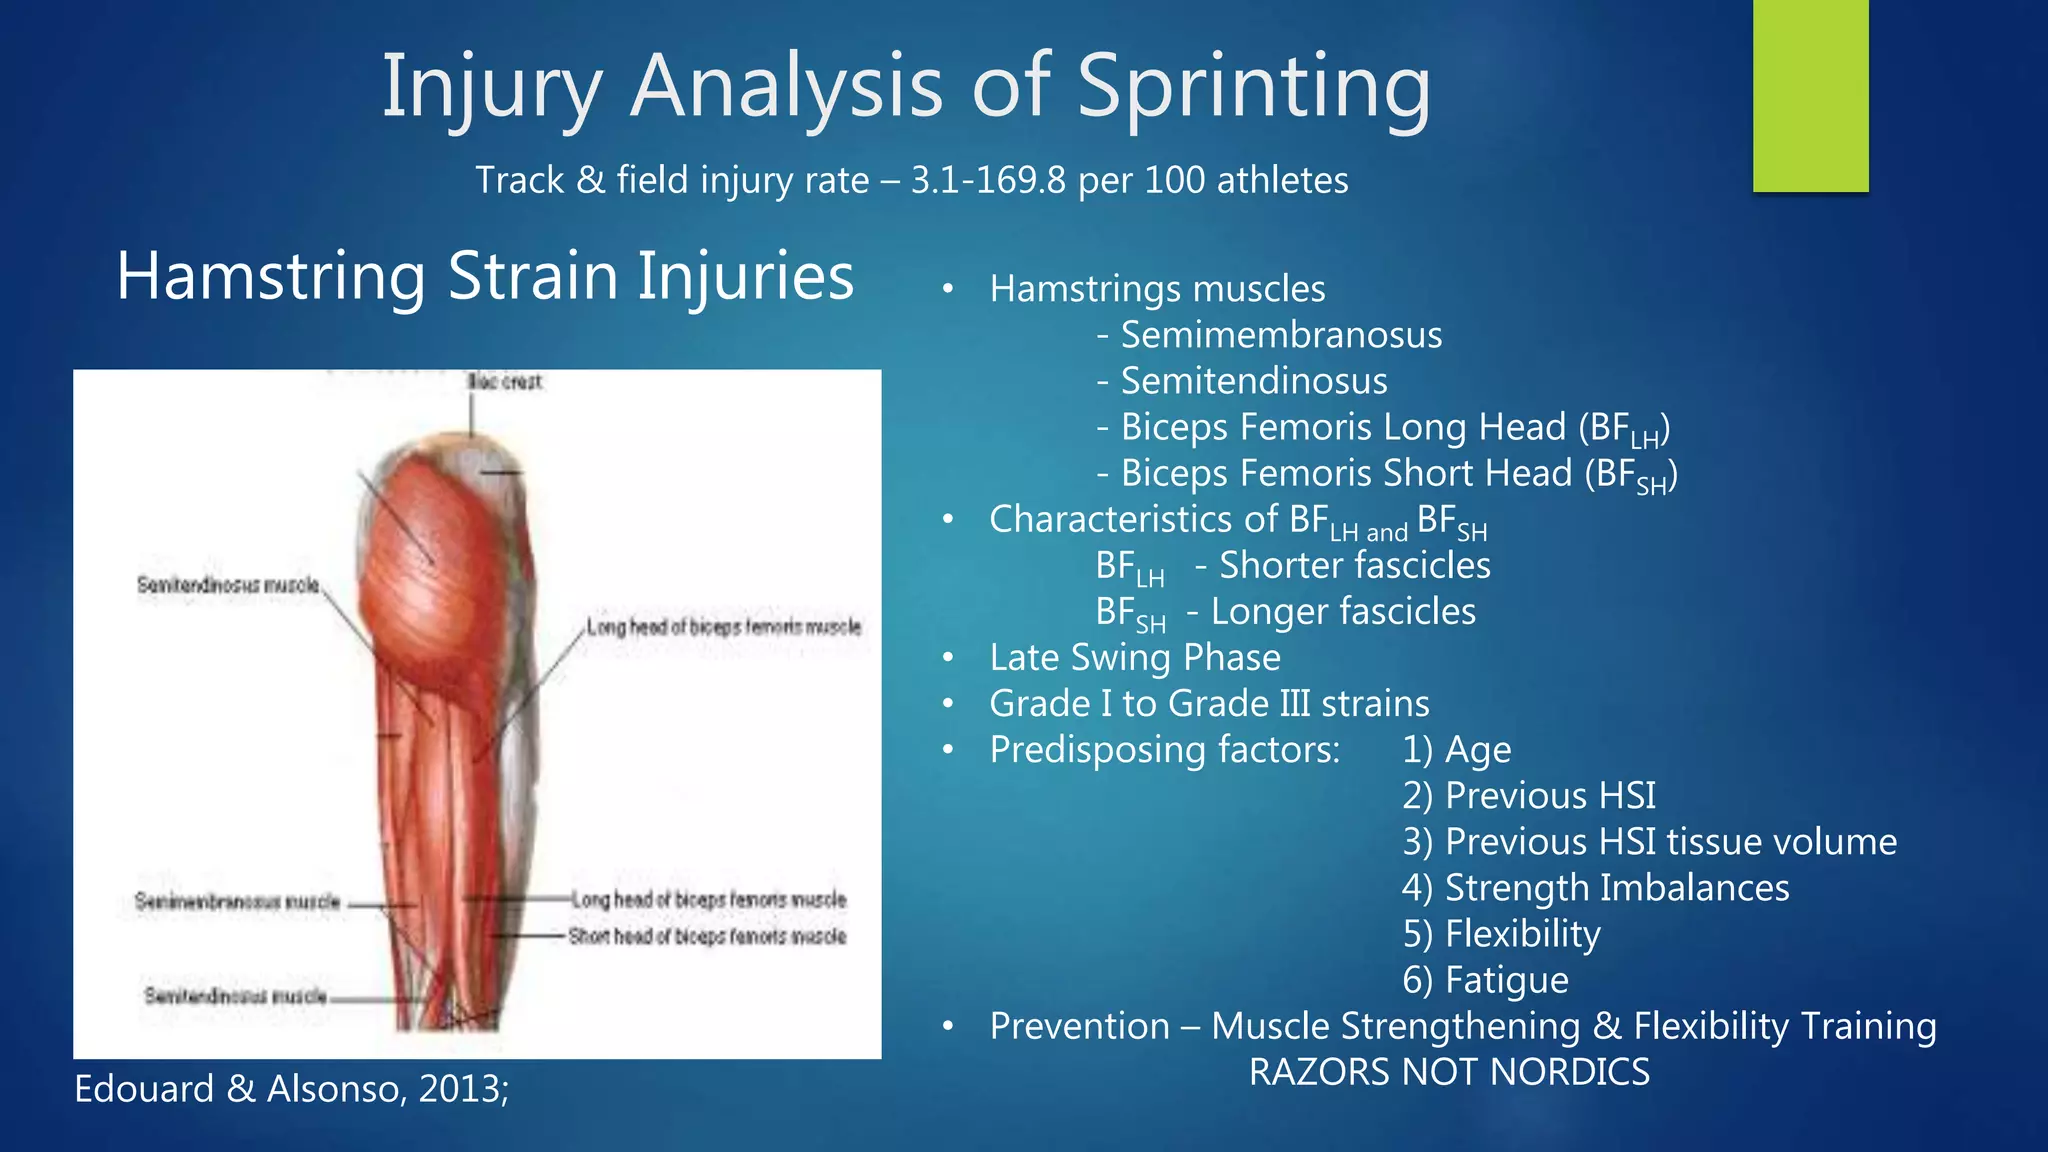
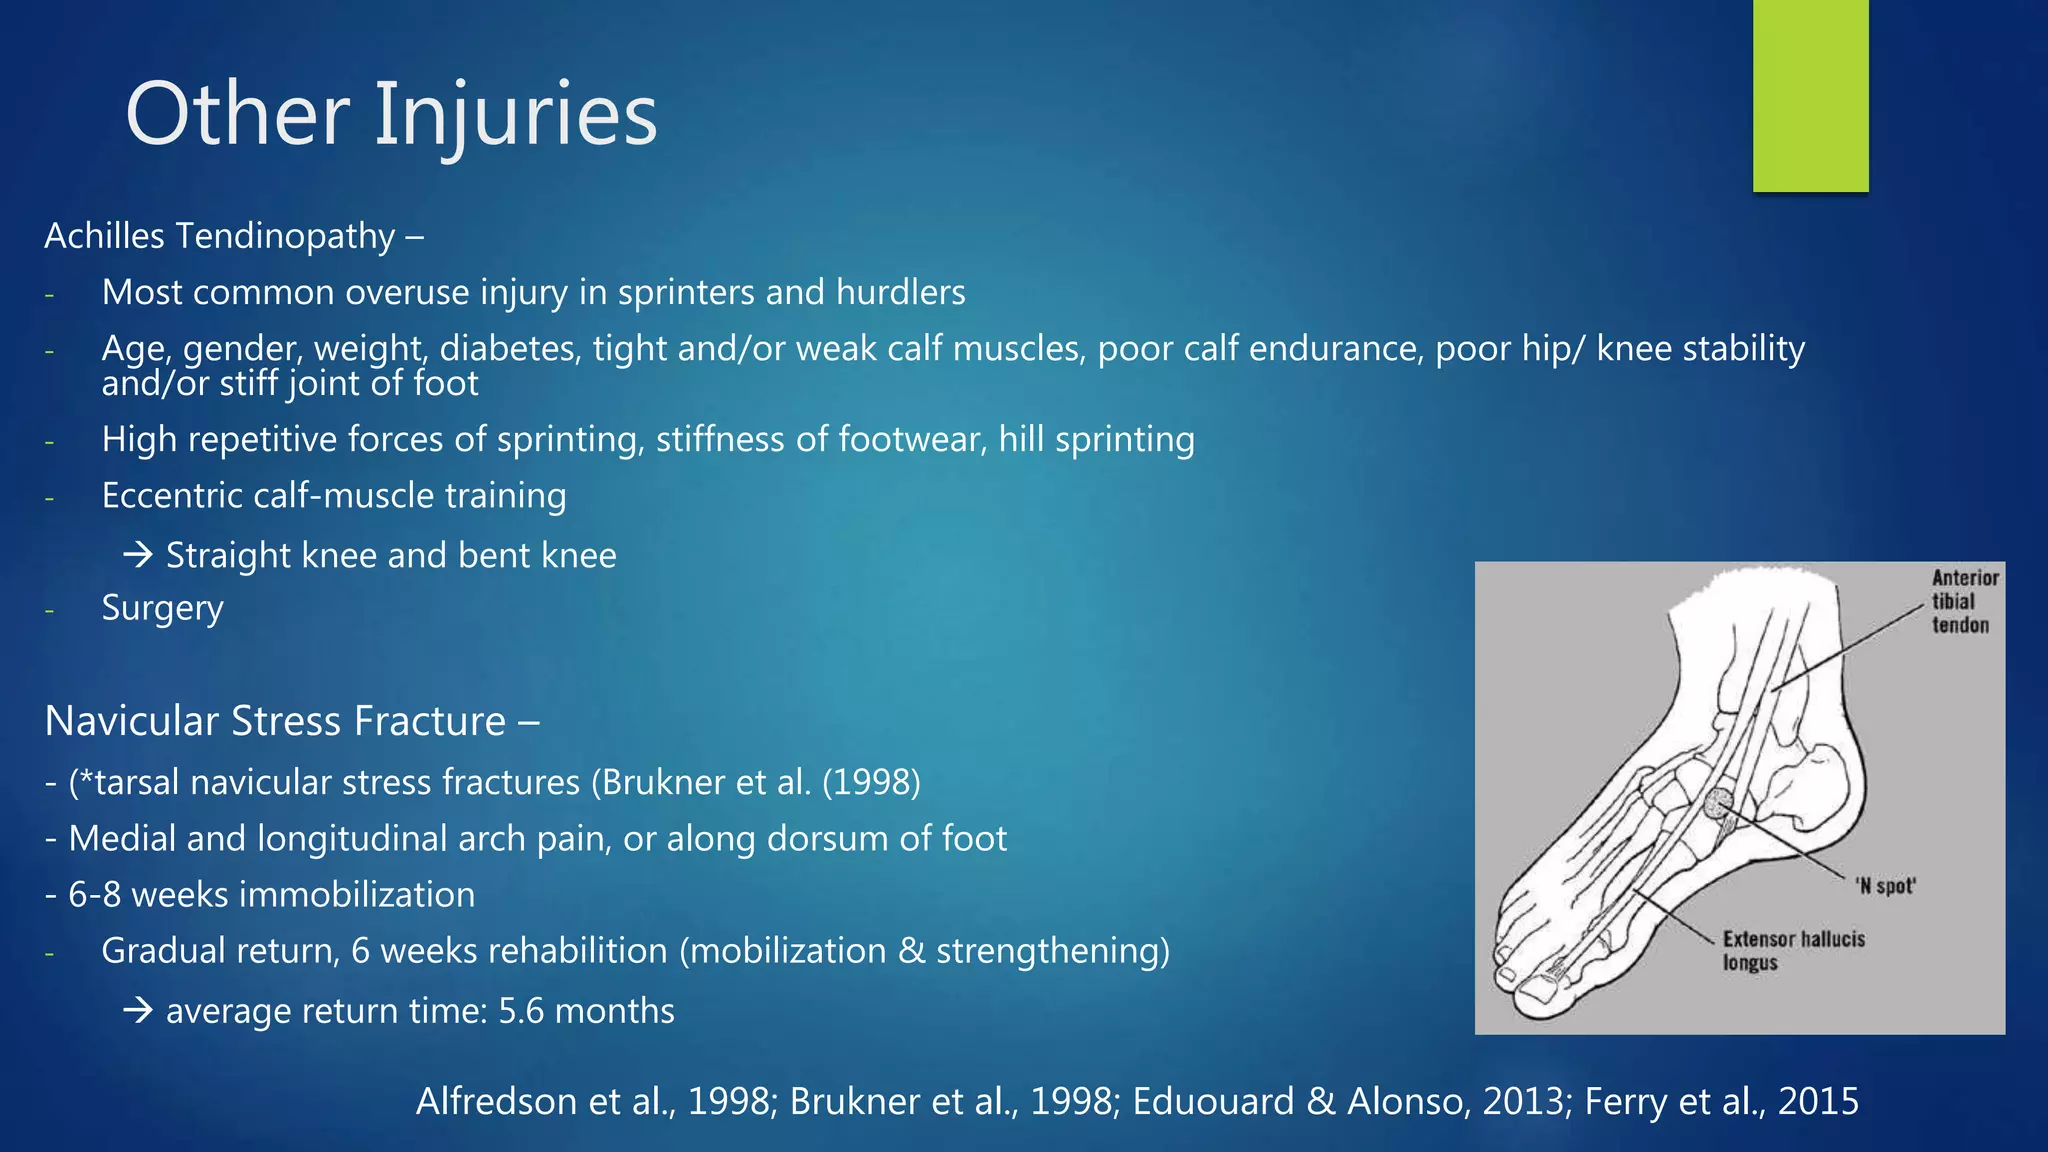
The 100 Metre Sprint:
A Needs Analysis
BY JILL COSTLEY
Outcomes
 Gain a basic understanding of the main International Association of
Athletics Federations (IAAF) rules.
 Age classifications, the start, the race & the finish
 Appreciate the movement patterns of running (including the mechanics of
acceleration and maximal velocity running)
 Understand the energy systems and muscle fibres utilised within the 100m
sprint
 Describe the mechanism of hamstring strain injuries
 Describe navicular stress fractures and Achilles tendinopathies
 Apply the Needs Analysis to training: training and testing
The 100 Metre(m) Sprint
Performance Criterion - time taken to run 100 metres
Basic Overview
•Classification - age
•Lanes & Lane Infringement
•The Start & Starting Blocks
•The Race & Finishing
Age Classifications
 U13 Boys and Girls
 U15 Boys and Girls
 U17 Men and Women
 U20 Men and Women
 Seniors – at least 20 years old
 Masters – at least 35 years old
The Lane
Lane Infringement  Disqualification
•White lines/ kerbs
•No infringement if forced out
Starting Blocks – Compulsory
 Rigid & fixed
 International Comp - Linked to Start Information System
The Start
 ‘’On your marks’’, ‘’set’’  report of gun
 Starter may withdraw competitors from the marks
 Warning  disqualification
 False start (≤ 0.100s) = disqualification
 Performance Criterion - time taken to run 100 metres
 Times from fully automatic timing system
• Photo Finish System
• Any body part (head, neck, arms, torso, legs, hands or feet)
≥20 minutes between last heat and fist heat of successive rounds
(Maughan & Gleeson, 2010; Dick, 2012; IAAF, 2016)
Movement Patterns
• Gait Analysis
• Breakdown of a Stride
• Mechanics
• Brief Comparisons
 Elite male – 9.58s to 11s
• Male world record – 9.58s (Berlin, 2009)
- Usain Bolt (Jamaica)
 Elite female – 2012 Olympic final – average of 10.87s
• Female world record – 10.49s (Seoul, 1988)
- Florence Griffith-Joyner (America)
Ross et al. (2001); McGinnis, 2005
Running Velocity = Stride Length x Stride Frequency
 Stride:
 Stride length: the distance from the
placement of one foot to the next
placement of the same foot
 Stride frequency: the number of strides
within a given time (usually per minute)
 Walking base (aka stride width or base
of support)
Levine et al., 2012
Running – Gait
Support (Stance) Phase:
1. Touchdown (D)
2. Mid-stance
3. Take-off (E)
Flight (Swing/ Aerial) Phase:
1. Early-swing(B)
2. Mid-swing
3. Late-swing (C)
One Movement Cycle
(Right Leg on Model)
Deterministic Model
Average Velocity
Moir, 2015
Reaction – Acceleration (69%) – Maximum Velocity – Speed Maintenance
Ross et al. (2001);
Reaction time
Time interval between the stimulus provided by the shot of the
Starter’s gun and the initiation of a response form the sprinter
through movement
 Contributes 1-2% to 100m performance
 Relationship of sprint performance & Male vs female
 False start - < 0.100s
 Human ability could exceed this
 Men & Women…
Pain & Hibbs, 2007; Babic & Delalija, 2009; Pavlovic et al., 2014; IAAF, 2016
Newton’s Laws of Motion
 Law of Inertia - ‘’a body will continue in its state of res or uniform motion in a
straight line unless acted upon by an external force’’ (Griffin & Watkins, , pg. 235).
 Law of Acceleration - ‘’the change of motion of an object is proportional to the
force impressed; and is made in the direction of the straight line in which the
force is impressed’’ (McGinnis, 2013, pg. 98)
 Law of Action-Reaction – ‘To every action there is always opposed an equal
reaction’’ (McGinnis, 2013, pg. 95)
Block Position – ‘’Set’’
Centre of Mass Height –
- ↑ (0.61-0.66m)
- ← (0.16-0.19m)
Factors:
1) Anthropometric Profile
2) Arm Strength
Block Position
- Bunched (<30cm)
- Medium start (30-50cm)
- Elongated start (>50cm)
Mero et al., 1992 Harland & Steele, 1997
Ground-Block Angle
Joint Angles
Block Clearance
Primary Muscles Utilised for Force Production: gluteus maximus, biceps femoris, vastus lateralis, rectus femoris &
gastrocnemius
Sufficient Vertical Impulse; Maximal Horizontal Impulse
Initiation of movement : Extension of hip & knee
: Decrease of ankle joint angle
- Pre-stretch for SSC
Elite vs Non-Elite
Greater block velocity and acceleration
Medium Start
Explosive movement against blocks
Low clearance angle
Harland & Steele,1997
Mero et al., 1992
Acceleration
Initial Strides
- COG ahead of touchdown
- Lengthen first stride
Flight and ground contact time of elite male sprinters during
the first two steps following block clearance (Harland &
Steele, 1997)
Acceleration
Maximal Velocity Sprinting
Spring-Mass Model
 Energy cannot be destroyed or created; it converts from
one form into another
 Gravitational potential energy (GPE) and kinetic energy
(KE)
 Spring - leg; Circle – hip
 Touchdown to mid-stance  compression
 KE to PE
 Mid-stance to take-off  Extension and recoil
 PE to KE
Daly, 1991; Ferris et al, 1998; Chelly & Denis, 2000)
Touchdown Mid-stance Take-off
Support Phase (Stance Phase)
Early-swing Mid-swing Late-swing
Flight Phase (Swing Phase)
The Elite -
Greater sprint velocity is achieved
through the production of a
greater horizontal ground
reaction force and not through
stride frequency
Weyand et al., 2000
Physiological Demands
• Energy system
• Blood Lactate
• Causes of acute fatigue
• Muscle fibre types
Adenosine Triphosphate
 Adenosine (adenine and ribose) and 3 phosphate groups
 High energy bond between the successive phosphate groups
 Hydrolysis via adenosine triphosphate (ATPase) – 7.3 cals/mole
 Approximately 2s of maximal intensity
 Reversible – phosphorylation via energy systems
(Cramer, 2008; Wilmore et al., 2008; Maughan & Gleeson, 2010).
Maughan & Gleeson (2010)
Maximal Isokinetic cycling
Phosphagen System (Alactic) –
 Anaerobic: 0-20 seconds
 Phosphocreatine (PCr) – utilised within 1.3s
 Peak ATP production: 2-3s mark  glycolysis increasingly assists thereafter
 High rate of ATP resynthesis
 30s recovery after 100m max. sprint – 50% PCr stores replenished
(McArdle et al., 2006; Spencer et al., 2005; Maughan & Gleeson, 2010)
Glycolytic
 Primary system : 20s – 2 minutes
 Increase in contribution after 2s (PCr
depletion
 ‘’Anaerobic/ Fast’’ Glycolysis
- Glucose or Glycogen  Pyruvate 
Lactate
 Slower ATP turnover than Phosphagen
System so decline in performance (force
output)
- Fastest turnover at 5s mark
(Baechle & Earle, 2008; Maughan & Gleeson, 2010).
Oxidative System
 Contribution is small
 Aerobic – oxidises carbohydates
 Inc. in duration and distance
100m Sprint Ergogenics
 90-95% anaerobic and 5-10% aerobic (Maughan & Gleeson,
2010)
 53% from the phosphagen system, 44% glycolytic and 3%
oxidative (Bompa & Buzzichelli, 2015)
(Bompa & Buzzichelli, 2015; Maughan & Gleeson, 2010)
Blood Lactate
 Assists in estabilishing and regulating training intensities
 Helps to evaluation the effects of training upon the body
 Can be used for recovery
Kawczyński et al. (2015):
- Elite Polish 100m runners
- Blood lactate continues to rise 5
minutes post sprint
Tanner & Gore, 2013; Kawczyński et al. (2015)
Muscle fibres
 Type I and II
 Predominately Type II in sprinters
 Type II higher in PCr, glycogen and
phosphorylase
 100m Sprinter:
Type I fibres: 20-30%
Type II fibres: 70-80%
Bosch & Klomp, 2005; Baechle & Earle, 2008 Maughan & Gleeson, 2010
Overview of Acute Fatigue Causes -
 Fatigue – ‘’inability to maintain a given or expected
force or power output’’ (Maughan & Gleeson, 2010,
pg. 90)
 Sprinting performance is highly correlated with ability to
maintain reach and uphold maximal velocity
 After peak velocity has been achieved (50-60m)
 Limited PCr for ATP resynthesis
- Rise in Pi, H+ and lactate ion
Maughan & Gleeson, 2010
Injury Analysis
• Hamstring Strain Injuries (acute)
• Navicular Stress Fractures (chronic)
• Achilles Tendinopathy (chronic)
Injury Analysis of Sprinting
Hamstring Strain Injuries
Track & field injury rate – 3.1-169.8 per 100 athletes
• Hamstrings muscles
- Semimembranosus
- Semitendinosus
- Biceps Femoris Long Head (BFLH)
- Biceps Femoris Short Head (BFSH)
• Characteristics of BFLH and BFSH
BFLH - Shorter fascicles
BFSH - Longer fascicles
• Late Swing Phase
• Grade I to Grade III strains
• Predisposing factors: 1) Age
2) Previous HSI
3) Previous HSI tissue volume
4) Strength Imbalances
5) Flexibility
6) Fatigue
• Prevention – Muscle Strengthening & Flexibility Training
RAZORS NOT NORDICSEdouard & Alsonso, 2013;
Other Injuries
Achilles Tendinopathy –
- Most common overuse injury in sprinters and hurdlers
- Age, gender, weight, diabetes, tight and/or weak calf muscles, poor calf endurance, poor hip/ knee stability
and/or stiff joint of foot
- High repetitive forces of sprinting, stiffness of footwear, hill sprinting
- Eccentric calf-muscle training
 Straight knee and bent knee
- Surgery
Navicular Stress Fracture –
- (*tarsal navicular stress fractures (Brukner et al. (1998)
- Medial and longitudinal arch pain, or along dorsum of foot
- 6-8 weeks immobilization
- Gradual return, 6 weeks rehabilition (mobilization & strengthening)
 average return time: 5.6 months
Alfredson et al., 1998; Brukner et al., 1998; Eduouard & Alonso, 2013; Ferry et al., 2015
Training & Testing
• Main targets of training
• Testing for 100m sprinters
Main targets of training
 Strength and Power
- Eccentric and concentric force capacity to decrease ground contact time &
increase GRF
 Maximal - force (acceleration)
 RFD (maximal velocity)
 SSC --> Plyometrics
- Enhance elastic energy of muscles
 Triple extension exercises – hip to knee to ankle
- Deadlifts, squats, snatches, cleans and jerks.
Jeffreys, 2013; Moir, 2015
Testing
 Isometric and dynamic of maximal strength
 Rate of Force Development (RFD) – Explosive Muscular Strength
- Within a 100ms time period
 Low-load speed-strength
- BW vertical jump
 Reactive Strength
- Drop jump
- Leg stiffness ) - (*maximal speed)
- Spring-Mass Model!!
- Hopping
 Voluntary Maximal Isometric Strength – level of performance
 Absolute Maximal Strength
Chelly& Denis, 2000; Moir, 2015
NI Athletics Qualifying Standards
http://www.nirunning.co.uk/documents/Commonwealth%20Games%20Standards.pdf
Summary
 Improve strength to allow greater ground reaction forces during the toe-
off phase
 Limit the touchdown-distance; and therefore frictional forces of braking
 DEPENDS ON REQUIREMENTS OF ATHLETE
Anthropometric…..Age……Gender.....Technique……
Weaknesses…..Flexibility…..Current Training Status
Thanks for Listening!!

The 100m Sprint: a Basic Needs Analysis

  • 1.
    The 100 MetreSprint: A Needs Analysis BY JILL COSTLEY
  • 2.
    Outcomes  Gain abasic understanding of the main International Association of Athletics Federations (IAAF) rules.  Age classifications, the start, the race & the finish  Appreciate the movement patterns of running (including the mechanics of acceleration and maximal velocity running)  Understand the energy systems and muscle fibres utilised within the 100m sprint  Describe the mechanism of hamstring strain injuries  Describe navicular stress fractures and Achilles tendinopathies  Apply the Needs Analysis to training: training and testing
  • 3.
    The 100 Metre(m)Sprint Performance Criterion - time taken to run 100 metres
  • 4.
    Basic Overview •Classification -age •Lanes & Lane Infringement •The Start & Starting Blocks •The Race & Finishing
  • 5.
    Age Classifications  U13Boys and Girls  U15 Boys and Girls  U17 Men and Women  U20 Men and Women  Seniors – at least 20 years old  Masters – at least 35 years old
  • 6.
    The Lane Lane Infringement Disqualification •White lines/ kerbs •No infringement if forced out
  • 7.
    Starting Blocks –Compulsory  Rigid & fixed  International Comp - Linked to Start Information System The Start  ‘’On your marks’’, ‘’set’’  report of gun  Starter may withdraw competitors from the marks  Warning  disqualification  False start (≤ 0.100s) = disqualification
  • 8.
     Performance Criterion- time taken to run 100 metres  Times from fully automatic timing system • Photo Finish System • Any body part (head, neck, arms, torso, legs, hands or feet) ≥20 minutes between last heat and fist heat of successive rounds (Maughan & Gleeson, 2010; Dick, 2012; IAAF, 2016)
  • 9.
    Movement Patterns • GaitAnalysis • Breakdown of a Stride • Mechanics • Brief Comparisons
  • 10.
     Elite male– 9.58s to 11s • Male world record – 9.58s (Berlin, 2009) - Usain Bolt (Jamaica)  Elite female – 2012 Olympic final – average of 10.87s • Female world record – 10.49s (Seoul, 1988) - Florence Griffith-Joyner (America) Ross et al. (2001); McGinnis, 2005
  • 11.
    Running Velocity =Stride Length x Stride Frequency  Stride:  Stride length: the distance from the placement of one foot to the next placement of the same foot  Stride frequency: the number of strides within a given time (usually per minute)  Walking base (aka stride width or base of support) Levine et al., 2012 Running – Gait
  • 12.
    Support (Stance) Phase: 1.Touchdown (D) 2. Mid-stance 3. Take-off (E) Flight (Swing/ Aerial) Phase: 1. Early-swing(B) 2. Mid-swing 3. Late-swing (C) One Movement Cycle (Right Leg on Model)
  • 13.
  • 14.
    Reaction – Acceleration(69%) – Maximum Velocity – Speed Maintenance Ross et al. (2001);
  • 15.
    Reaction time Time intervalbetween the stimulus provided by the shot of the Starter’s gun and the initiation of a response form the sprinter through movement  Contributes 1-2% to 100m performance  Relationship of sprint performance & Male vs female  False start - < 0.100s  Human ability could exceed this  Men & Women… Pain & Hibbs, 2007; Babic & Delalija, 2009; Pavlovic et al., 2014; IAAF, 2016
  • 16.
    Newton’s Laws ofMotion  Law of Inertia - ‘’a body will continue in its state of res or uniform motion in a straight line unless acted upon by an external force’’ (Griffin & Watkins, , pg. 235).  Law of Acceleration - ‘’the change of motion of an object is proportional to the force impressed; and is made in the direction of the straight line in which the force is impressed’’ (McGinnis, 2013, pg. 98)  Law of Action-Reaction – ‘To every action there is always opposed an equal reaction’’ (McGinnis, 2013, pg. 95)
  • 17.
    Block Position –‘’Set’’ Centre of Mass Height – - ↑ (0.61-0.66m) - ← (0.16-0.19m) Factors: 1) Anthropometric Profile 2) Arm Strength Block Position - Bunched (<30cm) - Medium start (30-50cm) - Elongated start (>50cm) Mero et al., 1992 Harland & Steele, 1997 Ground-Block Angle Joint Angles
  • 18.
    Block Clearance Primary MusclesUtilised for Force Production: gluteus maximus, biceps femoris, vastus lateralis, rectus femoris & gastrocnemius Sufficient Vertical Impulse; Maximal Horizontal Impulse Initiation of movement : Extension of hip & knee : Decrease of ankle joint angle - Pre-stretch for SSC Elite vs Non-Elite Greater block velocity and acceleration Medium Start Explosive movement against blocks Low clearance angle Harland & Steele,1997 Mero et al., 1992
  • 19.
    Acceleration Initial Strides - COGahead of touchdown - Lengthen first stride Flight and ground contact time of elite male sprinters during the first two steps following block clearance (Harland & Steele, 1997)
  • 20.
  • 21.
    Maximal Velocity Sprinting Spring-MassModel  Energy cannot be destroyed or created; it converts from one form into another  Gravitational potential energy (GPE) and kinetic energy (KE)  Spring - leg; Circle – hip  Touchdown to mid-stance  compression  KE to PE  Mid-stance to take-off  Extension and recoil  PE to KE Daly, 1991; Ferris et al, 1998; Chelly & Denis, 2000)
  • 23.
  • 24.
  • 27.
    The Elite - Greatersprint velocity is achieved through the production of a greater horizontal ground reaction force and not through stride frequency Weyand et al., 2000
  • 29.
    Physiological Demands • Energysystem • Blood Lactate • Causes of acute fatigue • Muscle fibre types
  • 30.
    Adenosine Triphosphate  Adenosine(adenine and ribose) and 3 phosphate groups  High energy bond between the successive phosphate groups  Hydrolysis via adenosine triphosphate (ATPase) – 7.3 cals/mole  Approximately 2s of maximal intensity  Reversible – phosphorylation via energy systems (Cramer, 2008; Wilmore et al., 2008; Maughan & Gleeson, 2010).
  • 31.
    Maughan & Gleeson(2010) Maximal Isokinetic cycling
  • 32.
    Phosphagen System (Alactic)–  Anaerobic: 0-20 seconds  Phosphocreatine (PCr) – utilised within 1.3s  Peak ATP production: 2-3s mark  glycolysis increasingly assists thereafter  High rate of ATP resynthesis  30s recovery after 100m max. sprint – 50% PCr stores replenished (McArdle et al., 2006; Spencer et al., 2005; Maughan & Gleeson, 2010)
  • 33.
    Glycolytic  Primary system: 20s – 2 minutes  Increase in contribution after 2s (PCr depletion  ‘’Anaerobic/ Fast’’ Glycolysis - Glucose or Glycogen  Pyruvate  Lactate  Slower ATP turnover than Phosphagen System so decline in performance (force output) - Fastest turnover at 5s mark (Baechle & Earle, 2008; Maughan & Gleeson, 2010).
  • 34.
    Oxidative System  Contributionis small  Aerobic – oxidises carbohydates  Inc. in duration and distance 100m Sprint Ergogenics  90-95% anaerobic and 5-10% aerobic (Maughan & Gleeson, 2010)  53% from the phosphagen system, 44% glycolytic and 3% oxidative (Bompa & Buzzichelli, 2015) (Bompa & Buzzichelli, 2015; Maughan & Gleeson, 2010)
  • 35.
    Blood Lactate  Assistsin estabilishing and regulating training intensities  Helps to evaluation the effects of training upon the body  Can be used for recovery Kawczyński et al. (2015): - Elite Polish 100m runners - Blood lactate continues to rise 5 minutes post sprint Tanner & Gore, 2013; Kawczyński et al. (2015)
  • 36.
    Muscle fibres  TypeI and II  Predominately Type II in sprinters  Type II higher in PCr, glycogen and phosphorylase  100m Sprinter: Type I fibres: 20-30% Type II fibres: 70-80% Bosch & Klomp, 2005; Baechle & Earle, 2008 Maughan & Gleeson, 2010
  • 37.
    Overview of AcuteFatigue Causes -  Fatigue – ‘’inability to maintain a given or expected force or power output’’ (Maughan & Gleeson, 2010, pg. 90)  Sprinting performance is highly correlated with ability to maintain reach and uphold maximal velocity  After peak velocity has been achieved (50-60m)  Limited PCr for ATP resynthesis - Rise in Pi, H+ and lactate ion Maughan & Gleeson, 2010
  • 38.
    Injury Analysis • HamstringStrain Injuries (acute) • Navicular Stress Fractures (chronic) • Achilles Tendinopathy (chronic)
  • 39.
    Injury Analysis ofSprinting Hamstring Strain Injuries Track & field injury rate – 3.1-169.8 per 100 athletes • Hamstrings muscles - Semimembranosus - Semitendinosus - Biceps Femoris Long Head (BFLH) - Biceps Femoris Short Head (BFSH) • Characteristics of BFLH and BFSH BFLH - Shorter fascicles BFSH - Longer fascicles • Late Swing Phase • Grade I to Grade III strains • Predisposing factors: 1) Age 2) Previous HSI 3) Previous HSI tissue volume 4) Strength Imbalances 5) Flexibility 6) Fatigue • Prevention – Muscle Strengthening & Flexibility Training RAZORS NOT NORDICSEdouard & Alsonso, 2013;
  • 40.
    Other Injuries Achilles Tendinopathy– - Most common overuse injury in sprinters and hurdlers - Age, gender, weight, diabetes, tight and/or weak calf muscles, poor calf endurance, poor hip/ knee stability and/or stiff joint of foot - High repetitive forces of sprinting, stiffness of footwear, hill sprinting - Eccentric calf-muscle training  Straight knee and bent knee - Surgery Navicular Stress Fracture – - (*tarsal navicular stress fractures (Brukner et al. (1998) - Medial and longitudinal arch pain, or along dorsum of foot - 6-8 weeks immobilization - Gradual return, 6 weeks rehabilition (mobilization & strengthening)  average return time: 5.6 months Alfredson et al., 1998; Brukner et al., 1998; Eduouard & Alonso, 2013; Ferry et al., 2015
  • 41.
    Training & Testing •Main targets of training • Testing for 100m sprinters
  • 42.
    Main targets oftraining  Strength and Power - Eccentric and concentric force capacity to decrease ground contact time & increase GRF  Maximal - force (acceleration)  RFD (maximal velocity)  SSC --> Plyometrics - Enhance elastic energy of muscles  Triple extension exercises – hip to knee to ankle - Deadlifts, squats, snatches, cleans and jerks. Jeffreys, 2013; Moir, 2015
  • 43.
    Testing  Isometric anddynamic of maximal strength  Rate of Force Development (RFD) – Explosive Muscular Strength - Within a 100ms time period  Low-load speed-strength - BW vertical jump  Reactive Strength - Drop jump - Leg stiffness ) - (*maximal speed) - Spring-Mass Model!! - Hopping  Voluntary Maximal Isometric Strength – level of performance  Absolute Maximal Strength Chelly& Denis, 2000; Moir, 2015
  • 44.
    NI Athletics QualifyingStandards http://www.nirunning.co.uk/documents/Commonwealth%20Games%20Standards.pdf
  • 45.
    Summary  Improve strengthto allow greater ground reaction forces during the toe- off phase  Limit the touchdown-distance; and therefore frictional forces of braking  DEPENDS ON REQUIREMENTS OF ATHLETE Anthropometric…..Age……Gender.....Technique…… Weaknesses…..Flexibility…..Current Training Status
  • 46.