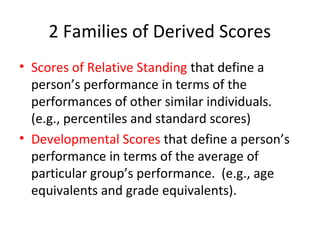
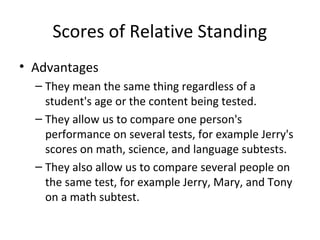
SlideShare a Scribd company logo
Scoring Performance 
• Objective v. Subjective Scoring. Objective 
scoring is based on observable qualities and 
not affected by other things. Subjective 
scoring relies on private and personal criteria 
that are not open to observation.
2 Families of Derived Scores 
• Scores of Relative Standing that define a 
person’s performance in terms of the 
performances of other similar individuals. 
(e.g., percentiles and standard scores) 
• Developmental Scores that define a person’s 
performance in terms of the average of 
particular group’s performance. (e.g., age 
equivalents and grade equivalents).
Scores of Relative Standing 
• Advantages 
– They mean the same thing regardless of a 
student's age or the content being tested. 
– They allow us to compare one person's 
performance on several tests, for example Jerry's 
scores on math, science, and language subtests. 
– They also allow us to compare several people on 
the same test, for example Jerry, Mary, and Tony 
on a math subtest.
. . . Percentiles 
• Percentiles. Express a person’s performance 
in terms of the percent of people who score 
as well or worse than the test taker 
• Used with ordinal and equal interval scales.
. . . 4 Steps in Percentile Calculation 
1. Arrange scores from best to worst. 
2. Compute the percentage of people with 
scores below the score to which you want to 
assign a percentile. 
3. Compute the percentage of people earning 
the score to which you want to assign a 
percentile. 
4. Add the percentage of people below the 
score to ½ the people earning the score.
Calculating percentiles, An Example
. . . Percentiles, Interpretation 
• In the preceding table 
– A raw score of 50 was at the 92nd percentile. Both 
students who got 50 correct get a percentile of 92. A 
percentile of 92 means that each of the two did as 
well or better than 92 percent of the test takers. 
Eight percent is equal or better. 
– A raw score of of 45 was at the 46th percentile. Each 
of the five students who got a 46 scored equal to or 
better than 46 percent of the test takers. 
– Note: is computationally impossible to earn a 
percentile of 100 or 0.
. . . Percentile Family 
• Deciles divide the percentile range into bands of 
10 percentiles. The first decile goes from 0.1 to 
9.9. The second decile goes from 10 to 19.9. etc. 
• Quartiles divide the percentile range into four 
bands, each 25 percentiles wide. The first 
quartile goes from 0.1 to 24.9; the second, from 
25 to 49.9. etc. 
• Other bands are possible – tertiles, quintiles 
dodecadiles, etc.
. . . Percentiles, concluding comments 
• Percentiles are ordinal. The difference 
between adjacent values are not the same 
across the score. 
• Because the are ordinal you cannot add, 
subtract, multiple, divide, or average them 
• The 50th percentile is the median. If the 
distribution is normal, it is also the mean and 
mode.
. . . .Standard Scores 
• Standard Scores express a person’s score in 
terms of standard deviations above or below 
the mean 
• Used with equal interval scales 
• Common Standard Scores 
– z-score ( X  
= 0, S = 1) 
– T-score ( = 50, S = 10) 
– Deviation IQ ( = 100, S = 15) 
– Normal    
Curve Equivalent ( = 50, S = 21.06) 
   
X  
   
X  
   
X
. . . Calculating z-scores 
• z = (raw score – mean)/ standard deviation 
– Example: raw score = 31, mean =27, S = 6. 
• z = (31 – 27) / 6 
• = 4/6 or .67 
• Interpretation: the person scored .67 standard deviations above 
the mean. 
– Example 2: raw score = 18, mean = 27, S = 6 
• z = (18 - 27) / 6 
• = -9 / 6 or -1.5 
• Interpretation: the person scored 1.5 standard deviations below 
the mean.
. . . Calculating any other Standard Score 
• z-scores can be changed to any other standard 
score (SS) if the mean and standard deviation 
of that SS are known with the following 
formula. 
– SS = meanss + (z) (Sss) 
– An Example: suppose we wanted to convert a z-score 
to a deviation IQ. (Recall μ = 100 and S = 
15.) A student with a z-score of .6 would earn a 
standard score of 109, that is, 100 + (15)(0.6.
. . . Stanines 
• Stanines. Short for standard nines are standard 
score bands that divide a distribution into nine 
parts. The second through eighth stanines are 0.5 
standard deviations wide. The fifth stanine is 
centered on the mean and goes from -0.25 to 
+0.25 S. The first and ninth stanines are each 
1.75 standard deviations wide. 
• Stanines were once popular, but are seldom used 
today.
Standard Scores, Advantages 
• Standard scores are equal interval scales so they 
can be added, subtracted, multiplied, divided, 
and averaged. 
• They allow two important comparisons. 
– Several scores for the same student can be directly 
compared. 
– Several individuals can be directly compared on the 
same score. 
• Warning: Standard scores are not ratio scales. 
Thus, a student with an IQ of 150 is not twice as 
smart as a student with a 75 IQ.
Standard Scores, Disadvantages 
• Standard scores are not readily interpreted by 
individuals without some measurement 
background (e.g., students and their parents). 
• Standard scores often imply greater precision 
than a test may allow.
Developmental Scores 
• Developmental scores are of two types: 
equivalents and quotients. 
• A developmental equivalent is the age or 
grade at which a raw score on a test is the 
average (mean or median) scores
Developmental Equivalent, an example 
• Suppose you tested 50 students in each of five age groups: 
6, 7, 8, 9, and 10 years of age. Assume the mean of 6 year 
olds was 15, of 7 year olds was 20, of 8 year olds was 30, of 
9 year olds was 45, and of 10 year olds was 55. 
– If Sam earns a score of 30, he would have earned the same score as the 
mean of 8 year olds. Thus Sam would earn an age equivalent of 8 – 0. 
– If Sam earned a score of 45, his age equivalent would have been 9 – 0. 
• Formats: Age equivalents always contain an hyphen to 
indicate years and months. Grade equivalents always contain 
a decimal to indicate tenths of a year. 
– 7 – 6 is seven years, six months 
– 7.6 is the 7 and six tenths grade or 6/10 through seventh grade.
Developmental Scores, Quotients 
• Developmental quotients (DQs) are the ratio 
of developmental age divided by 
chronological age (CA), with the quotient 
multiplied by 100. DQs are always expressed 
as whole numbers. 
– Social Quotient = (social age/CA)(100) 
– Intelligence Quotient = (mental age/CA)(100) 
• Note: IQs are no longer calculated this way.
Avoid Using Developmental Scores 
• These scores are fatally flawed. 
– Systematic misinterpretation 
– Dubious interpolation and extrapolation 
– Promotion of typological thinking 
– False standard of performance 
– Scales are ordinal, not equal interval 
– Variance differ at different ages so quotients are 
uninterpretible.
Developmental Scores Conclusion 
• The International Reading Association, the 
American Psychological Association, the 
National Council on Measurement in 
Education, and the Council for Exceptional 
Children do not support the use of 
developmental scores.
Scores in Criterion-Referenced Assessments 
• Single-Item Scores 
– Dichotomous scores (pass/fail, right/wrong) 
– Continuum scores 
• partial credit (e.g., number of correct letters or digits) 
• how the score was obtained (e.g., amount of assistance 
needed to perform) 
• Quality of the performance (e.g., novice to expert)
Criterion-Referenced Scores 
• Multiple Item Scores 
– Percent Correct (correct responses ÷ number of 
questions) 
– Accuracy (correct responses ÷ attempted responses) 
– Labels for Accuracy 
• Frustration level (<85%) 
• Instructional level (between 85% and 95%) 
• Independent level (>95%) 
– Retention (responses correctly recalled ÷ number of 
responses learned) 
– Rate (correct responses per minute)

More Related Content

What's hot

Reliability
ReliabilityReliability
Reliability
Roi Xcel
 
Test interpretation
Test interpretationTest interpretation
Test interpretation
Fatima Shafqat
 
Testing and Test Construction
Testing and Test ConstructionTesting and Test Construction
Testing and Test Construction
songoten77
 
Qualities of a Good Test
Qualities of a Good TestQualities of a Good Test
Qualities of a Good Test
Dr. Amjad Ali Arain
 
Reliability (assessment of student learning I)
Reliability (assessment of student learning I)Reliability (assessment of student learning I)
Reliability (assessment of student learning I)
Rey-ra Mora
 
Validity and objectivity of tests
Validity and objectivity of testsValidity and objectivity of tests
Validity and objectivity of tests
bushra mushtaq
 
OBJECTIVITY OF TESTS ppt.pptx
OBJECTIVITY OF TESTS ppt.pptxOBJECTIVITY OF TESTS ppt.pptx
OBJECTIVITY OF TESTS ppt.pptx
Forum of Blended Learning
 
Validity and reliability in assessment.
Validity and reliability in assessment. Validity and reliability in assessment.
Validity and reliability in assessment.
Tarek Tawfik Amin
 
Testing, assessment, measurement and evaluation definition
Testing, assessment, measurement and evaluation definitionTesting, assessment, measurement and evaluation definition
Testing, assessment, measurement and evaluation definition
norazmi danuri
 
Characteristics of a good test
Characteristics of a good testCharacteristics of a good test
Characteristics of a good test
cyrilcoscos
 
Test item formats: definition, types, pros and cons
Test item formats: definition, types, pros and consTest item formats: definition, types, pros and cons
Test item formats: definition, types, pros and cons
Mohamed Benhima
 
Test, measurement, assessment & evaluation
Test, measurement, assessment & evaluationTest, measurement, assessment & evaluation
Test, measurement, assessment & evaluation
DrSindhuAlmas
 
Test standardization and norming
Test standardization and normingTest standardization and norming
Test standardization and norming
Hannah Grace Gilo
 
What is assessment ‫‬
What is assessment ‫‬What is assessment ‫‬
What is assessment ‫‬
Ali Shaqour
 
teacher made test Vs standardized test
 teacher made test Vs standardized test teacher made test Vs standardized test
teacher made test Vs standardized test
athiranandan
 
Meaning of Test, Testing and Evaluation
Meaning of Test, Testing and EvaluationMeaning of Test, Testing and Evaluation
Meaning of Test, Testing and Evaluation
Dr. Amjad Ali Arain
 
Educational testing and assessment
Educational testing and assessmentEducational testing and assessment
Educational testing and assessment
Abdul Majid
 
Criteria of a good test
Criteria of a good testCriteria of a good test
Criteria of a good test
erinio mahusay
 
Types of tests in measurement and evaluation
Types of tests in measurement and evaluationTypes of tests in measurement and evaluation
Types of tests in measurement and evaluation
Murathoti Rajendranathbabu
 
Qualities of Good Test (Usability, Reliability, & Validity)
Qualities of Good Test (Usability, Reliability, & Validity)Qualities of Good Test (Usability, Reliability, & Validity)
Qualities of Good Test (Usability, Reliability, & Validity)
HennaAnsari
 

What's hot (20)

Reliability
ReliabilityReliability
Reliability
 
Test interpretation
Test interpretationTest interpretation
Test interpretation
 
Testing and Test Construction
Testing and Test ConstructionTesting and Test Construction
Testing and Test Construction
 
Qualities of a Good Test
Qualities of a Good TestQualities of a Good Test
Qualities of a Good Test
 
Reliability (assessment of student learning I)
Reliability (assessment of student learning I)Reliability (assessment of student learning I)
Reliability (assessment of student learning I)
 
Validity and objectivity of tests
Validity and objectivity of testsValidity and objectivity of tests
Validity and objectivity of tests
 
OBJECTIVITY OF TESTS ppt.pptx
OBJECTIVITY OF TESTS ppt.pptxOBJECTIVITY OF TESTS ppt.pptx
OBJECTIVITY OF TESTS ppt.pptx
 
Validity and reliability in assessment.
Validity and reliability in assessment. Validity and reliability in assessment.
Validity and reliability in assessment.
 
Testing, assessment, measurement and evaluation definition
Testing, assessment, measurement and evaluation definitionTesting, assessment, measurement and evaluation definition
Testing, assessment, measurement and evaluation definition
 
Characteristics of a good test
Characteristics of a good testCharacteristics of a good test
Characteristics of a good test
 
Test item formats: definition, types, pros and cons
Test item formats: definition, types, pros and consTest item formats: definition, types, pros and cons
Test item formats: definition, types, pros and cons
 
Test, measurement, assessment & evaluation
Test, measurement, assessment & evaluationTest, measurement, assessment & evaluation
Test, measurement, assessment & evaluation
 
Test standardization and norming
Test standardization and normingTest standardization and norming
Test standardization and norming
 
What is assessment ‫‬
What is assessment ‫‬What is assessment ‫‬
What is assessment ‫‬
 
teacher made test Vs standardized test
 teacher made test Vs standardized test teacher made test Vs standardized test
teacher made test Vs standardized test
 
Meaning of Test, Testing and Evaluation
Meaning of Test, Testing and EvaluationMeaning of Test, Testing and Evaluation
Meaning of Test, Testing and Evaluation
 
Educational testing and assessment
Educational testing and assessmentEducational testing and assessment
Educational testing and assessment
 
Criteria of a good test
Criteria of a good testCriteria of a good test
Criteria of a good test
 
Types of tests in measurement and evaluation
Types of tests in measurement and evaluationTypes of tests in measurement and evaluation
Types of tests in measurement and evaluation
 
Qualities of Good Test (Usability, Reliability, & Validity)
Qualities of Good Test (Usability, Reliability, & Validity)Qualities of Good Test (Usability, Reliability, & Validity)
Qualities of Good Test (Usability, Reliability, & Validity)
 

Viewers also liked

Interpreting Test Scores
Interpreting Test ScoresInterpreting Test Scores
Interpreting Test Scores
Elton John Embodo
 
Interpretation of scores and the grading system in public schools
Interpretation of scores and the grading system in public schoolsInterpretation of scores and the grading system in public schools
Interpretation of scores and the grading system in public schools
Airah Torres
 
Statistics for interpreting test scores
Statistics for interpreting test scoresStatistics for interpreting test scores
Statistics for interpreting test scores
mpazhou
 
Interpretation of Assessment Results
Interpretation of Assessment ResultsInterpretation of Assessment Results
Interpretation of Assessment Results
Rica Joy Pontilar
 
Administering,scoring and reporting a test ppt
Administering,scoring and reporting a test pptAdministering,scoring and reporting a test ppt
Administering,scoring and reporting a test ppt
Manali Solanki
 
Methods of interpreting test scores by Dr.Shazia Zamir
Methods of interpreting test scores by Dr.Shazia Zamir Methods of interpreting test scores by Dr.Shazia Zamir
Methods of interpreting test scores by Dr.Shazia Zamir
Dr.Shazia Zamir
 
Descriptive statistics
Descriptive statisticsDescriptive statistics
Descriptive statistics
mercy rani
 
Test interpretation and report writing
Test interpretation and report writingTest interpretation and report writing
Test interpretation and report writing
Carlo Magno
 
KINDS OF TEST
KINDS OF TESTKINDS OF TEST
KINDS OF TEST
yamih 88
 
Question Paper Setting
Question Paper SettingQuestion Paper Setting
Question Paper Setting
Kathirvel Ayyaswamy
 
Assessment of development sunil
Assessment of development sunilAssessment of development sunil
Assessment of development sunil
Sunil Agrawal
 
Describing and Interpreting Test Scores: Frequency Distribution to Measures o...
Describing and Interpreting Test Scores: Frequency Distribution to Measures o...Describing and Interpreting Test Scores: Frequency Distribution to Measures o...
Describing and Interpreting Test Scores: Frequency Distribution to Measures o...
Mr. Ronald Quileste, PhD
 
Criterion and Norm - Referenced Interpretations and the Four Frames of Reference
Criterion and Norm - Referenced Interpretations and the Four Frames of ReferenceCriterion and Norm - Referenced Interpretations and the Four Frames of Reference
Criterion and Norm - Referenced Interpretations and the Four Frames of Reference
Mr. Ronald Quileste, PhD
 
Exam Preparation
Exam PreparationExam Preparation
Exam Preparation
Damian T. Gordon
 
Blueprint of exam questions
Blueprint of exam questions Blueprint of exam questions
Blueprint of exam questions
Dr.Shahid Hassan
 
Types of Test
Types of Test Types of Test
Types of Test
jasper gaboc
 
Types of test
Types of testTypes of test
Types of test
Nhisa Tumanda
 
Blueprint in education
Blueprint in educationBlueprint in education
Blueprint in education
Kiran Kushwaha
 

Viewers also liked (18)

Interpreting Test Scores
Interpreting Test ScoresInterpreting Test Scores
Interpreting Test Scores
 
Interpretation of scores and the grading system in public schools
Interpretation of scores and the grading system in public schoolsInterpretation of scores and the grading system in public schools
Interpretation of scores and the grading system in public schools
 
Statistics for interpreting test scores
Statistics for interpreting test scoresStatistics for interpreting test scores
Statistics for interpreting test scores
 
Interpretation of Assessment Results
Interpretation of Assessment ResultsInterpretation of Assessment Results
Interpretation of Assessment Results
 
Administering,scoring and reporting a test ppt
Administering,scoring and reporting a test pptAdministering,scoring and reporting a test ppt
Administering,scoring and reporting a test ppt
 
Methods of interpreting test scores by Dr.Shazia Zamir
Methods of interpreting test scores by Dr.Shazia Zamir Methods of interpreting test scores by Dr.Shazia Zamir
Methods of interpreting test scores by Dr.Shazia Zamir
 
Descriptive statistics
Descriptive statisticsDescriptive statistics
Descriptive statistics
 
Test interpretation and report writing
Test interpretation and report writingTest interpretation and report writing
Test interpretation and report writing
 
KINDS OF TEST
KINDS OF TESTKINDS OF TEST
KINDS OF TEST
 
Question Paper Setting
Question Paper SettingQuestion Paper Setting
Question Paper Setting
 
Assessment of development sunil
Assessment of development sunilAssessment of development sunil
Assessment of development sunil
 
Describing and Interpreting Test Scores: Frequency Distribution to Measures o...
Describing and Interpreting Test Scores: Frequency Distribution to Measures o...Describing and Interpreting Test Scores: Frequency Distribution to Measures o...
Describing and Interpreting Test Scores: Frequency Distribution to Measures o...
 
Criterion and Norm - Referenced Interpretations and the Four Frames of Reference
Criterion and Norm - Referenced Interpretations and the Four Frames of ReferenceCriterion and Norm - Referenced Interpretations and the Four Frames of Reference
Criterion and Norm - Referenced Interpretations and the Four Frames of Reference
 
Exam Preparation
Exam PreparationExam Preparation
Exam Preparation
 
Blueprint of exam questions
Blueprint of exam questions Blueprint of exam questions
Blueprint of exam questions
 
Types of Test
Types of Test Types of Test
Types of Test
 
Types of test
Types of testTypes of test
Types of test
 
Blueprint in education
Blueprint in educationBlueprint in education
Blueprint in education
 

Similar to Test scores

Spe 501 class 11
Spe 501 class 11Spe 501 class 11
Spe 501 class 11
jzurheide
 
Six steps for avoiding misinterpretations
Six steps for avoiding misinterpretationsSix steps for avoiding misinterpretations
Six steps for avoiding misinterpretations
Abdul Majid
 
ESE444/544 - Types of Assessment
ESE444/544 - Types of AssessmentESE444/544 - Types of Assessment
ESE444/544 - Types of Assessment
amacargel
 
Unit 2 - Statistics
Unit 2 - StatisticsUnit 2 - Statistics
Unit 2 - Statistics
Bruce Coulter
 
Quantitative Research Design.pptx
Quantitative Research Design.pptxQuantitative Research Design.pptx
Quantitative Research Design.pptx
Alok Kumar Gaurav
 
Test norms.pptx
Test norms.pptxTest norms.pptx
Test norms.pptx
MahnoorHashmi
 
Measurement Scales in Research
Measurement Scales in Research Measurement Scales in Research
Measurement Scales in Research
Dr. Sarita Anand
 
Unit 4.pptx
Unit 4.pptxUnit 4.pptx
Unit 4.pptx
Samruddhi Chepe
 
psychometrics ch 2 -2016.ppt
psychometrics ch 2 -2016.pptpsychometrics ch 2 -2016.ppt
psychometrics ch 2 -2016.ppt
DejeneDay
 
7 measurement & questionnaires design (Dr. Mai,2014)
7 measurement & questionnaires design (Dr. Mai,2014)7 measurement & questionnaires design (Dr. Mai,2014)
7 measurement & questionnaires design (Dr. Mai,2014)
Phong Đá
 
Location Scores
Location  ScoresLocation  Scores
Location Scores
Sr Edith Bogue
 
Norms and the Meaning of Test Scores
Norms and the Meaning of Test ScoresNorms and the Meaning of Test Scores
Norms and the Meaning of Test Scores
MushfikFRahman
 
Quantitative research
Quantitative researchQuantitative research
Quantitative research
bellabellebell
 
Grading System BEd notes first year.pptx
Grading System BEd notes first year.pptxGrading System BEd notes first year.pptx
Grading System BEd notes first year.pptx
babyshankar419
 
Descriptive statistics
Descriptive statisticsDescriptive statistics
Descriptive statistics
Aiden Yeh
 
PAD 503 Module 1 Slides.pptx
PAD 503 Module 1 Slides.pptxPAD 503 Module 1 Slides.pptx
PAD 503 Module 1 Slides.pptx
NathanielWright9
 
Standardized assessments
Standardized assessmentsStandardized assessments
Standardized assessments
jzurheide
 
Chapter 5
Chapter 5Chapter 5
Chapter 5
fosterlh
 
Location scores
Location scoresLocation scores
Location scores
Sr Edith Bogue
 
35878 Topic Discussion5Number of Pages 1 (Double Spaced).docx
35878 Topic Discussion5Number of Pages 1 (Double Spaced).docx35878 Topic Discussion5Number of Pages 1 (Double Spaced).docx
35878 Topic Discussion5Number of Pages 1 (Double Spaced).docx
rhetttrevannion
 

Similar to Test scores (20)

Spe 501 class 11
Spe 501 class 11Spe 501 class 11
Spe 501 class 11
 
Six steps for avoiding misinterpretations
Six steps for avoiding misinterpretationsSix steps for avoiding misinterpretations
Six steps for avoiding misinterpretations
 
ESE444/544 - Types of Assessment
ESE444/544 - Types of AssessmentESE444/544 - Types of Assessment
ESE444/544 - Types of Assessment
 
Unit 2 - Statistics
Unit 2 - StatisticsUnit 2 - Statistics
Unit 2 - Statistics
 
Quantitative Research Design.pptx
Quantitative Research Design.pptxQuantitative Research Design.pptx
Quantitative Research Design.pptx
 
Test norms.pptx
Test norms.pptxTest norms.pptx
Test norms.pptx
 
Measurement Scales in Research
Measurement Scales in Research Measurement Scales in Research
Measurement Scales in Research
 
Unit 4.pptx
Unit 4.pptxUnit 4.pptx
Unit 4.pptx
 
psychometrics ch 2 -2016.ppt
psychometrics ch 2 -2016.pptpsychometrics ch 2 -2016.ppt
psychometrics ch 2 -2016.ppt
 
7 measurement & questionnaires design (Dr. Mai,2014)
7 measurement & questionnaires design (Dr. Mai,2014)7 measurement & questionnaires design (Dr. Mai,2014)
7 measurement & questionnaires design (Dr. Mai,2014)
 
Location Scores
Location  ScoresLocation  Scores
Location Scores
 
Norms and the Meaning of Test Scores
Norms and the Meaning of Test ScoresNorms and the Meaning of Test Scores
Norms and the Meaning of Test Scores
 
Quantitative research
Quantitative researchQuantitative research
Quantitative research
 
Grading System BEd notes first year.pptx
Grading System BEd notes first year.pptxGrading System BEd notes first year.pptx
Grading System BEd notes first year.pptx
 
Descriptive statistics
Descriptive statisticsDescriptive statistics
Descriptive statistics
 
PAD 503 Module 1 Slides.pptx
PAD 503 Module 1 Slides.pptxPAD 503 Module 1 Slides.pptx
PAD 503 Module 1 Slides.pptx
 
Standardized assessments
Standardized assessmentsStandardized assessments
Standardized assessments
 
Chapter 5
Chapter 5Chapter 5
Chapter 5
 
Location scores
Location scoresLocation scores
Location scores
 
35878 Topic Discussion5Number of Pages 1 (Double Spaced).docx
35878 Topic Discussion5Number of Pages 1 (Double Spaced).docx35878 Topic Discussion5Number of Pages 1 (Double Spaced).docx
35878 Topic Discussion5Number of Pages 1 (Double Spaced).docx
 

More from sungwon_ciel

Ch27
Ch27Ch27
Ch29
Ch29Ch29
Ch28
Ch28Ch28
Ch26
Ch26Ch26
Ch24
Ch24Ch24
Ch23
Ch23Ch23
Ch22
Ch22Ch22
Ch21
Ch21Ch21
Ch20
Ch20Ch20
Ch18
Ch18Ch18
Ch17
Ch17Ch17
Ch15
Ch15Ch15
Pp ch16
Pp ch16Pp ch16
Pp ch16
sungwon_ciel
 
Pp ch12
Pp ch12Pp ch12
Pp ch12
sungwon_ciel
 
Pp ch11
Pp ch11Pp ch11
Pp ch11
sungwon_ciel
 
Pp ch14
Pp ch14Pp ch14
Pp ch14
sungwon_ciel
 
Pp ch13
Pp ch13Pp ch13
Pp ch13
sungwon_ciel
 
Pp ch09
Pp ch09Pp ch09
Pp ch09
sungwon_ciel
 
Ch29
Ch29Ch29
Pp ch08
Pp ch08Pp ch08
Pp ch08
sungwon_ciel
 

More from sungwon_ciel (20)

Ch27
Ch27Ch27
Ch27
 
Ch29
Ch29Ch29
Ch29
 
Ch28
Ch28Ch28
Ch28
 
Ch26
Ch26Ch26
Ch26
 
Ch24
Ch24Ch24
Ch24
 
Ch23
Ch23Ch23
Ch23
 
Ch22
Ch22Ch22
Ch22
 
Ch21
Ch21Ch21
Ch21
 
Ch20
Ch20Ch20
Ch20
 
Ch18
Ch18Ch18
Ch18
 
Ch17
Ch17Ch17
Ch17
 
Ch15
Ch15Ch15
Ch15
 
Pp ch16
Pp ch16Pp ch16
Pp ch16
 
Pp ch12
Pp ch12Pp ch12
Pp ch12
 
Pp ch11
Pp ch11Pp ch11
Pp ch11
 
Pp ch14
Pp ch14Pp ch14
Pp ch14
 
Pp ch13
Pp ch13Pp ch13
Pp ch13
 
Pp ch09
Pp ch09Pp ch09
Pp ch09
 
Ch29
Ch29Ch29
Ch29
 
Pp ch08
Pp ch08Pp ch08
Pp ch08
 

Test scores

  • 1. Scoring Performance • Objective v. Subjective Scoring. Objective scoring is based on observable qualities and not affected by other things. Subjective scoring relies on private and personal criteria that are not open to observation.
  • 2. 2 Families of Derived Scores • Scores of Relative Standing that define a person’s performance in terms of the performances of other similar individuals. (e.g., percentiles and standard scores) • Developmental Scores that define a person’s performance in terms of the average of particular group’s performance. (e.g., age equivalents and grade equivalents).
  • 3. Scores of Relative Standing • Advantages – They mean the same thing regardless of a student's age or the content being tested. – They allow us to compare one person's performance on several tests, for example Jerry's scores on math, science, and language subtests. – They also allow us to compare several people on the same test, for example Jerry, Mary, and Tony on a math subtest.
  • 4. . . . Percentiles • Percentiles. Express a person’s performance in terms of the percent of people who score as well or worse than the test taker • Used with ordinal and equal interval scales.
  • 5. . . . 4 Steps in Percentile Calculation 1. Arrange scores from best to worst. 2. Compute the percentage of people with scores below the score to which you want to assign a percentile. 3. Compute the percentage of people earning the score to which you want to assign a percentile. 4. Add the percentage of people below the score to ½ the people earning the score.
  • 7. . . . Percentiles, Interpretation • In the preceding table – A raw score of 50 was at the 92nd percentile. Both students who got 50 correct get a percentile of 92. A percentile of 92 means that each of the two did as well or better than 92 percent of the test takers. Eight percent is equal or better. – A raw score of of 45 was at the 46th percentile. Each of the five students who got a 46 scored equal to or better than 46 percent of the test takers. – Note: is computationally impossible to earn a percentile of 100 or 0.
  • 8. . . . Percentile Family • Deciles divide the percentile range into bands of 10 percentiles. The first decile goes from 0.1 to 9.9. The second decile goes from 10 to 19.9. etc. • Quartiles divide the percentile range into four bands, each 25 percentiles wide. The first quartile goes from 0.1 to 24.9; the second, from 25 to 49.9. etc. • Other bands are possible – tertiles, quintiles dodecadiles, etc.
  • 9. . . . Percentiles, concluding comments • Percentiles are ordinal. The difference between adjacent values are not the same across the score. • Because the are ordinal you cannot add, subtract, multiple, divide, or average them • The 50th percentile is the median. If the distribution is normal, it is also the mean and mode.
  • 10. . . . .Standard Scores • Standard Scores express a person’s score in terms of standard deviations above or below the mean • Used with equal interval scales • Common Standard Scores – z-score ( X = 0, S = 1) – T-score ( = 50, S = 10) – Deviation IQ ( = 100, S = 15) – Normal   Curve Equivalent ( = 50, S = 21.06)   X   X   X
  • 11. . . . Calculating z-scores • z = (raw score – mean)/ standard deviation – Example: raw score = 31, mean =27, S = 6. • z = (31 – 27) / 6 • = 4/6 or .67 • Interpretation: the person scored .67 standard deviations above the mean. – Example 2: raw score = 18, mean = 27, S = 6 • z = (18 - 27) / 6 • = -9 / 6 or -1.5 • Interpretation: the person scored 1.5 standard deviations below the mean.
  • 12. . . . Calculating any other Standard Score • z-scores can be changed to any other standard score (SS) if the mean and standard deviation of that SS are known with the following formula. – SS = meanss + (z) (Sss) – An Example: suppose we wanted to convert a z-score to a deviation IQ. (Recall μ = 100 and S = 15.) A student with a z-score of .6 would earn a standard score of 109, that is, 100 + (15)(0.6.
  • 13. . . . Stanines • Stanines. Short for standard nines are standard score bands that divide a distribution into nine parts. The second through eighth stanines are 0.5 standard deviations wide. The fifth stanine is centered on the mean and goes from -0.25 to +0.25 S. The first and ninth stanines are each 1.75 standard deviations wide. • Stanines were once popular, but are seldom used today.
  • 14. Standard Scores, Advantages • Standard scores are equal interval scales so they can be added, subtracted, multiplied, divided, and averaged. • They allow two important comparisons. – Several scores for the same student can be directly compared. – Several individuals can be directly compared on the same score. • Warning: Standard scores are not ratio scales. Thus, a student with an IQ of 150 is not twice as smart as a student with a 75 IQ.
  • 15. Standard Scores, Disadvantages • Standard scores are not readily interpreted by individuals without some measurement background (e.g., students and their parents). • Standard scores often imply greater precision than a test may allow.
  • 16. Developmental Scores • Developmental scores are of two types: equivalents and quotients. • A developmental equivalent is the age or grade at which a raw score on a test is the average (mean or median) scores
  • 17. Developmental Equivalent, an example • Suppose you tested 50 students in each of five age groups: 6, 7, 8, 9, and 10 years of age. Assume the mean of 6 year olds was 15, of 7 year olds was 20, of 8 year olds was 30, of 9 year olds was 45, and of 10 year olds was 55. – If Sam earns a score of 30, he would have earned the same score as the mean of 8 year olds. Thus Sam would earn an age equivalent of 8 – 0. – If Sam earned a score of 45, his age equivalent would have been 9 – 0. • Formats: Age equivalents always contain an hyphen to indicate years and months. Grade equivalents always contain a decimal to indicate tenths of a year. – 7 – 6 is seven years, six months – 7.6 is the 7 and six tenths grade or 6/10 through seventh grade.
  • 18. Developmental Scores, Quotients • Developmental quotients (DQs) are the ratio of developmental age divided by chronological age (CA), with the quotient multiplied by 100. DQs are always expressed as whole numbers. – Social Quotient = (social age/CA)(100) – Intelligence Quotient = (mental age/CA)(100) • Note: IQs are no longer calculated this way.
  • 19. Avoid Using Developmental Scores • These scores are fatally flawed. – Systematic misinterpretation – Dubious interpolation and extrapolation – Promotion of typological thinking – False standard of performance – Scales are ordinal, not equal interval – Variance differ at different ages so quotients are uninterpretible.
  • 20. Developmental Scores Conclusion • The International Reading Association, the American Psychological Association, the National Council on Measurement in Education, and the Council for Exceptional Children do not support the use of developmental scores.
  • 21. Scores in Criterion-Referenced Assessments • Single-Item Scores – Dichotomous scores (pass/fail, right/wrong) – Continuum scores • partial credit (e.g., number of correct letters or digits) • how the score was obtained (e.g., amount of assistance needed to perform) • Quality of the performance (e.g., novice to expert)
  • 22. Criterion-Referenced Scores • Multiple Item Scores – Percent Correct (correct responses ÷ number of questions) – Accuracy (correct responses ÷ attempted responses) – Labels for Accuracy • Frustration level (<85%) • Instructional level (between 85% and 95%) • Independent level (>95%) – Retention (responses correctly recalled ÷ number of responses learned) – Rate (correct responses per minute)