Downloaded 453 times
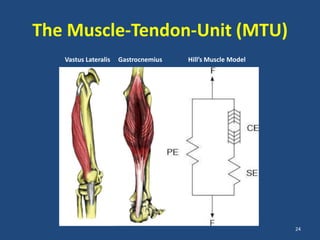
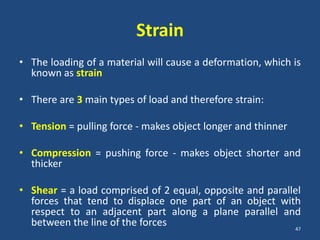
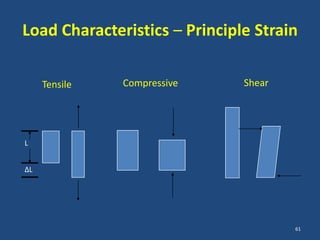
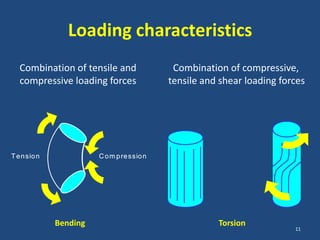
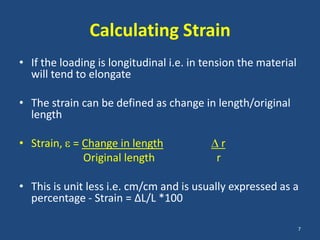
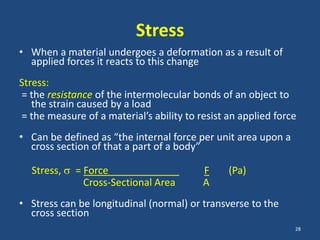
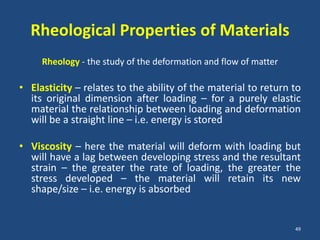

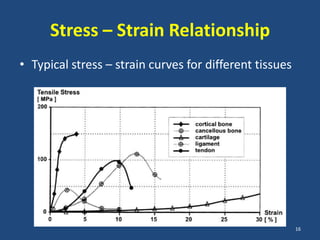
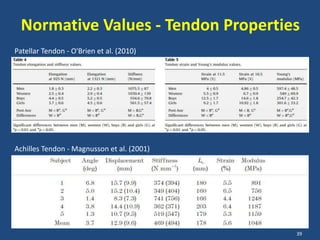
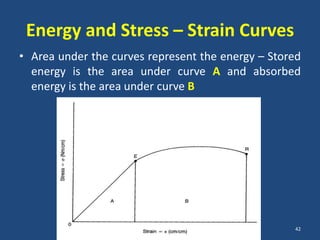
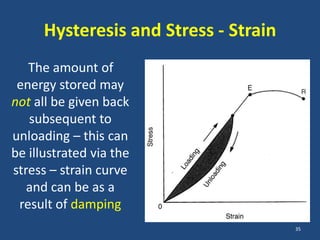
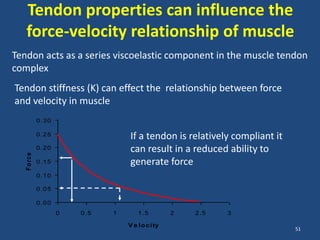
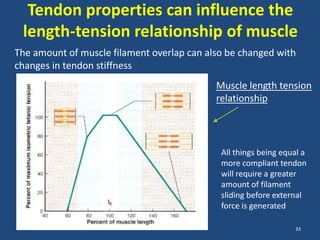
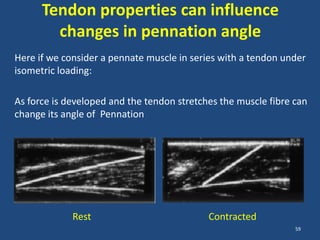
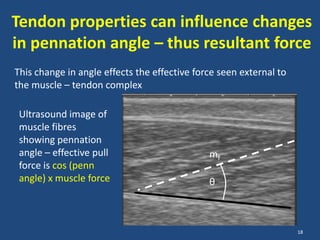
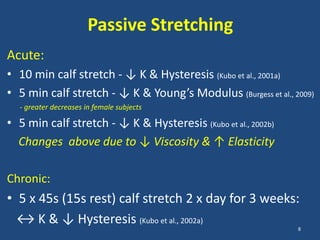
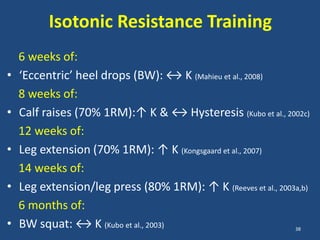
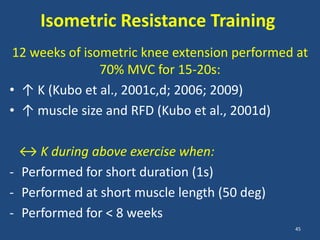
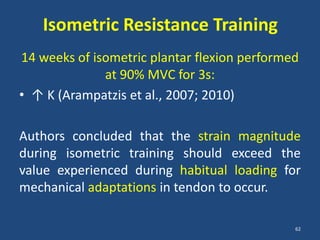


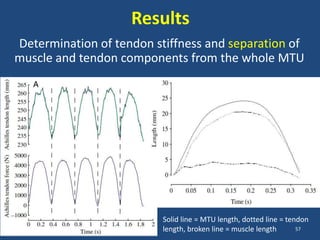


The document covers the mechanical concepts related to tendon mechanics, including strain, stress, and the rheological properties of materials. It discusses the influence of tendon mechanical properties on muscle function, including their effects on force-velocity and length-tension relationships. Finally, it outlines the impact of training, stretching, and in vivo measurement techniques on tendon properties.


