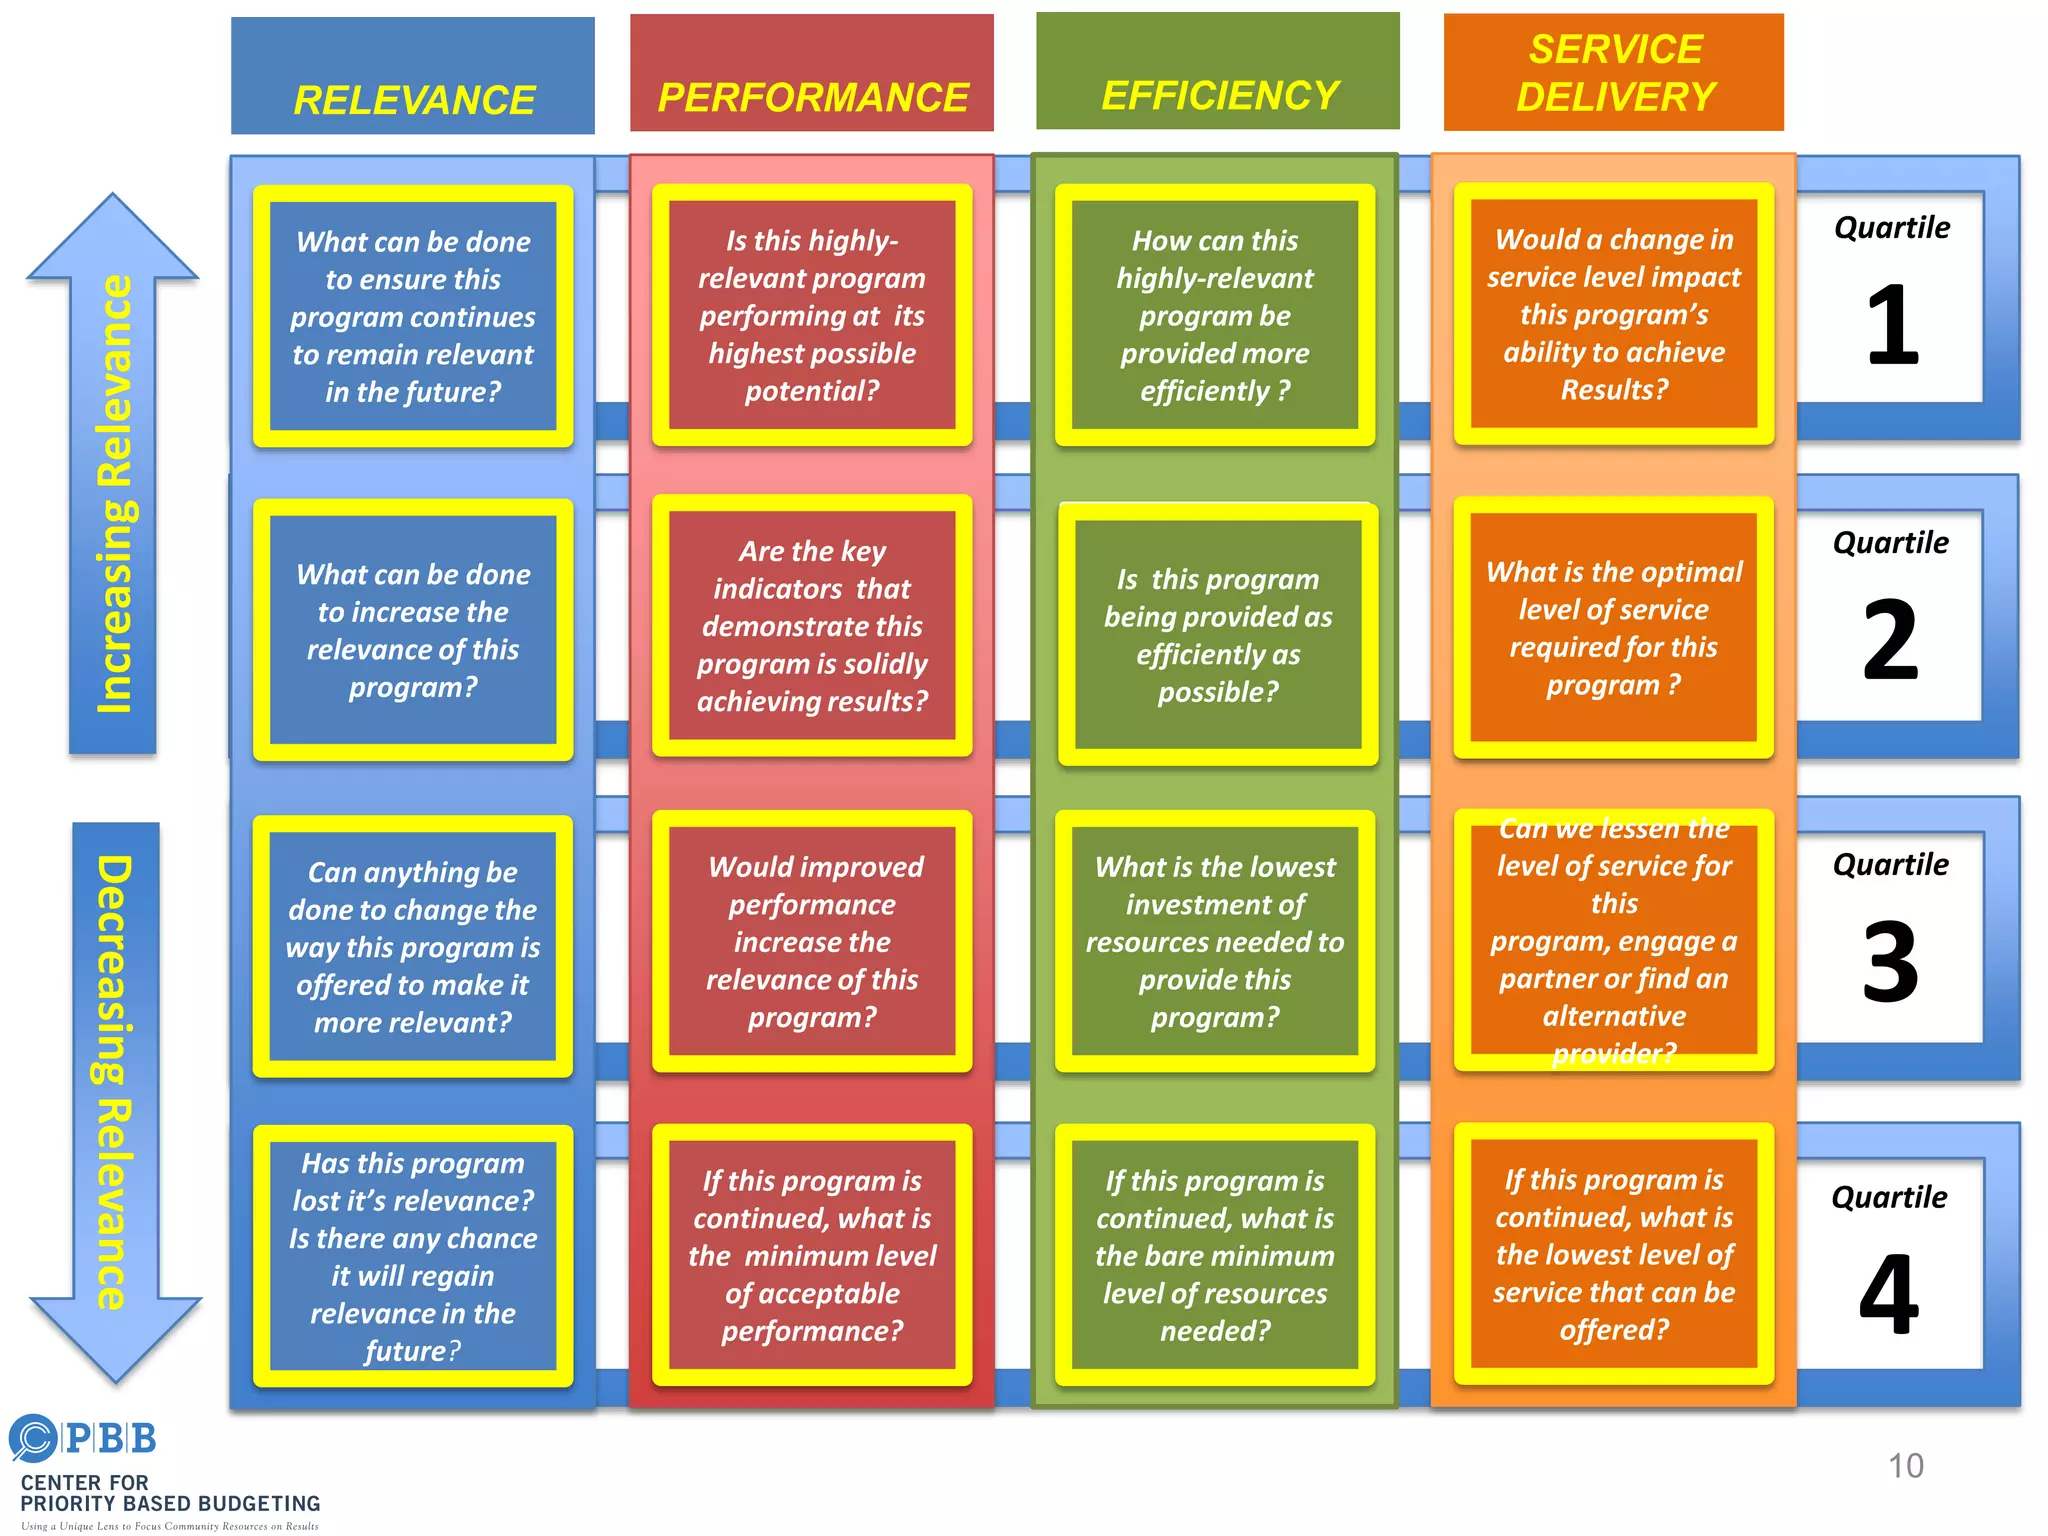
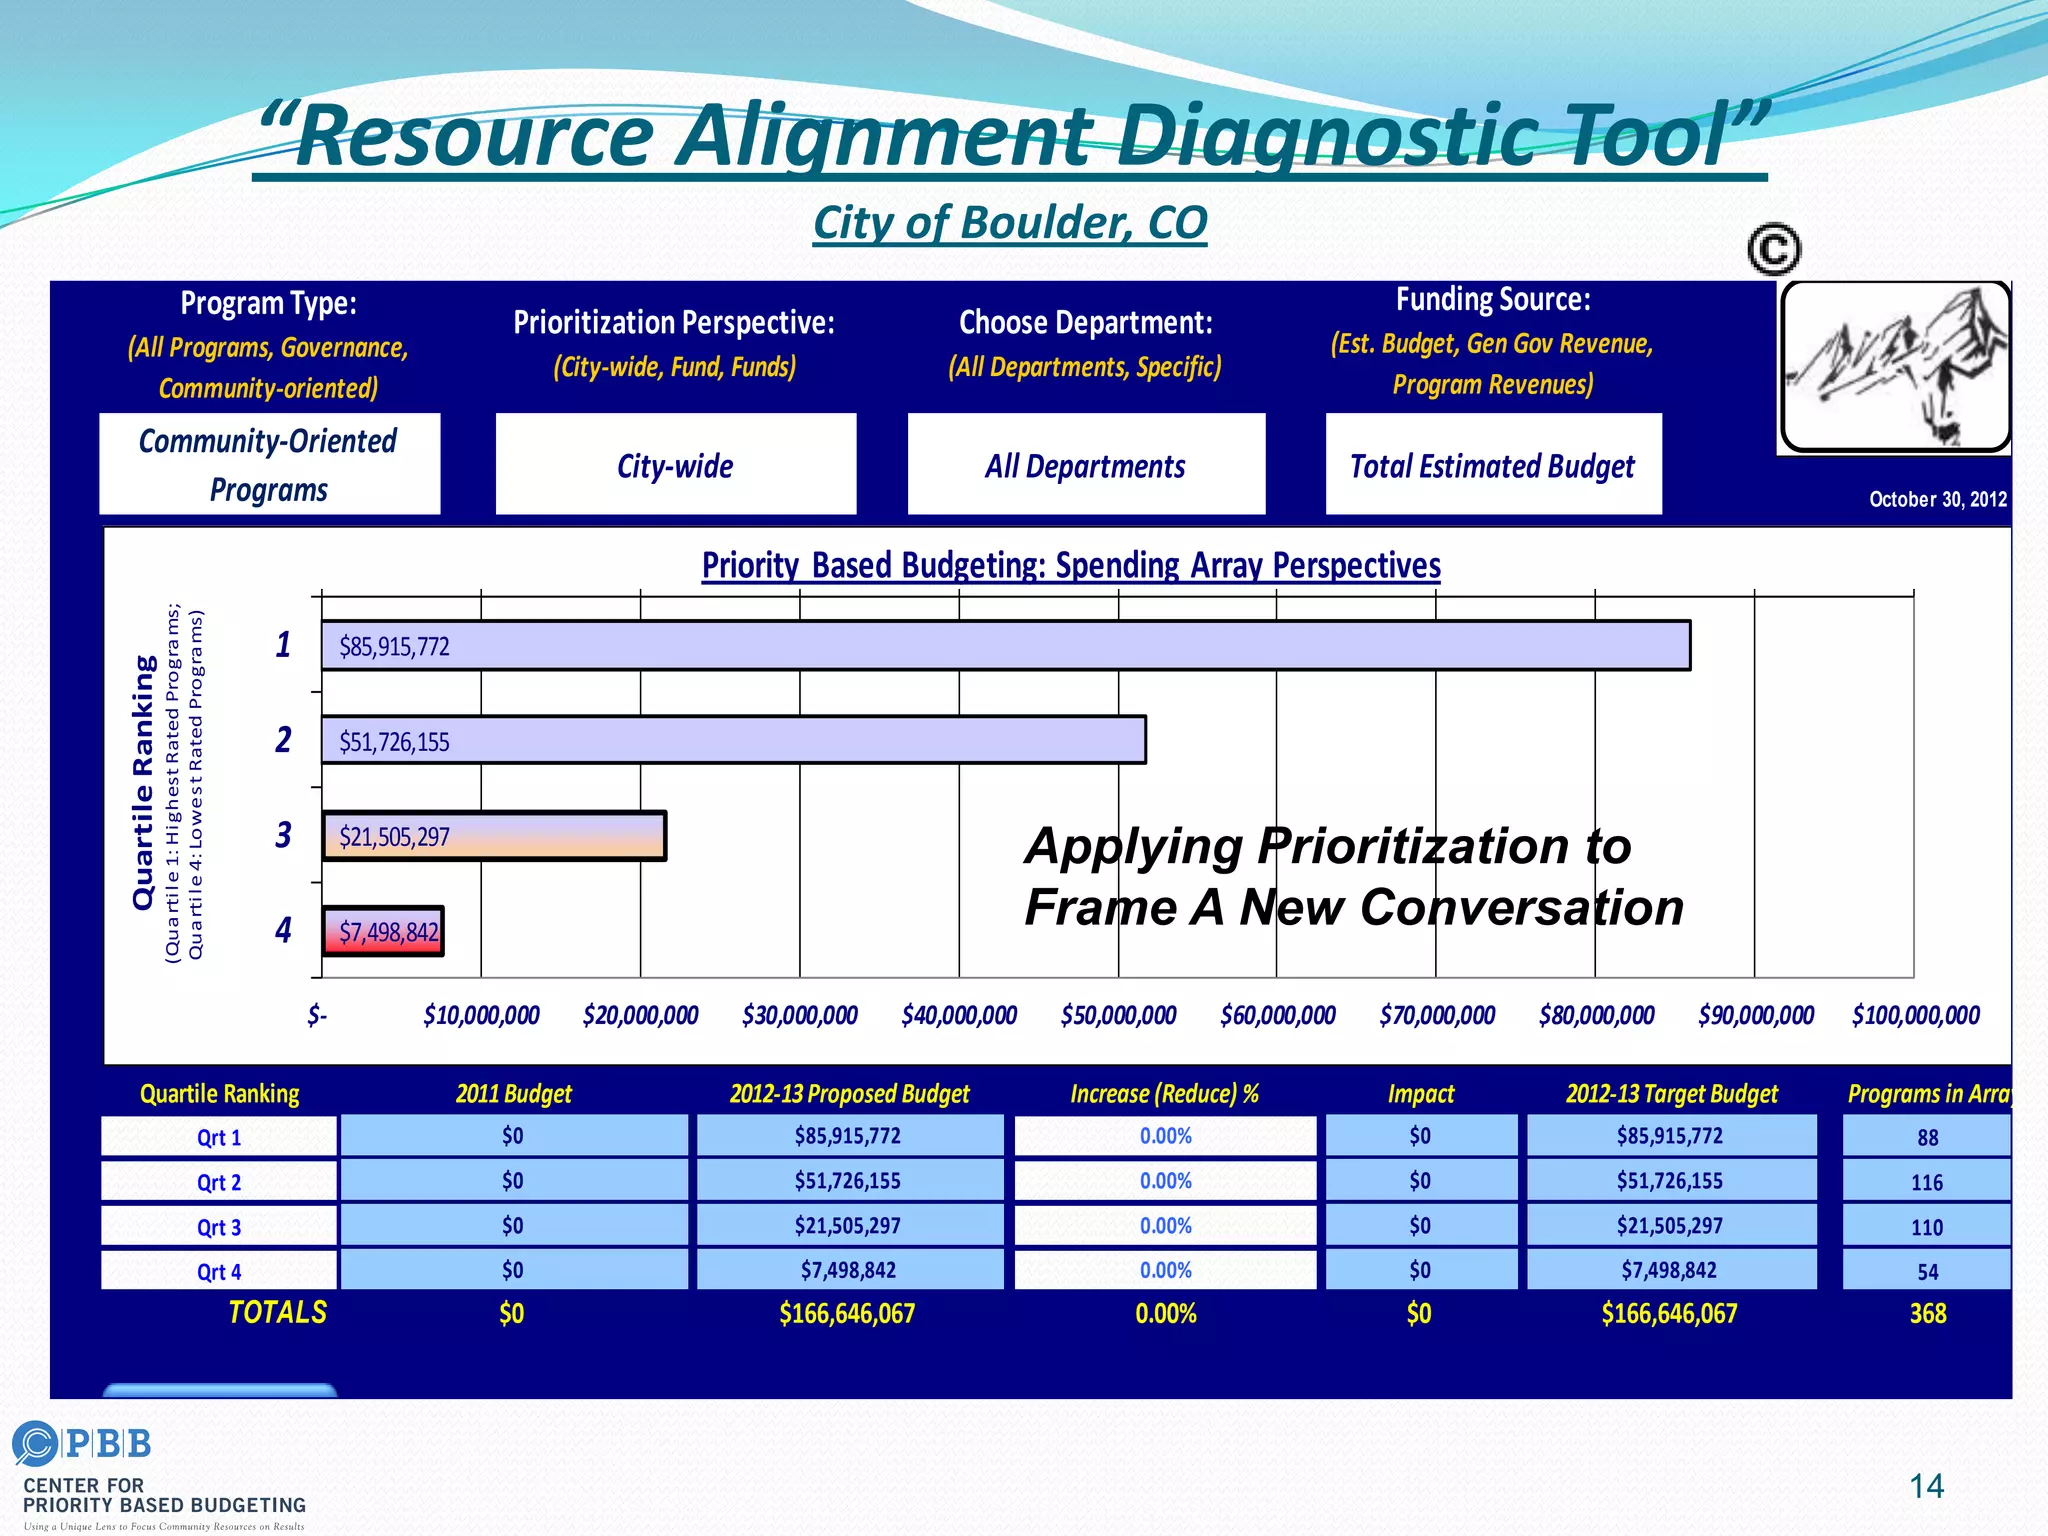
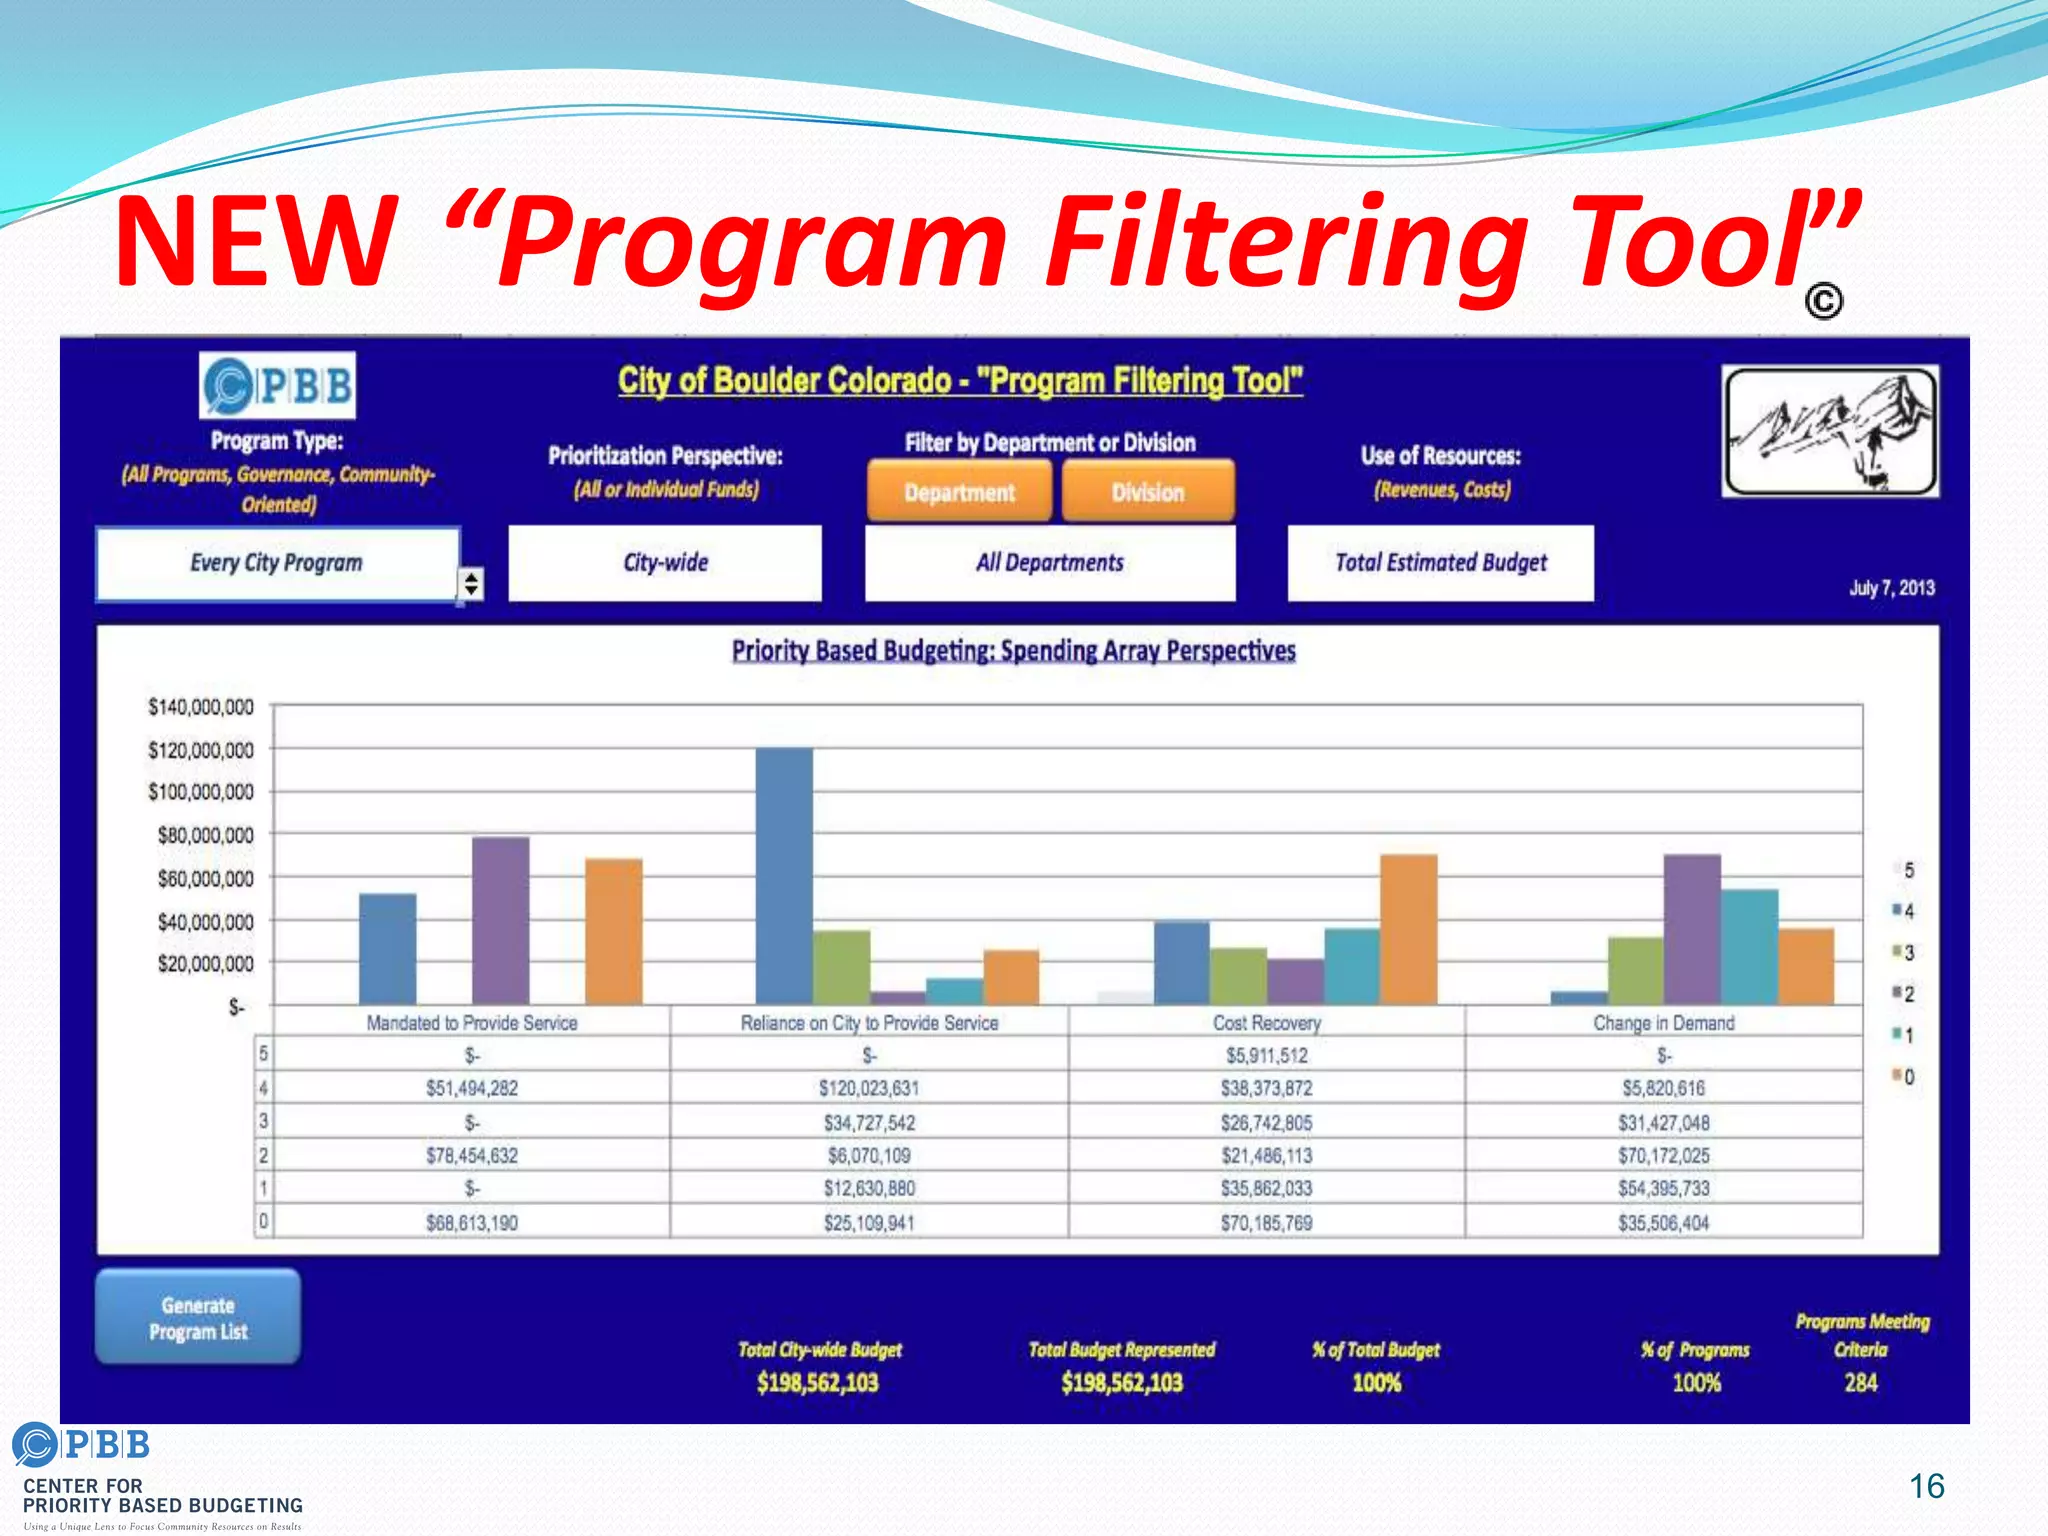
Jon Johnson & Chris Fabian
July 9, 2013
Center for Priority Based Budgeting
2013 ANNUAL CONFERENCE
“A SUMMIT of LEADING PRACTICES”
1
2
BRINGING VISION INTO FOCUS
WITH A NEW “LENS”
3
4
Fiscal
Wellness
Achieve
Fiscal Health
Value Programs
Based on Evidence
of their Influence
on Results
Support Resource
Allocation Decision
Making with Prioritization
of Programs
Identify, Define and
Value the Results
of Government
Identify Programs
and Services
ACHIEVING LONG-TERM FISCAL WELLNESS
Identify and Define Results
5
Stewardship of the
Environment
Encourages energy
conservation and
efficiency through
education, incentives and
the provision of alternative
solutions
Provides for the
renewal of the
environment through
recycling and reuse
Manages and mitigates factors
that impact environmental
quality and sustainability
Promotes and regulates
a clean, orderly and
ecologically balanced
community
Controls and abates
threats to the
environment caused by
nature
Strategic Questions
1. What are we in “business” to do?
2. What exactly do we do?
3. How do we figure out what is “core” OR What is of
the highest importance?
4. How do we know we are successful?
5. How do we ask “better” questions that
lead to “better” decisions about “what we
do” and “why we do it”?
6
PRIORITY BASED BUDGETING -
(A “GIS” Approach to the Budget)
Example of an “information
system” we’re already
familiar with: GIS
 Far better understanding
of the budget when we
can aggregate &
disaggregate information
7
PBB as “BIG DATA”?
What is the promise of Big Data?
 Different systems store data in different formats, even within the same
organization, making it difficult to aggregate data for
analysis
 As a result, an organization’s investment in data, one of
its most highly valued assets, goes underutilized
 Increased awareness of the value gained by analyzing data in context
drives desire for the ability to discover patterns and relationships to
enable improved decision making for better
outcomes
8
Gartner Press Release, “Gartner Says Solving ‘Big Data’ Challenge
Involves More Than Just Managing Volumes of Data”, June 27, 2011.
PBB – RELEVANCE FIRST!
9
• Relevance is the
foundational assumption
of Priority Based
Budgeting
• Program relevance is the
“base layer” of
information on which to
base your discussions
• All other conversations
are much more powerful
within the context of
whether a program is
relevant or not
IncreasingRelevance
What can be done
to ensure this
program continues
to remain relevant
in the future?
What can be done
to increase the
relevance of this
program?
Has this program
lost it’s relevance?
Is there any chance
it will regain
relevance in the
future?
Is this highly-
relevant program
performing at its
highest possible
potential?
Are the key
indicators that
demonstrate this
program is solidly
achieving results?
Would improved
performance
increase the
relevance of this
program?
If this program is
continued, what is
the minimum level
of acceptable
performance?
How can this
highly-relevant
program be
provided more
efficiently ?
What is the lowest
investment of
resources needed to
provide this
program?
If this program is
continued, what is
the bare minimum
level of resources
needed?
Would a change in
service level impact
this program’s
ability to achieve
Results?
Can we lessen the
level of service for
this
program, engage a
partner or find an
alternative
provider?
If this program is
continued, what is
the lowest level of
service that can be
offered?
Quartile
1
Quartile
2
Quartile
3
Quartile
4
DecreasingRelevance
Can anything be
done to change the
way this program is
offered to make it
more relevant?
10
EFFICIENCY
SERVICE
DELIVERYPERFORMANCERELEVANCE
Is this program
being provided as
efficiently as
possible?
What is the optimal
level of service
required for this
program ?
New Layers – New Perspectives
• Workforce Data
• Vacant Positions
• Retirement Eligible
Positions
• Nearing Retirement
Eligible Positions
0.0 10.0 20.0 30.0 40.0 50.0 60.0 70.0 80.0
1
4
7
10
13
16
19
22
25
28
31
34
37
40
43
46
49
52
55
58
61
64
67
70
73
76
79
82
85
88
91
94
97
100
103
Total Score for Community Oriented Programs
TotalNumberofPrograms
Quartile 1
Quartile 2
Quartile 3
Quartile 4
Quartile 1:
79 Programs
Quartile 2:
103 Programs
Quartile 3:
103 Programs
Quartile 4:
58 Programs
City of Boulder, Colorado
Defining Quartile Groupings
Key:
Programs are grouped into
Quartiles (not ranked, one
versus the other)
12
$85,915,772
$51,726,155
$21,505,297
$7,498,842
$- $10,000,000 $20,000,000 $30,000,000 $40,000,000 $50,000,000 $60,000,000 $70,000,000 $80,000,000 $90,000,000 $100,000,000
1
2
3
4
QuartileRanking
(Quartile1:HighestRatedPrograms;
Quartile4:LowestRatedPrograms)
Prioritization Array:Combined City-wide Programs
Step 5: Allocate Resources Based on Prioritization
13
79 Programs
103 Programs
103Programs
58 Programs
City of Boulder, Colorado
14
“Resource Alignment Diagnostic Tool”
City of Boulder, CO
Quartile Ranking Programs in Array
Qrt 1 88
Qrt 2 116
Qrt 3 1102-10%
Qrt 4 54
TOTALS 368
October 30, 2012
Community-Oriented
Programs
All Departments
Funding Source:
(Est. Budget, Gen Gov Revenue,
Program Revenues)
Total Estimated BudgetCity-wide
Prioritization Perspective:
(City-wide, Fund, Funds)
Choose Department:
(All Departments, Specific)
ProgramType:
(All Programs, Governance,
Community-oriented)
$00.00%
0.00%
$0
$0
$85,915,772
$21,505,297
$51,726,155
0.00%
$0
$0
$0 $85,915,772
$51,726,155 0.00%
$0 $166,646,067 0.00% $0 $166,646,067
2012-13Proposed Budget Increase(Reduce) % Impact 2012-13TargetBudget
$0
$0
2011Budget
$7,498,842
$21,505,297
$7,498,842
$85,915,772
$51,726,155
$21,505,297
$7,498,842
$- $10,000,000 $20,000,000 $30,000,000 $40,000,000 $50,000,000 $60,000,000 $70,000,000 $80,000,000 $90,000,000 $100,000,000
1
2
3
4
QuartileRanking
(Quartile1:HighestRatedPrograms;
Quartile4:LowestRatedPrograms)
Priority Based Budgeting: Spending Array Perspectives
Applying Prioritization to
Frame A New Conversation
15
NEW “Program Filtering Tool”
16
Role of the Council/Board
 Engage in the discussions by looking through this “new lens.”
 Be guided to ask the “right” questions – focused on POLICY rather
than OPERATIONS.
 Allocated resources based on priorities of the community
 Make better decisions that you can easily communicate to your
citizens.
Role of the Citizens
 See through the “new lens” how decision-makers are more
objectively allocating resources to achieve the community’s
priorities
 Better understand the budget “choices” that need to be made and
the impacts of those choices on the community
17
Thank You !
Jon Johnson, Co-Founder Chris Fabian, Co-Founder
303-756-9090, ext. 326 303-756-9090, ext. 325
303-909-9052 (cell) 303-520-1356 (cell)
jjohnson@pbbcenter.org cfabian@pbbcenter.org
www.pbbcenter.org
Copyright ©2009 by Chris Fabian and Jon Johnson d/b/a the Center for Priority Based Budgeting,
Denver, Colorado.
18

Technology & Tools of Priority Based Budgeting - 2013 conference

  • 1.
    Jon Johnson &Chris Fabian July 9, 2013 Center for Priority Based Budgeting 2013 ANNUAL CONFERENCE “A SUMMIT of LEADING PRACTICES” 1
  • 2.
  • 3.
    BRINGING VISION INTOFOCUS WITH A NEW “LENS” 3
  • 4.
    4 Fiscal Wellness Achieve Fiscal Health Value Programs Basedon Evidence of their Influence on Results Support Resource Allocation Decision Making with Prioritization of Programs Identify, Define and Value the Results of Government Identify Programs and Services ACHIEVING LONG-TERM FISCAL WELLNESS
  • 5.
    Identify and DefineResults 5 Stewardship of the Environment Encourages energy conservation and efficiency through education, incentives and the provision of alternative solutions Provides for the renewal of the environment through recycling and reuse Manages and mitigates factors that impact environmental quality and sustainability Promotes and regulates a clean, orderly and ecologically balanced community Controls and abates threats to the environment caused by nature
  • 6.
    Strategic Questions 1. Whatare we in “business” to do? 2. What exactly do we do? 3. How do we figure out what is “core” OR What is of the highest importance? 4. How do we know we are successful? 5. How do we ask “better” questions that lead to “better” decisions about “what we do” and “why we do it”? 6
  • 7.
    PRIORITY BASED BUDGETING- (A “GIS” Approach to the Budget) Example of an “information system” we’re already familiar with: GIS  Far better understanding of the budget when we can aggregate & disaggregate information 7
  • 8.
    PBB as “BIGDATA”? What is the promise of Big Data?  Different systems store data in different formats, even within the same organization, making it difficult to aggregate data for analysis  As a result, an organization’s investment in data, one of its most highly valued assets, goes underutilized  Increased awareness of the value gained by analyzing data in context drives desire for the ability to discover patterns and relationships to enable improved decision making for better outcomes 8 Gartner Press Release, “Gartner Says Solving ‘Big Data’ Challenge Involves More Than Just Managing Volumes of Data”, June 27, 2011.
  • 9.
    PBB – RELEVANCEFIRST! 9 • Relevance is the foundational assumption of Priority Based Budgeting • Program relevance is the “base layer” of information on which to base your discussions • All other conversations are much more powerful within the context of whether a program is relevant or not
  • 10.
    IncreasingRelevance What can bedone to ensure this program continues to remain relevant in the future? What can be done to increase the relevance of this program? Has this program lost it’s relevance? Is there any chance it will regain relevance in the future? Is this highly- relevant program performing at its highest possible potential? Are the key indicators that demonstrate this program is solidly achieving results? Would improved performance increase the relevance of this program? If this program is continued, what is the minimum level of acceptable performance? How can this highly-relevant program be provided more efficiently ? What is the lowest investment of resources needed to provide this program? If this program is continued, what is the bare minimum level of resources needed? Would a change in service level impact this program’s ability to achieve Results? Can we lessen the level of service for this program, engage a partner or find an alternative provider? If this program is continued, what is the lowest level of service that can be offered? Quartile 1 Quartile 2 Quartile 3 Quartile 4 DecreasingRelevance Can anything be done to change the way this program is offered to make it more relevant? 10 EFFICIENCY SERVICE DELIVERYPERFORMANCERELEVANCE Is this program being provided as efficiently as possible? What is the optimal level of service required for this program ?
  • 11.
    New Layers –New Perspectives • Workforce Data • Vacant Positions • Retirement Eligible Positions • Nearing Retirement Eligible Positions
  • 12.
    0.0 10.0 20.030.0 40.0 50.0 60.0 70.0 80.0 1 4 7 10 13 16 19 22 25 28 31 34 37 40 43 46 49 52 55 58 61 64 67 70 73 76 79 82 85 88 91 94 97 100 103 Total Score for Community Oriented Programs TotalNumberofPrograms Quartile 1 Quartile 2 Quartile 3 Quartile 4 Quartile 1: 79 Programs Quartile 2: 103 Programs Quartile 3: 103 Programs Quartile 4: 58 Programs City of Boulder, Colorado Defining Quartile Groupings Key: Programs are grouped into Quartiles (not ranked, one versus the other) 12
  • 13.
    $85,915,772 $51,726,155 $21,505,297 $7,498,842 $- $10,000,000 $20,000,000$30,000,000 $40,000,000 $50,000,000 $60,000,000 $70,000,000 $80,000,000 $90,000,000 $100,000,000 1 2 3 4 QuartileRanking (Quartile1:HighestRatedPrograms; Quartile4:LowestRatedPrograms) Prioritization Array:Combined City-wide Programs Step 5: Allocate Resources Based on Prioritization 13 79 Programs 103 Programs 103Programs 58 Programs City of Boulder, Colorado
  • 14.
    14 “Resource Alignment DiagnosticTool” City of Boulder, CO Quartile Ranking Programs in Array Qrt 1 88 Qrt 2 116 Qrt 3 1102-10% Qrt 4 54 TOTALS 368 October 30, 2012 Community-Oriented Programs All Departments Funding Source: (Est. Budget, Gen Gov Revenue, Program Revenues) Total Estimated BudgetCity-wide Prioritization Perspective: (City-wide, Fund, Funds) Choose Department: (All Departments, Specific) ProgramType: (All Programs, Governance, Community-oriented) $00.00% 0.00% $0 $0 $85,915,772 $21,505,297 $51,726,155 0.00% $0 $0 $0 $85,915,772 $51,726,155 0.00% $0 $166,646,067 0.00% $0 $166,646,067 2012-13Proposed Budget Increase(Reduce) % Impact 2012-13TargetBudget $0 $0 2011Budget $7,498,842 $21,505,297 $7,498,842 $85,915,772 $51,726,155 $21,505,297 $7,498,842 $- $10,000,000 $20,000,000 $30,000,000 $40,000,000 $50,000,000 $60,000,000 $70,000,000 $80,000,000 $90,000,000 $100,000,000 1 2 3 4 QuartileRanking (Quartile1:HighestRatedPrograms; Quartile4:LowestRatedPrograms) Priority Based Budgeting: Spending Array Perspectives Applying Prioritization to Frame A New Conversation
  • 15.
  • 16.
  • 17.
    Role of theCouncil/Board  Engage in the discussions by looking through this “new lens.”  Be guided to ask the “right” questions – focused on POLICY rather than OPERATIONS.  Allocated resources based on priorities of the community  Make better decisions that you can easily communicate to your citizens. Role of the Citizens  See through the “new lens” how decision-makers are more objectively allocating resources to achieve the community’s priorities  Better understand the budget “choices” that need to be made and the impacts of those choices on the community 17
  • 18.
    Thank You ! JonJohnson, Co-Founder Chris Fabian, Co-Founder 303-756-9090, ext. 326 303-756-9090, ext. 325 303-909-9052 (cell) 303-520-1356 (cell) jjohnson@pbbcenter.org cfabian@pbbcenter.org www.pbbcenter.org Copyright ©2009 by Chris Fabian and Jon Johnson d/b/a the Center for Priority Based Budgeting, Denver, Colorado. 18