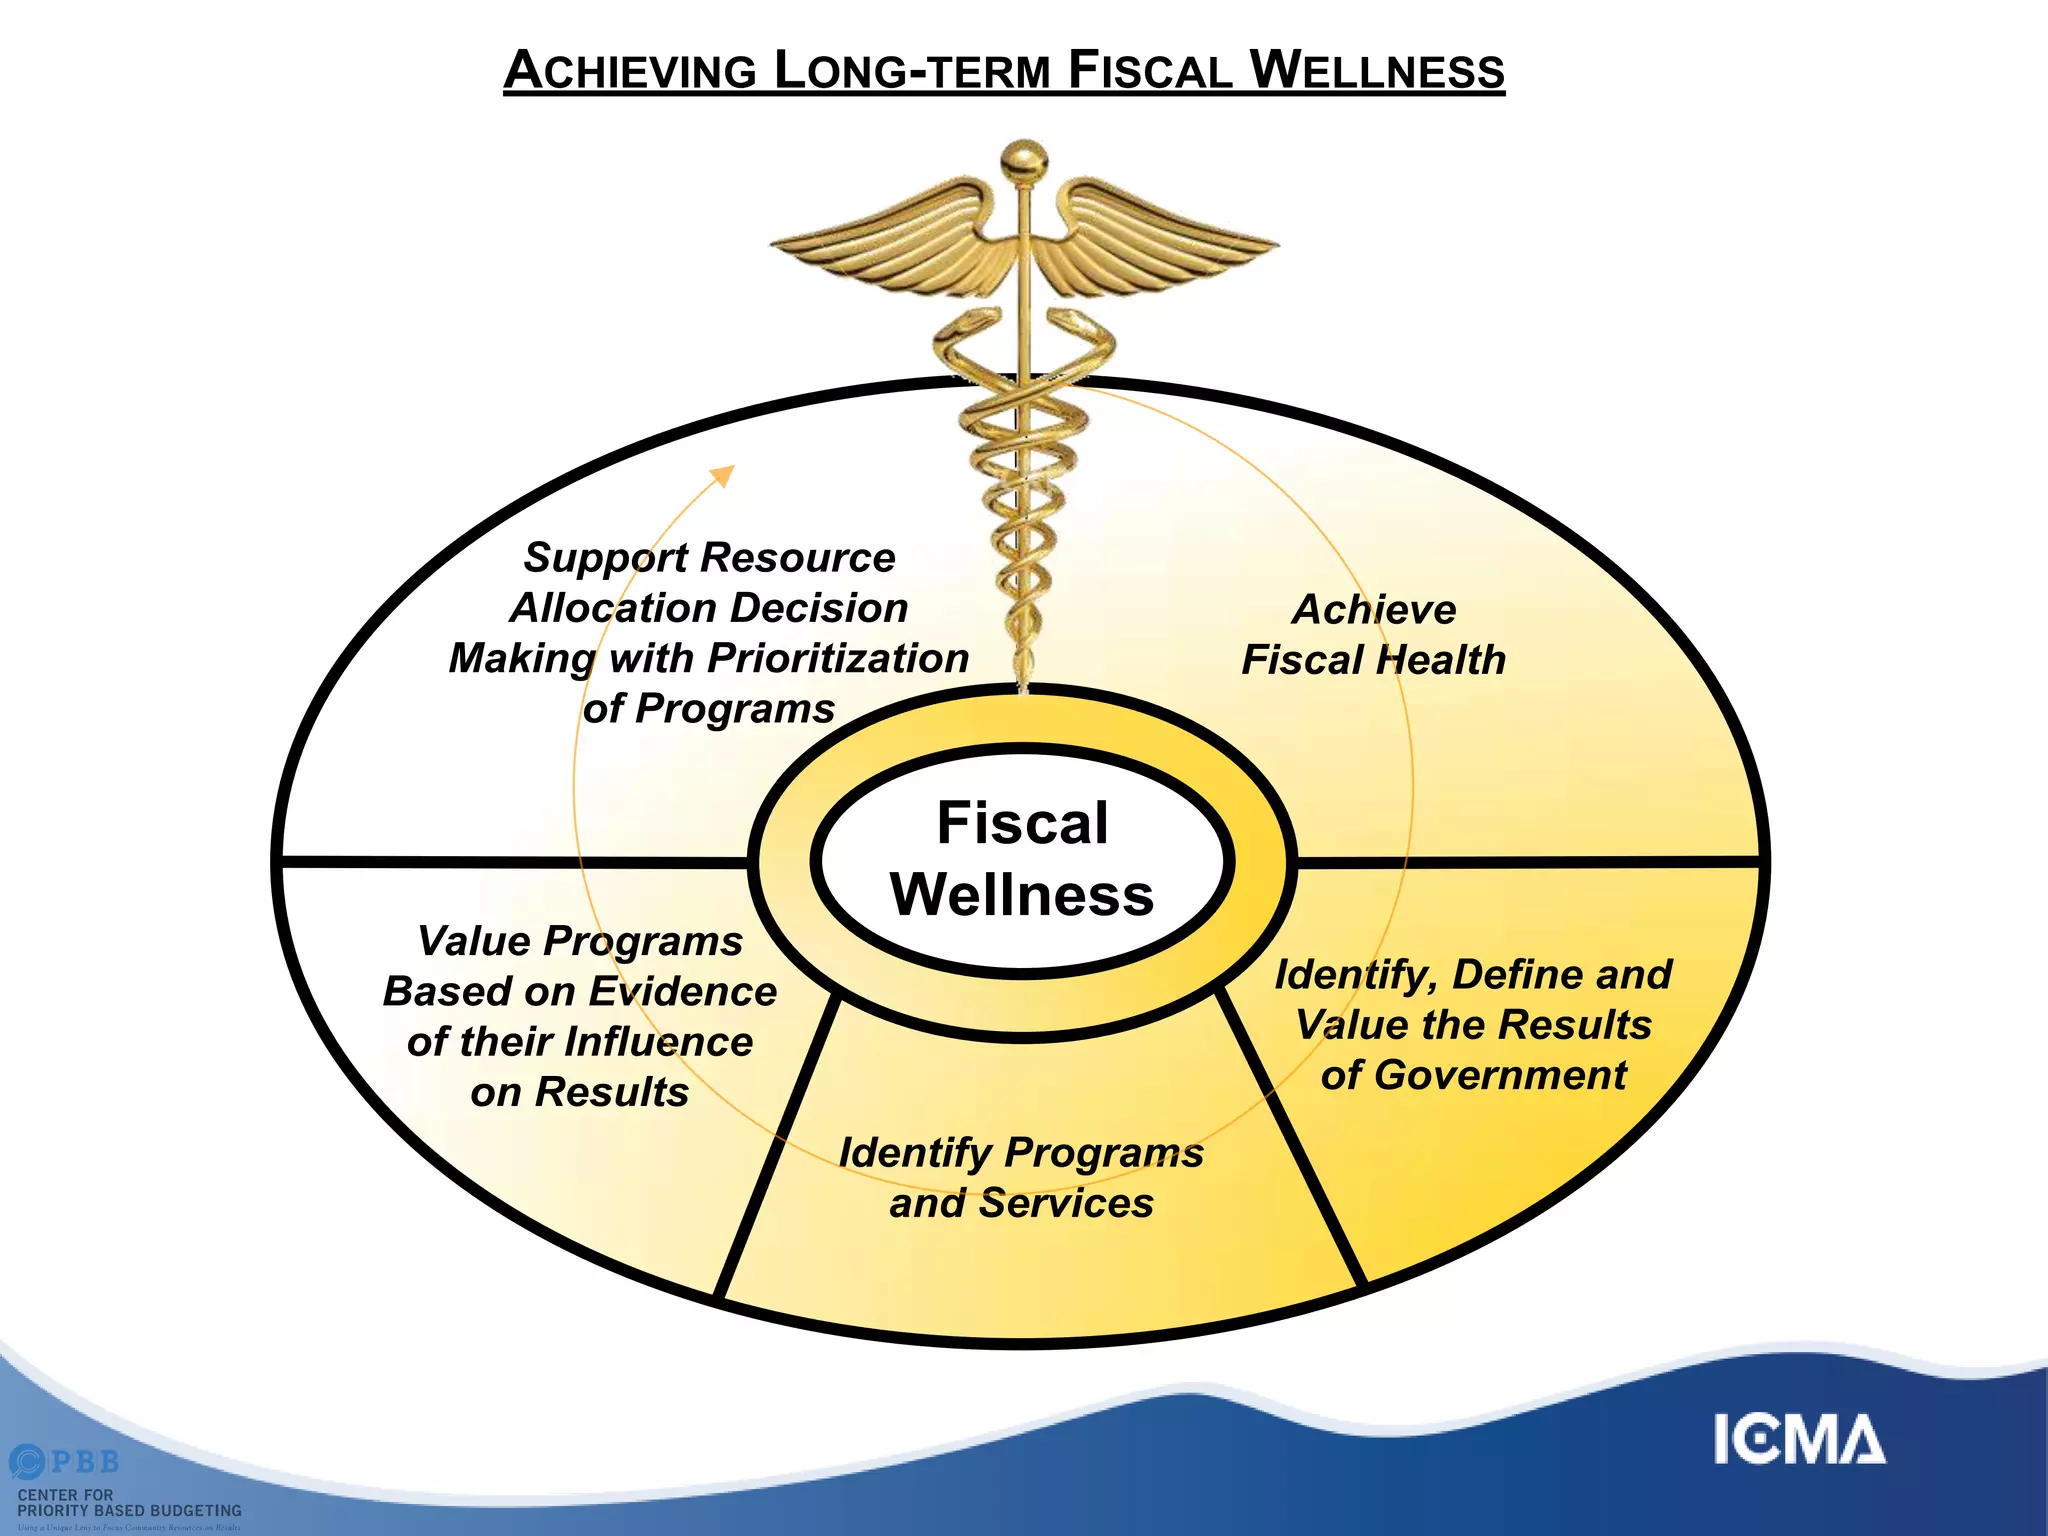
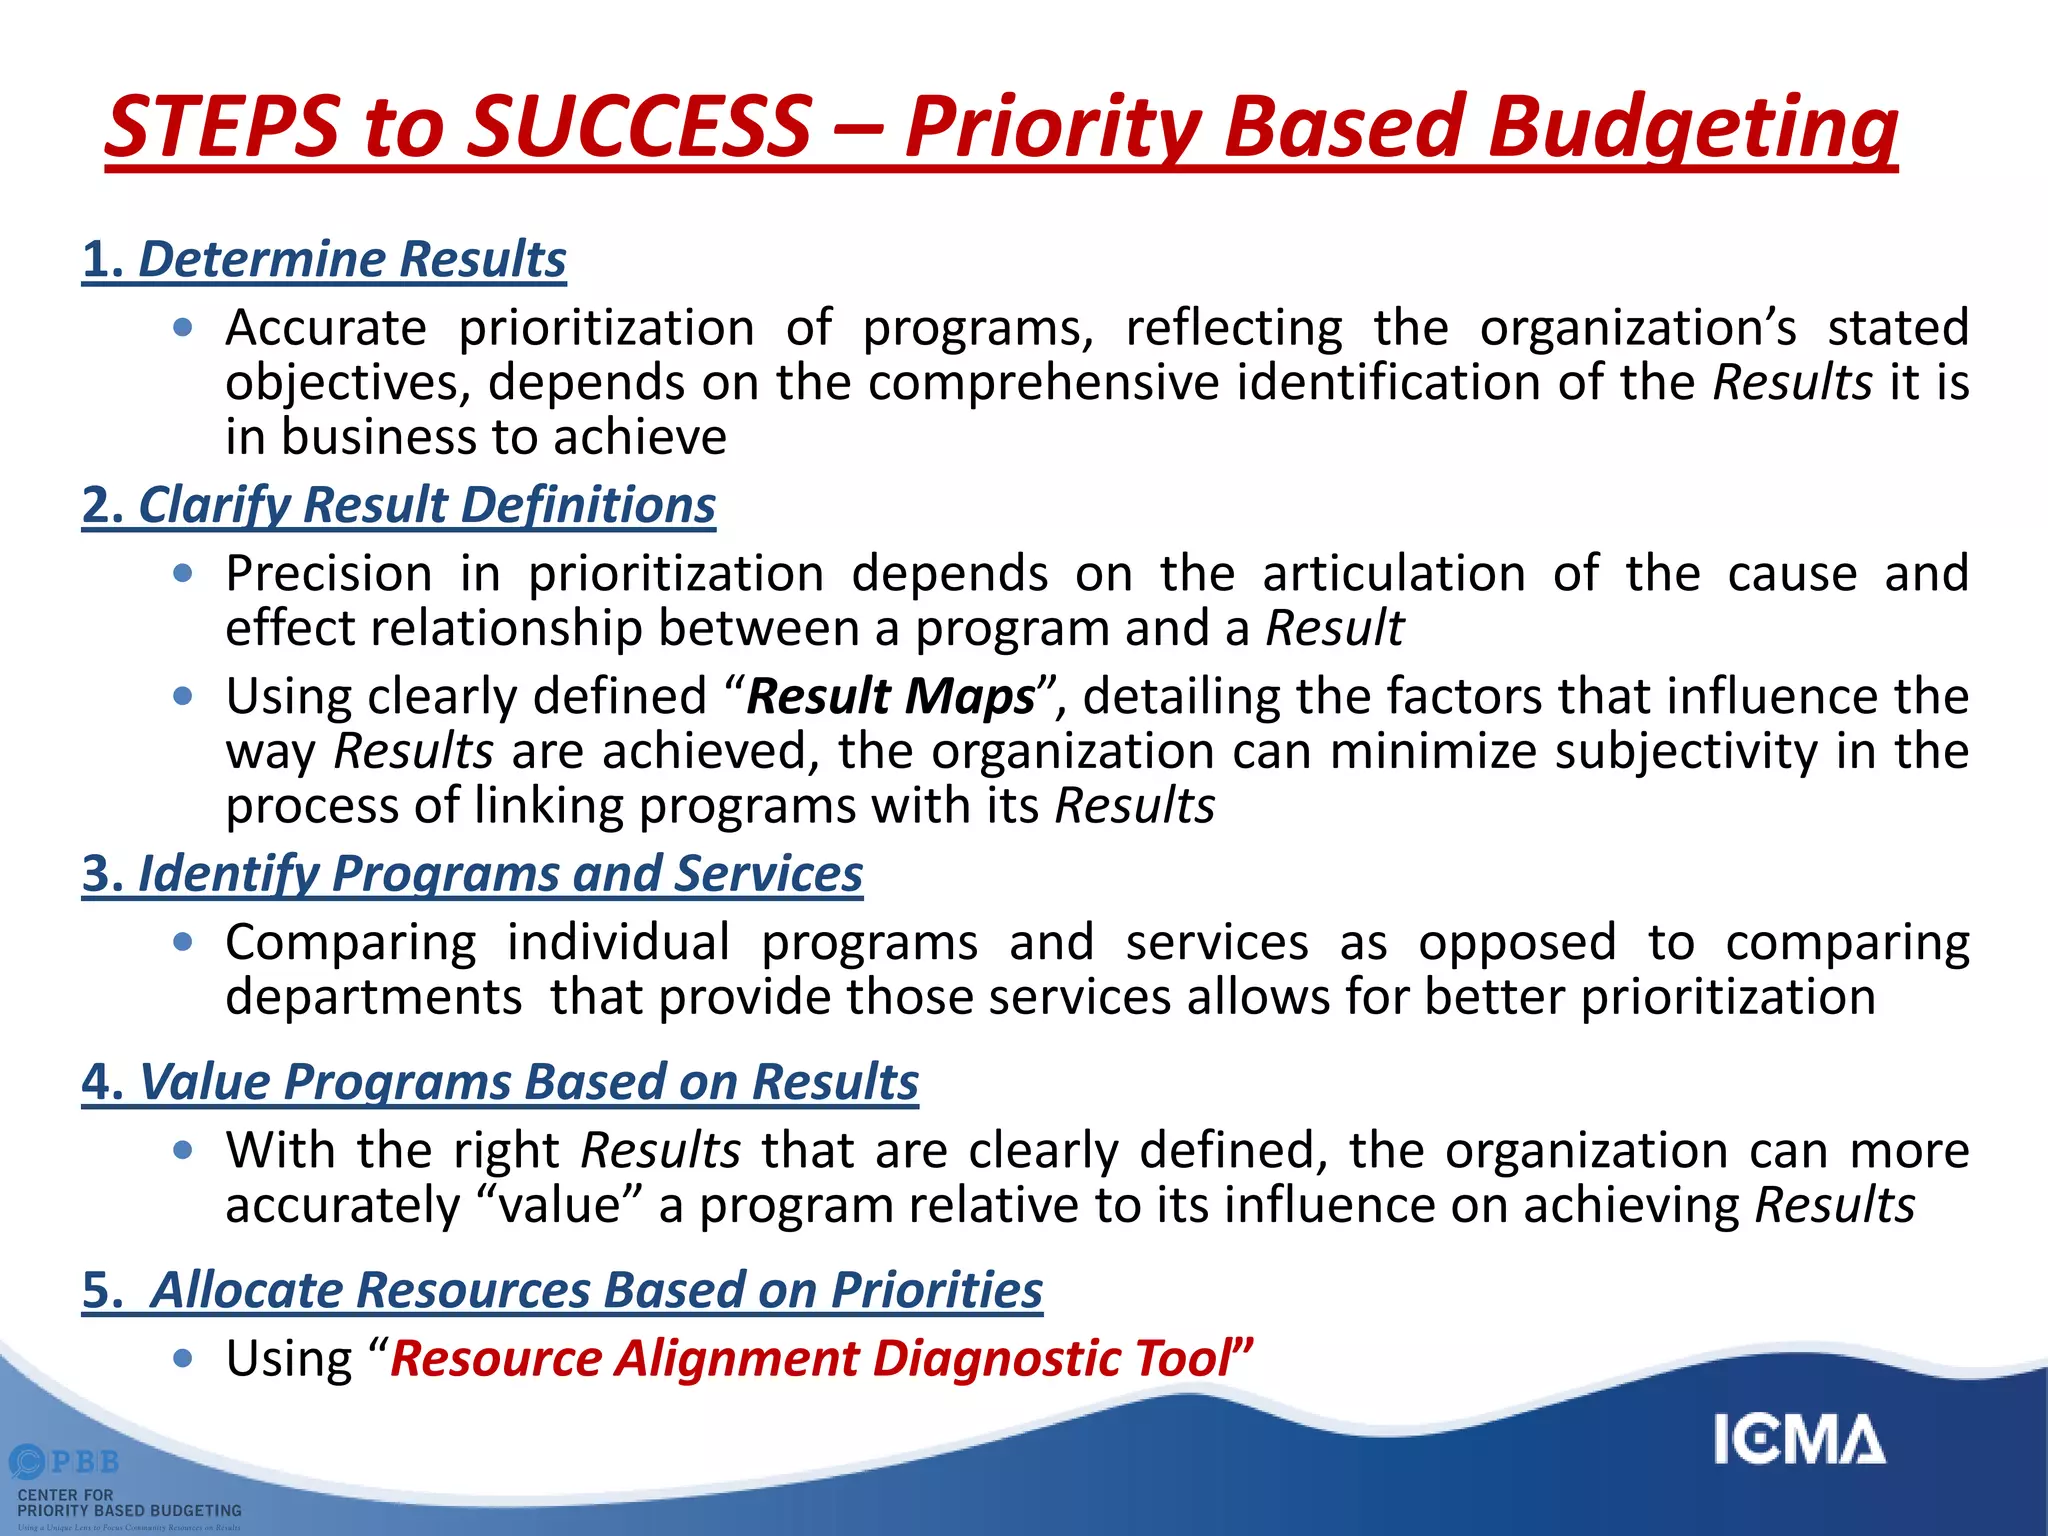
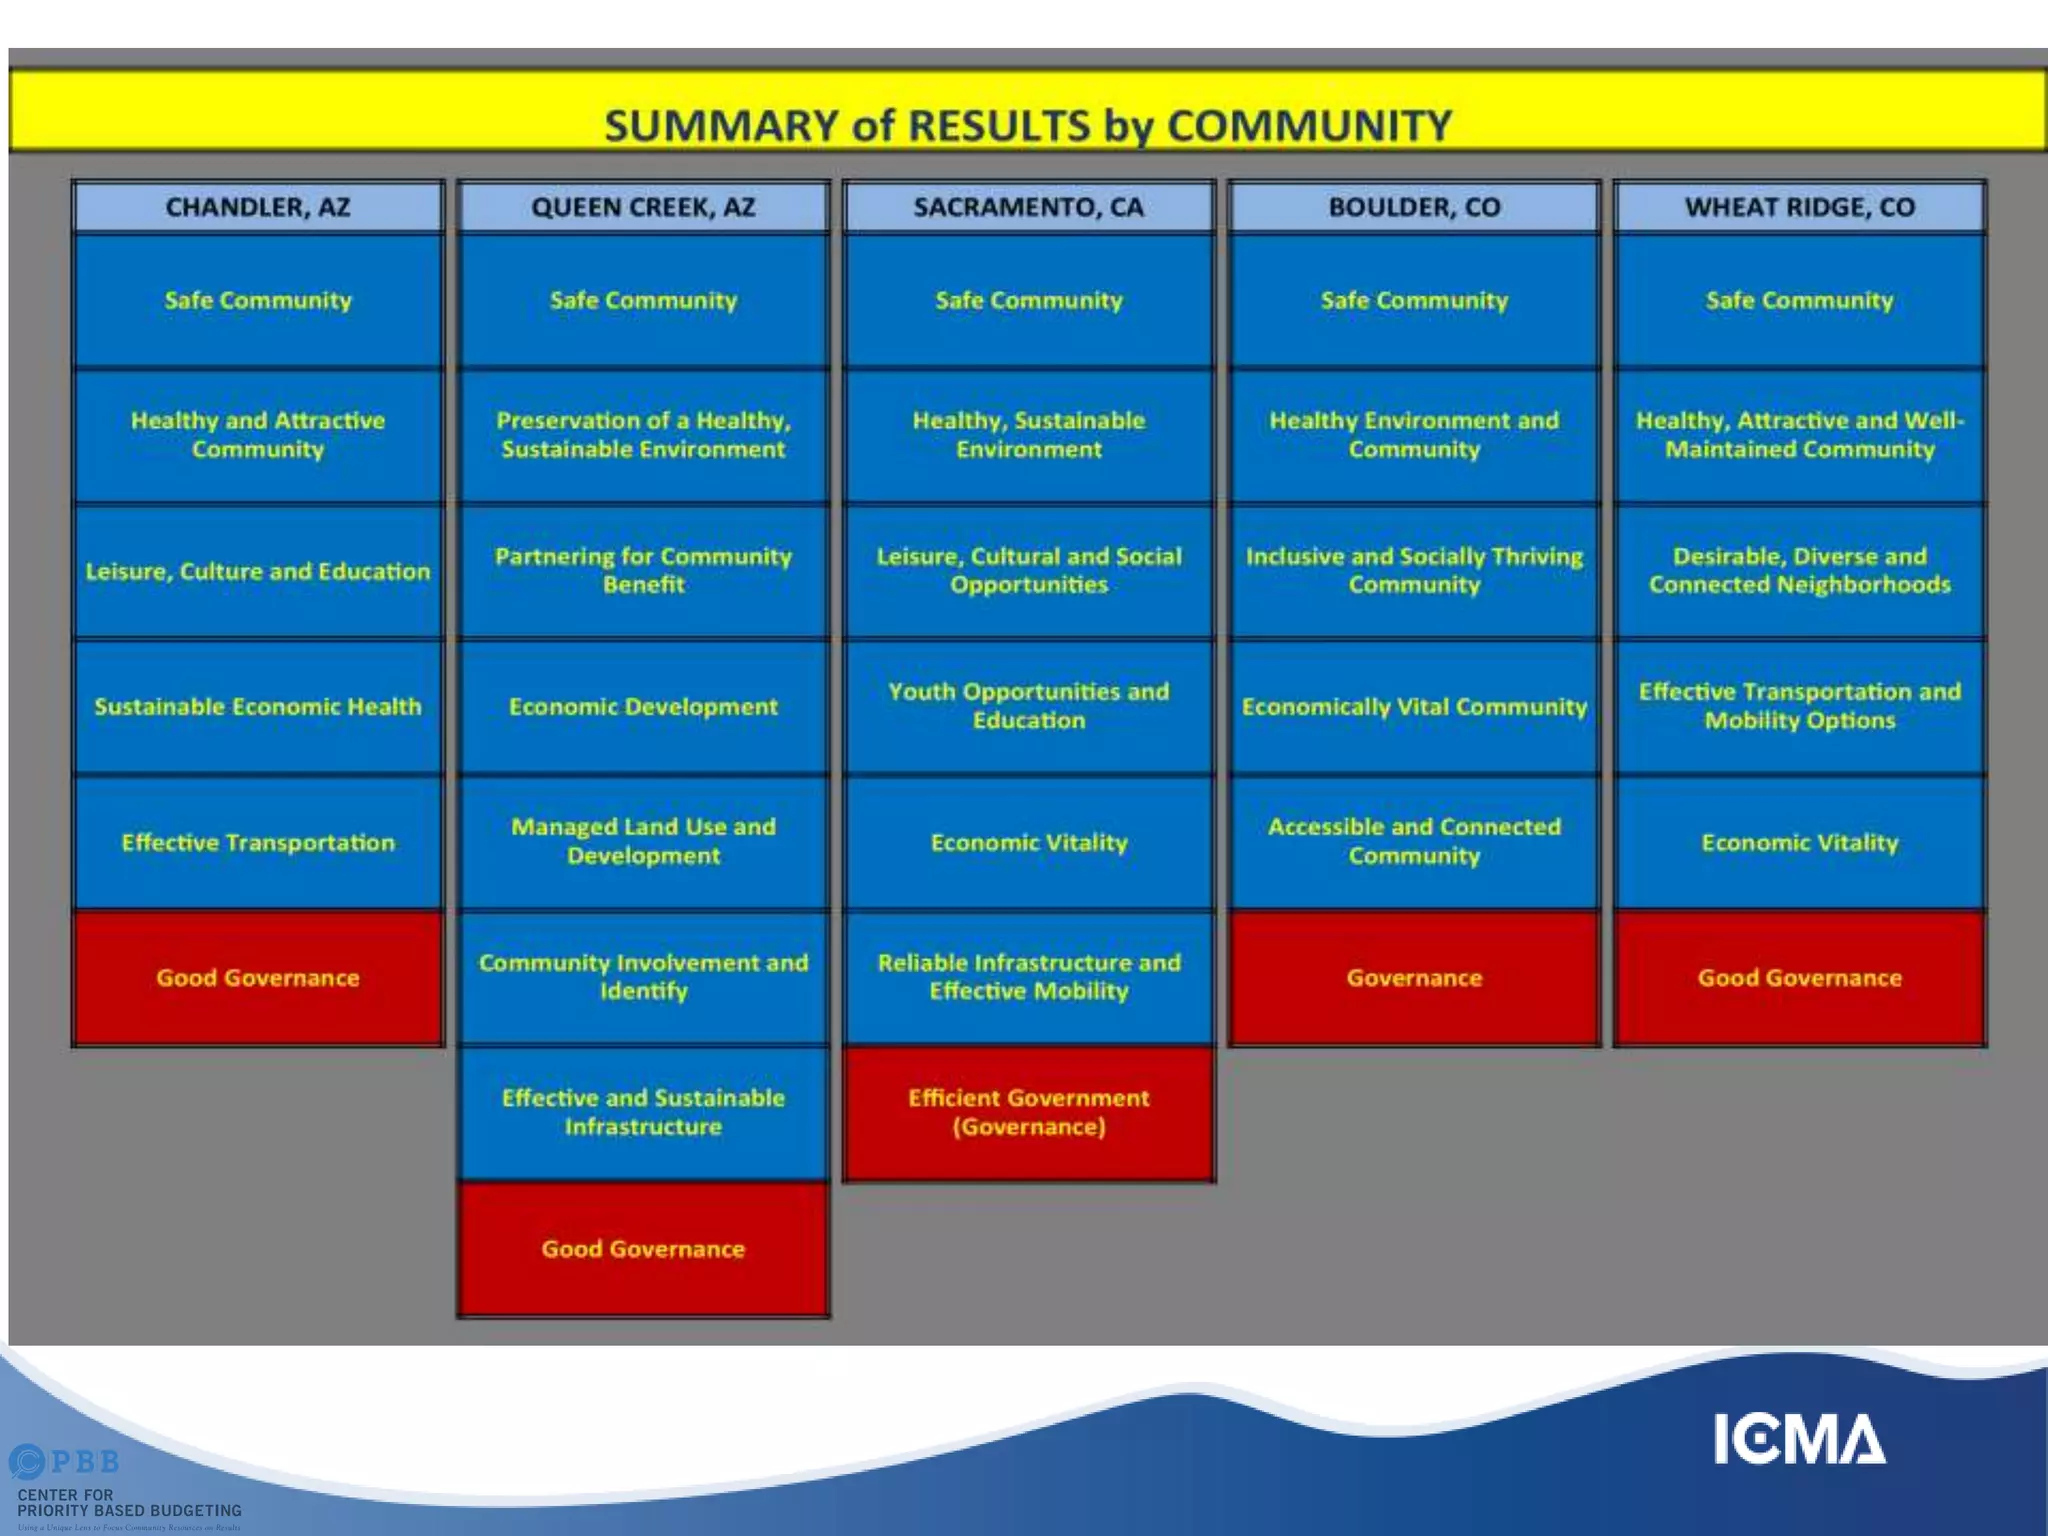
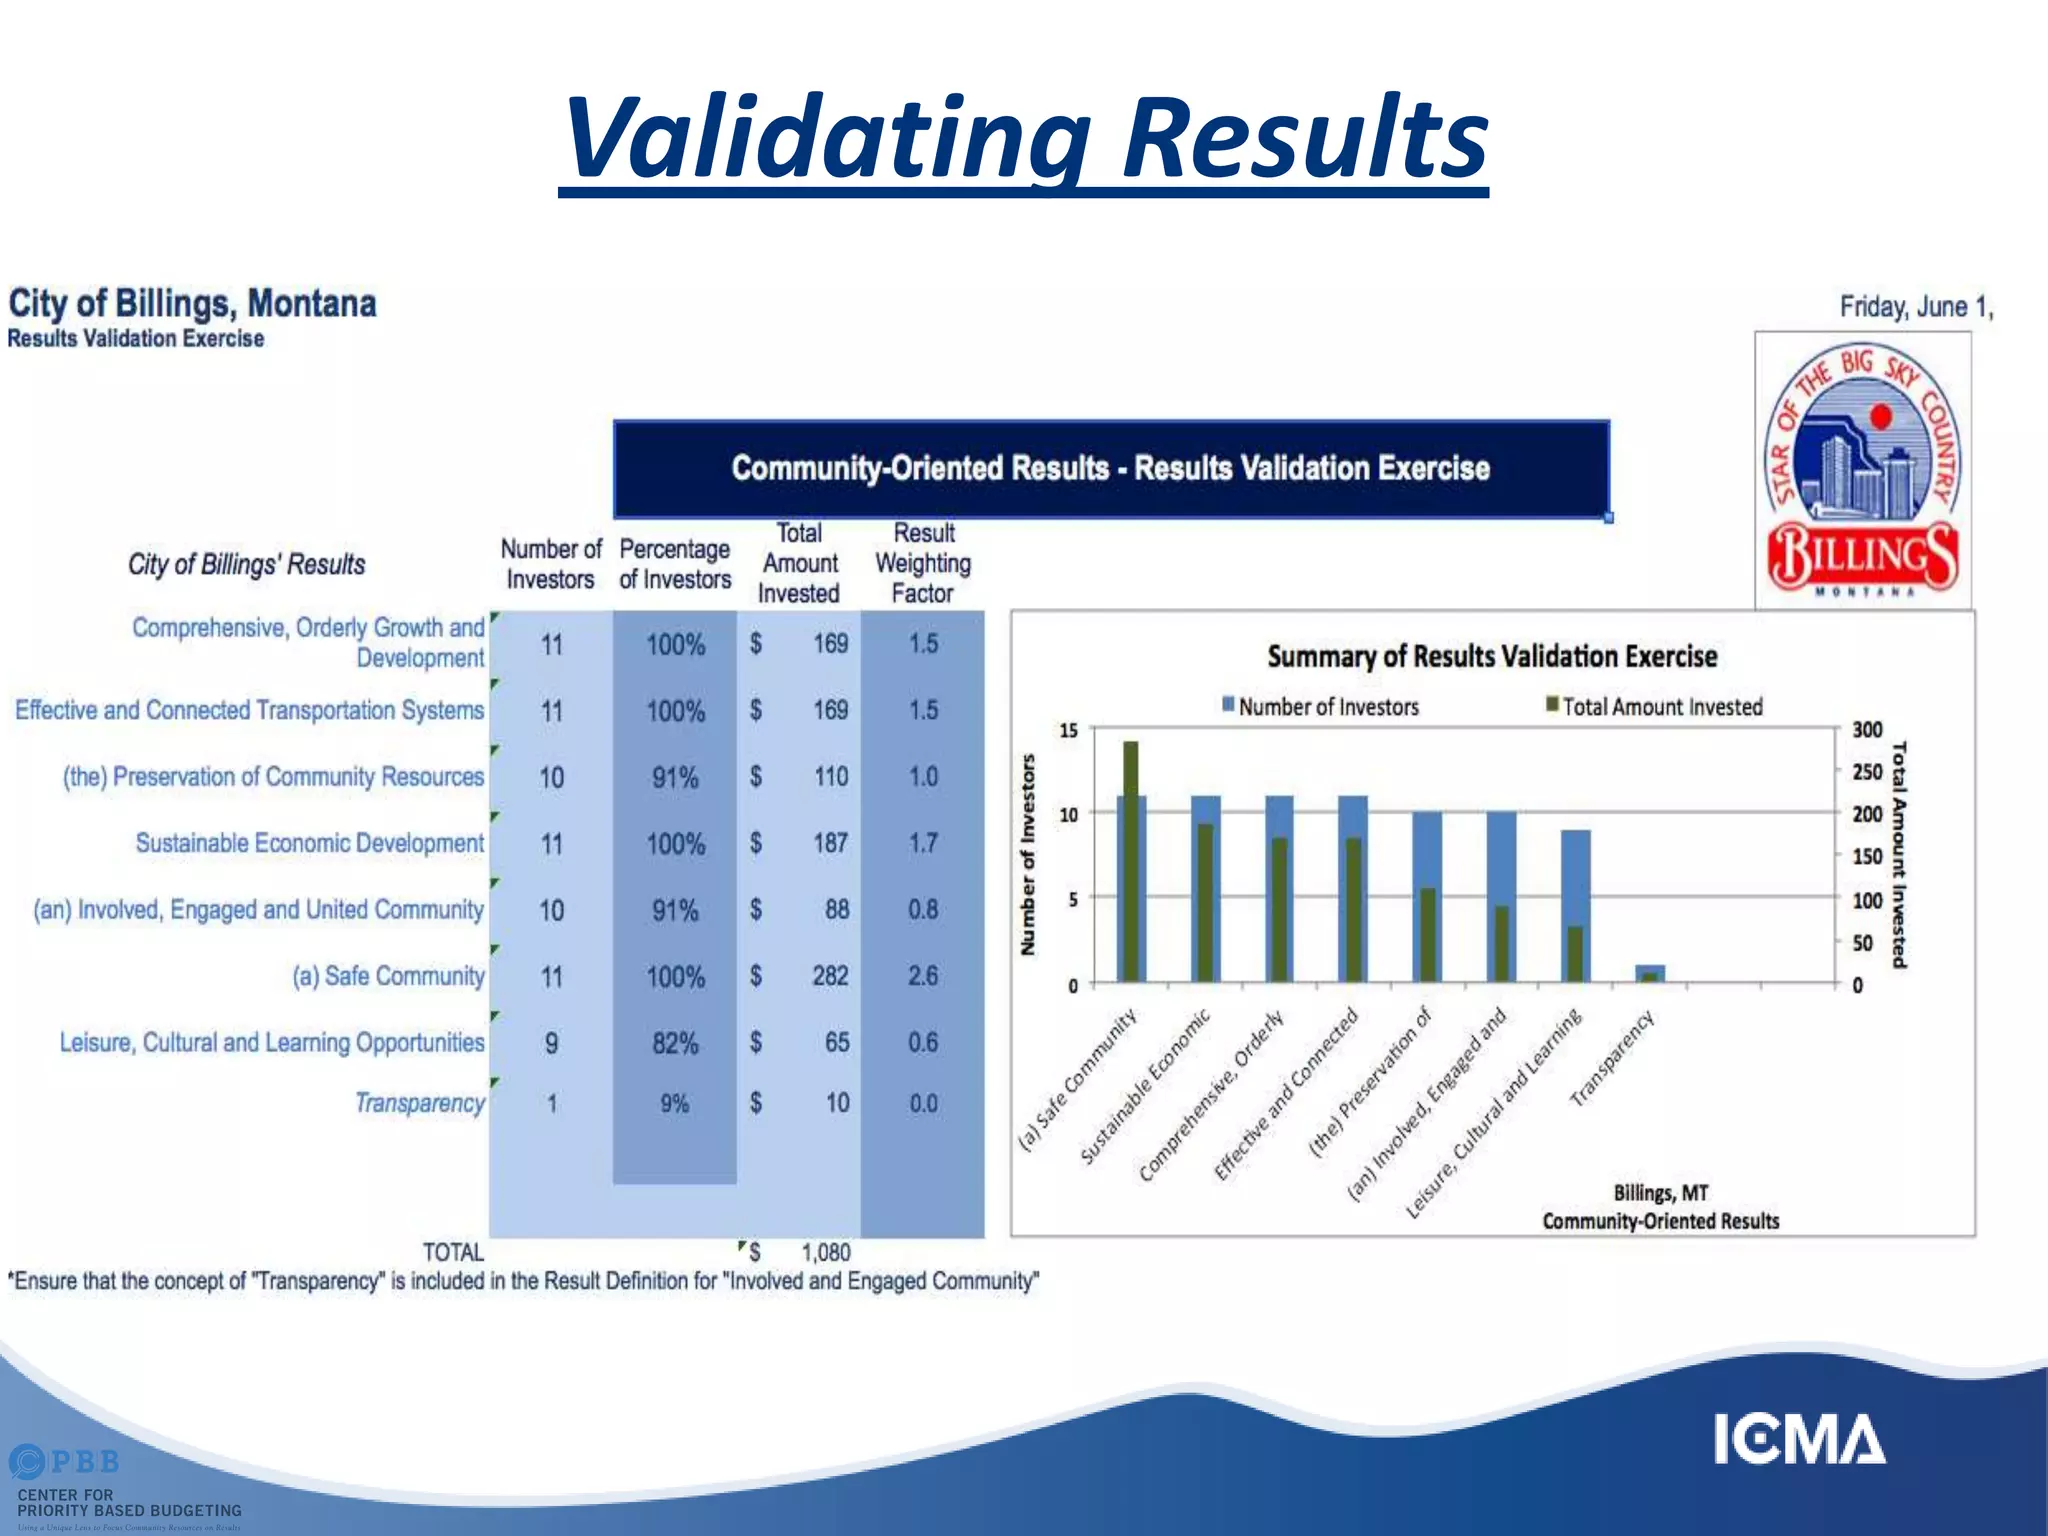
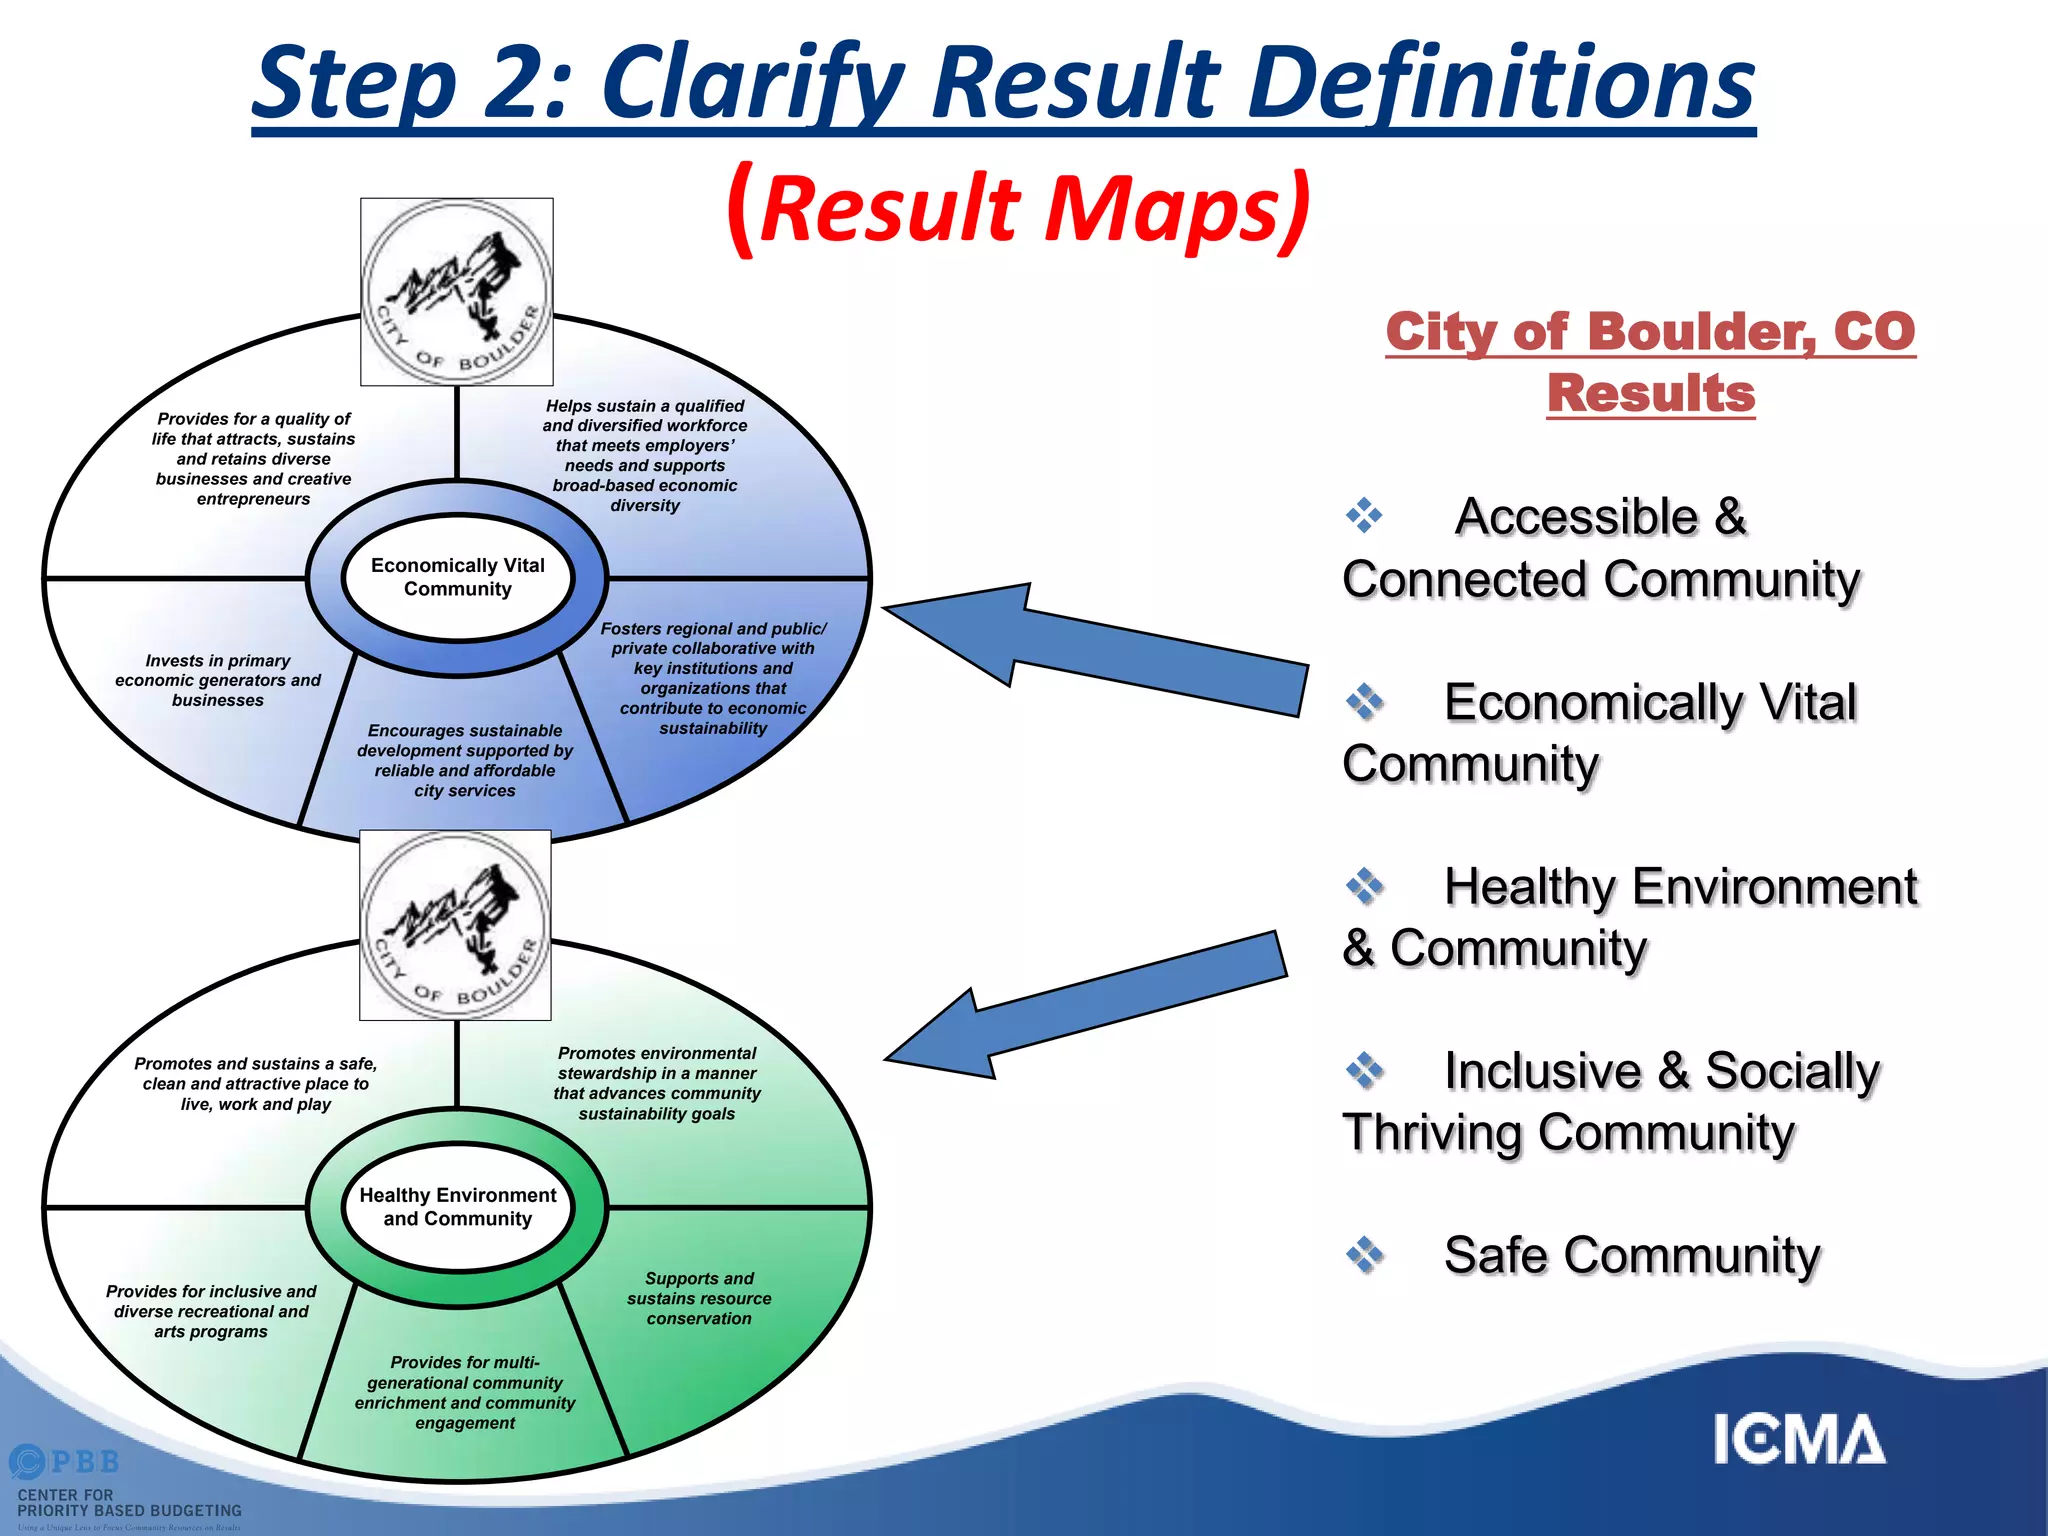
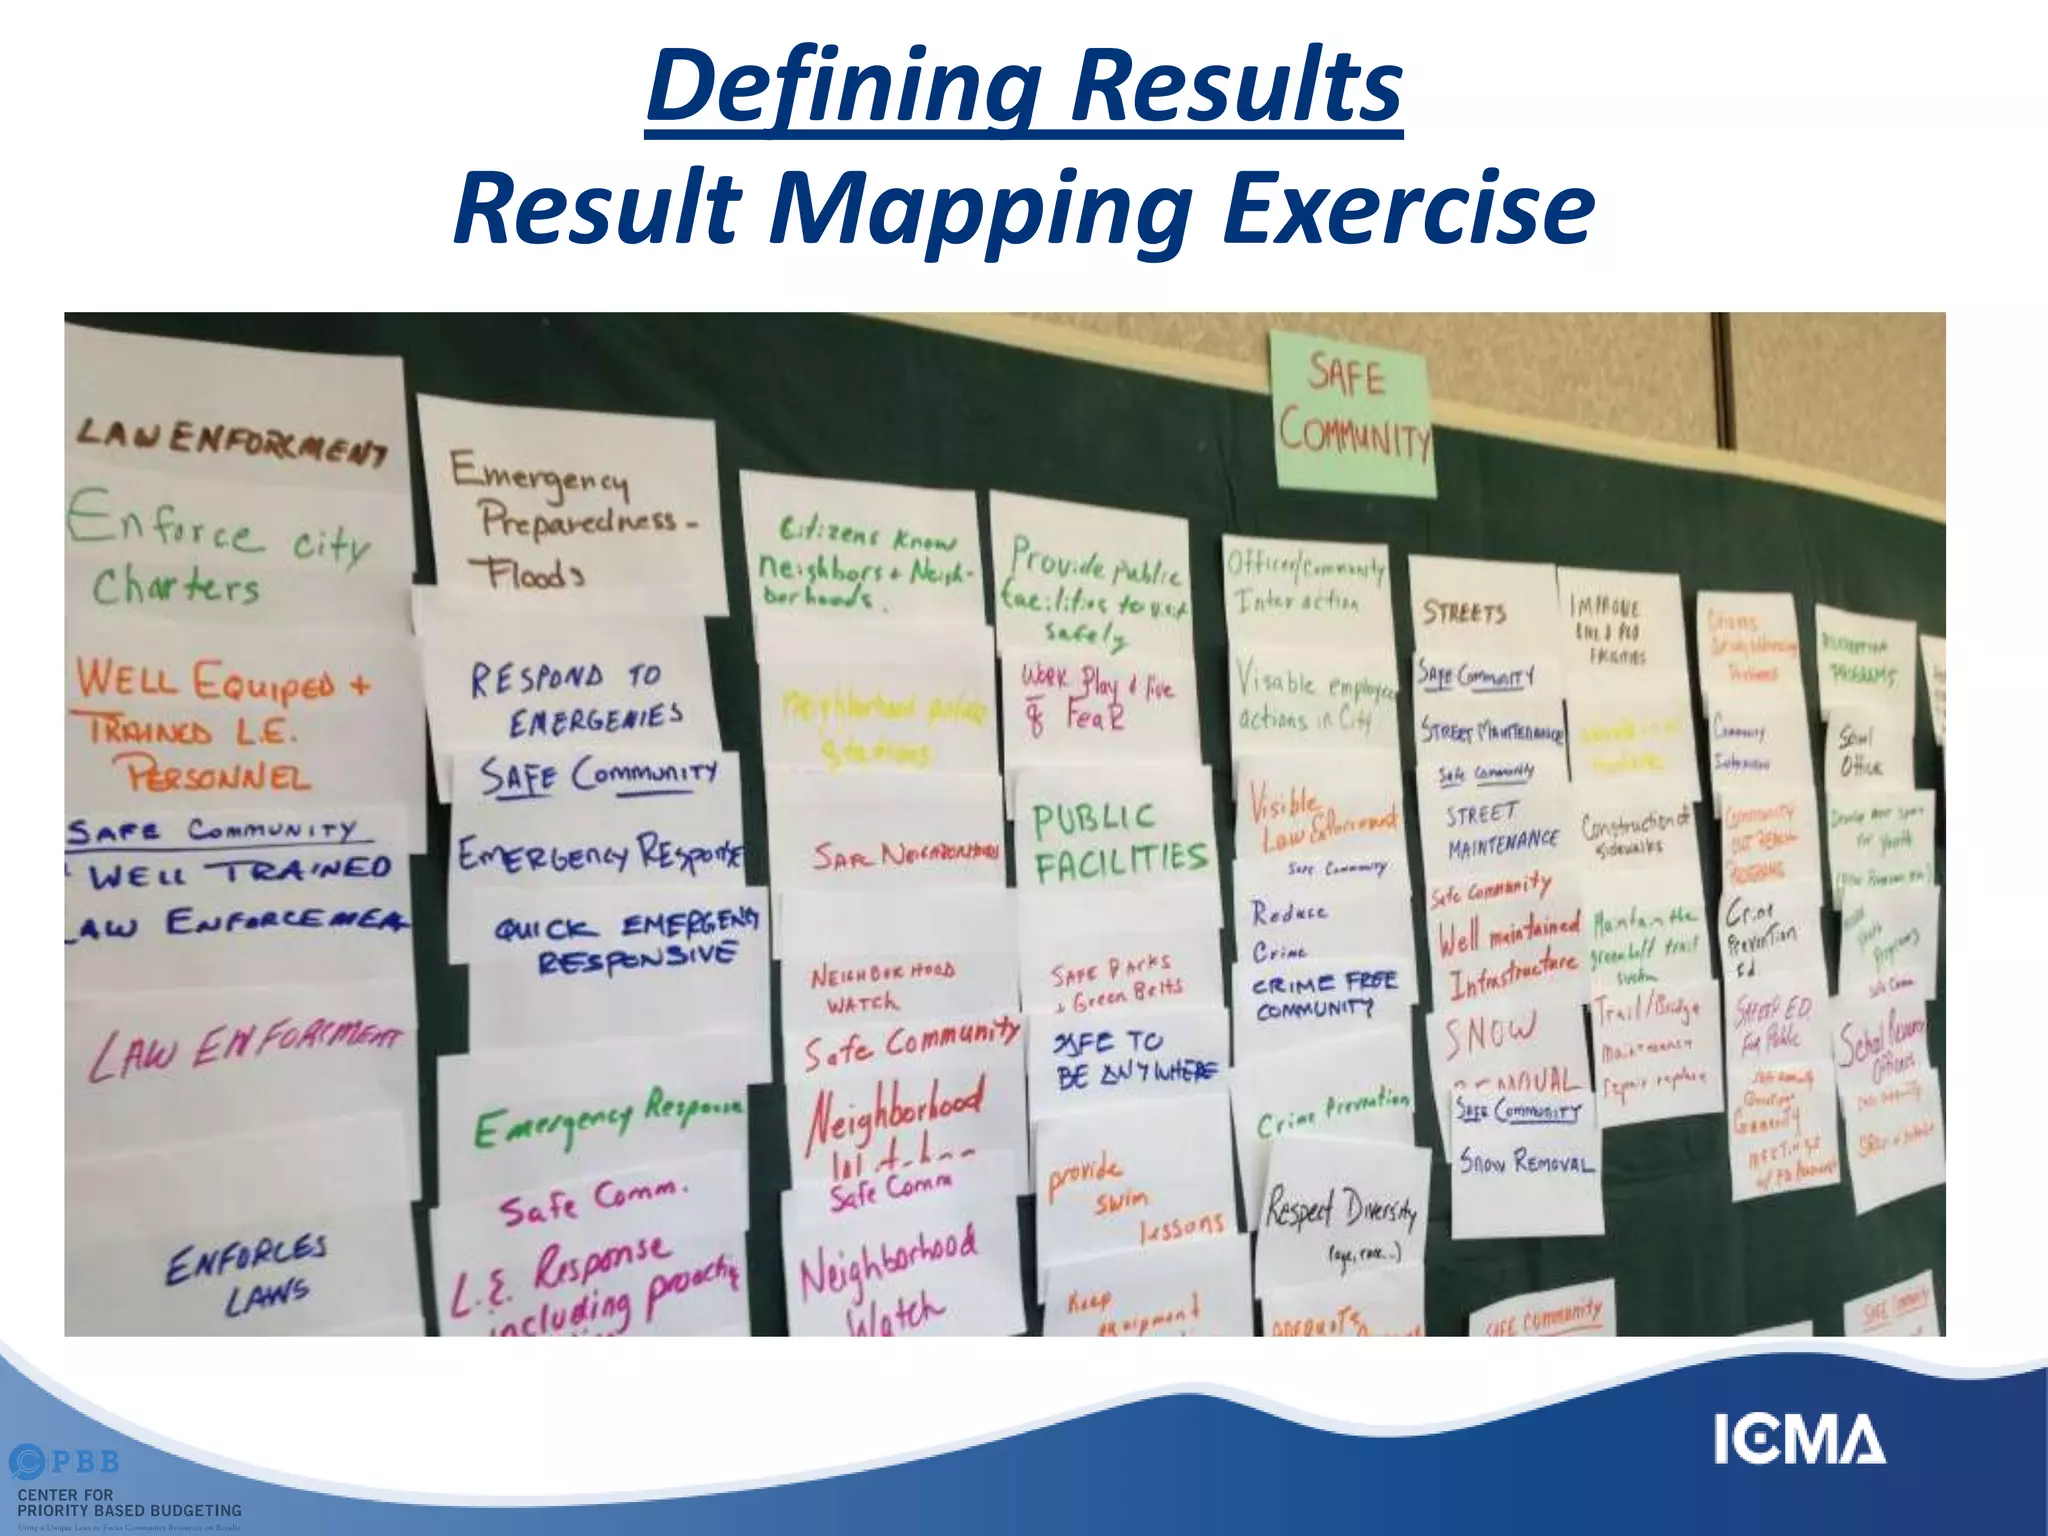
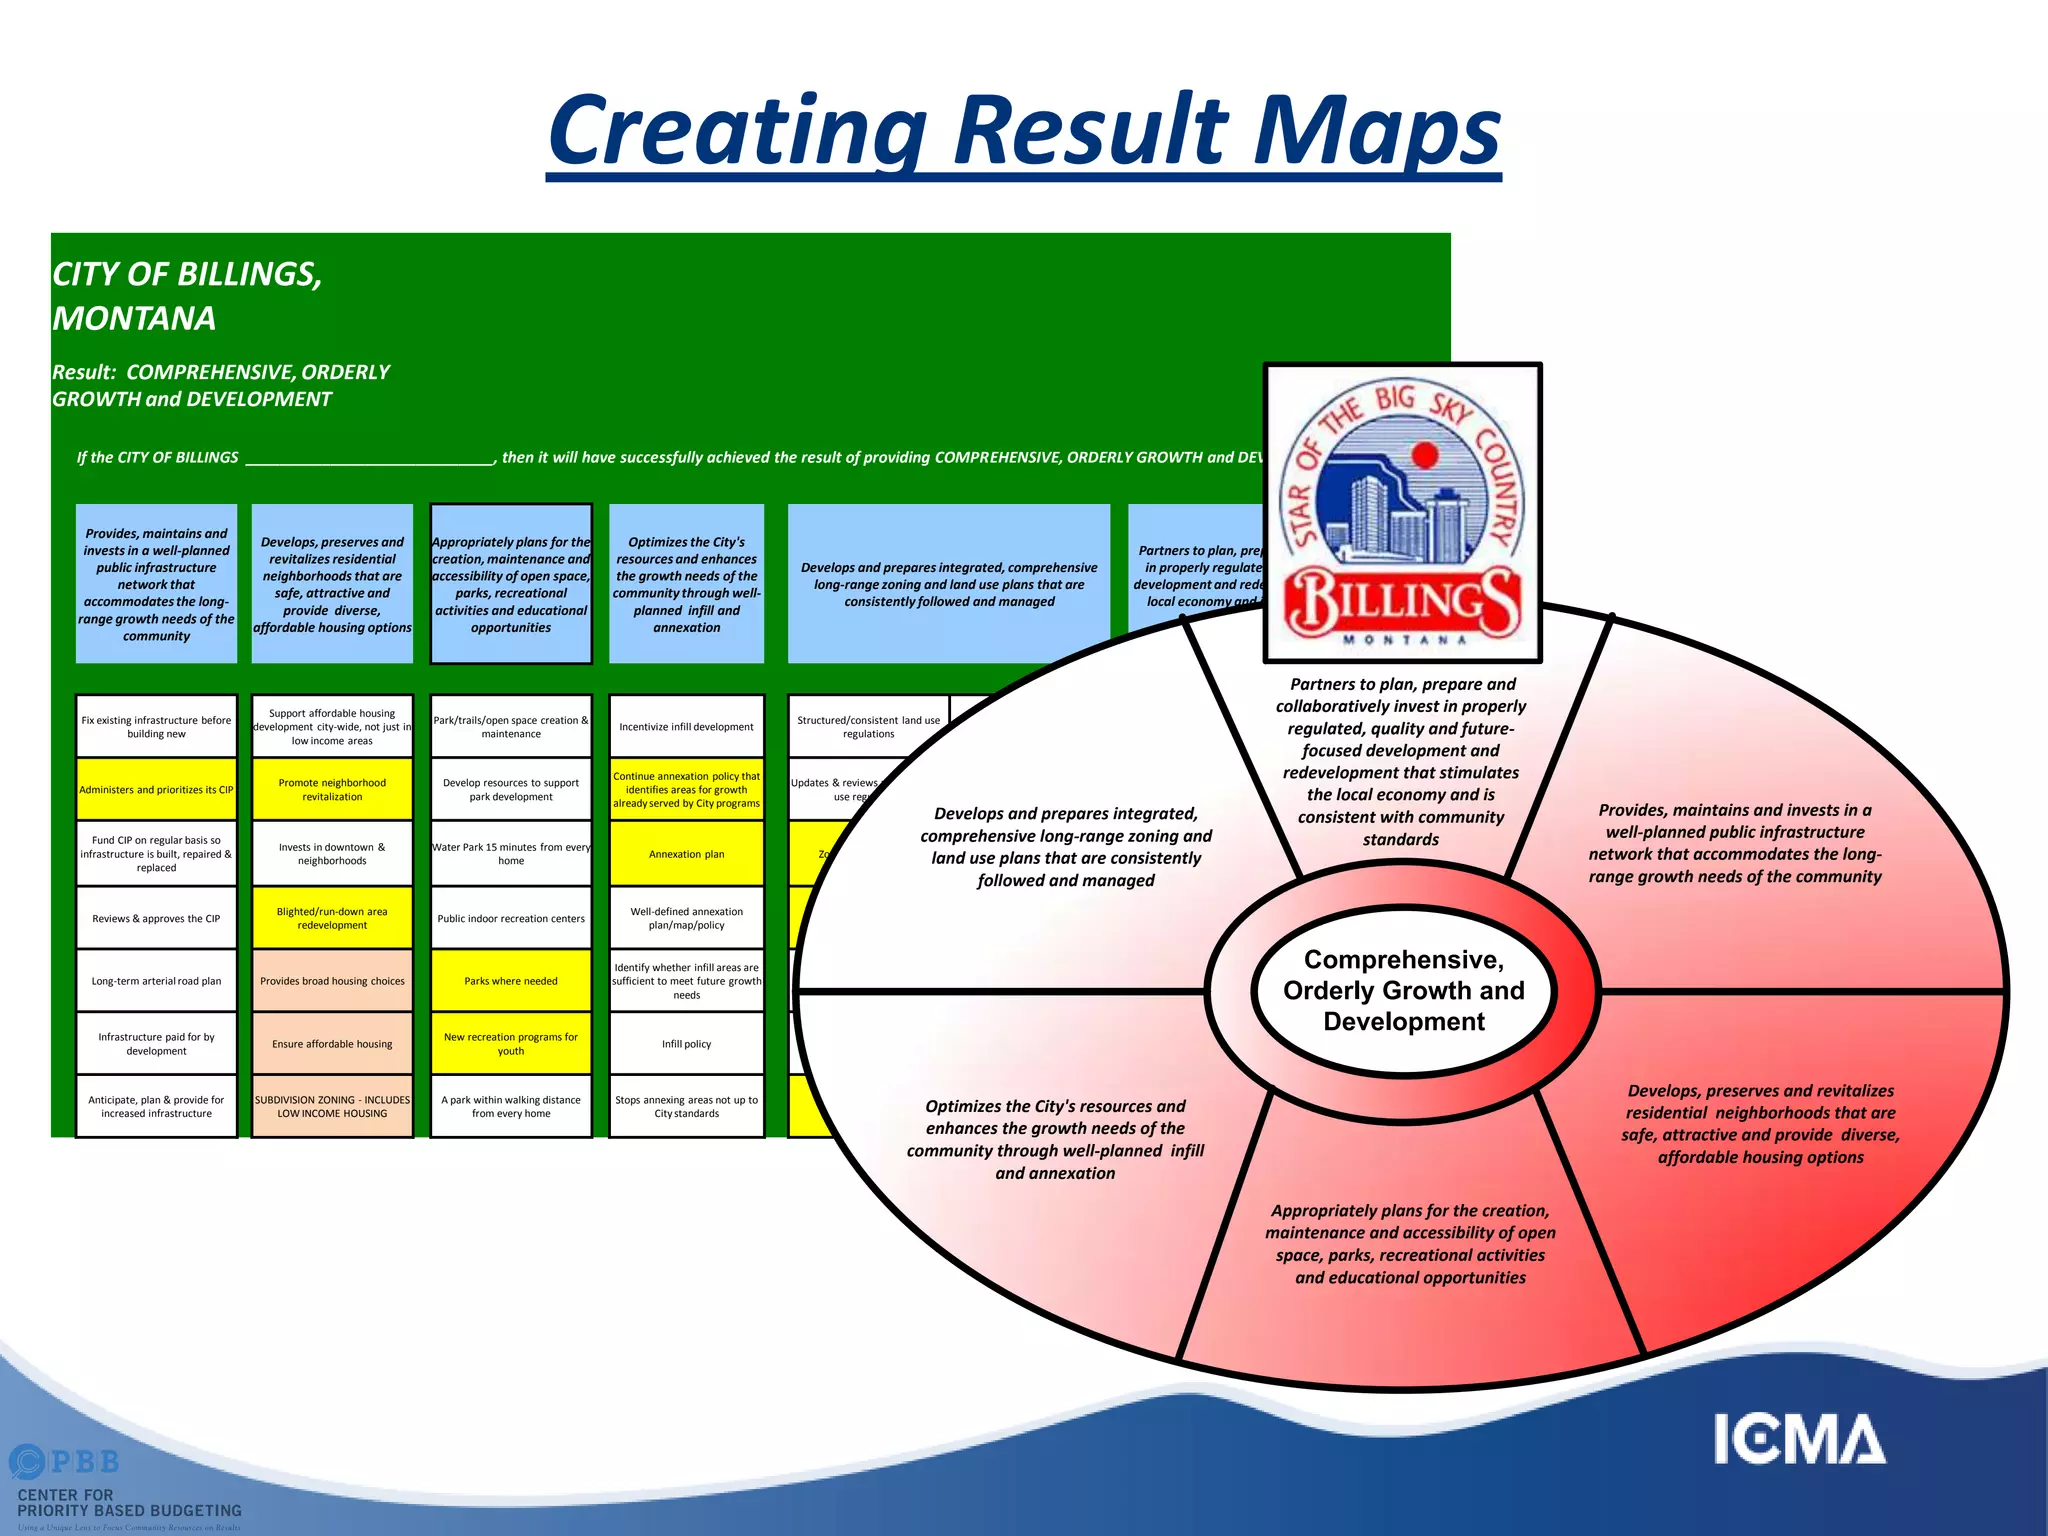
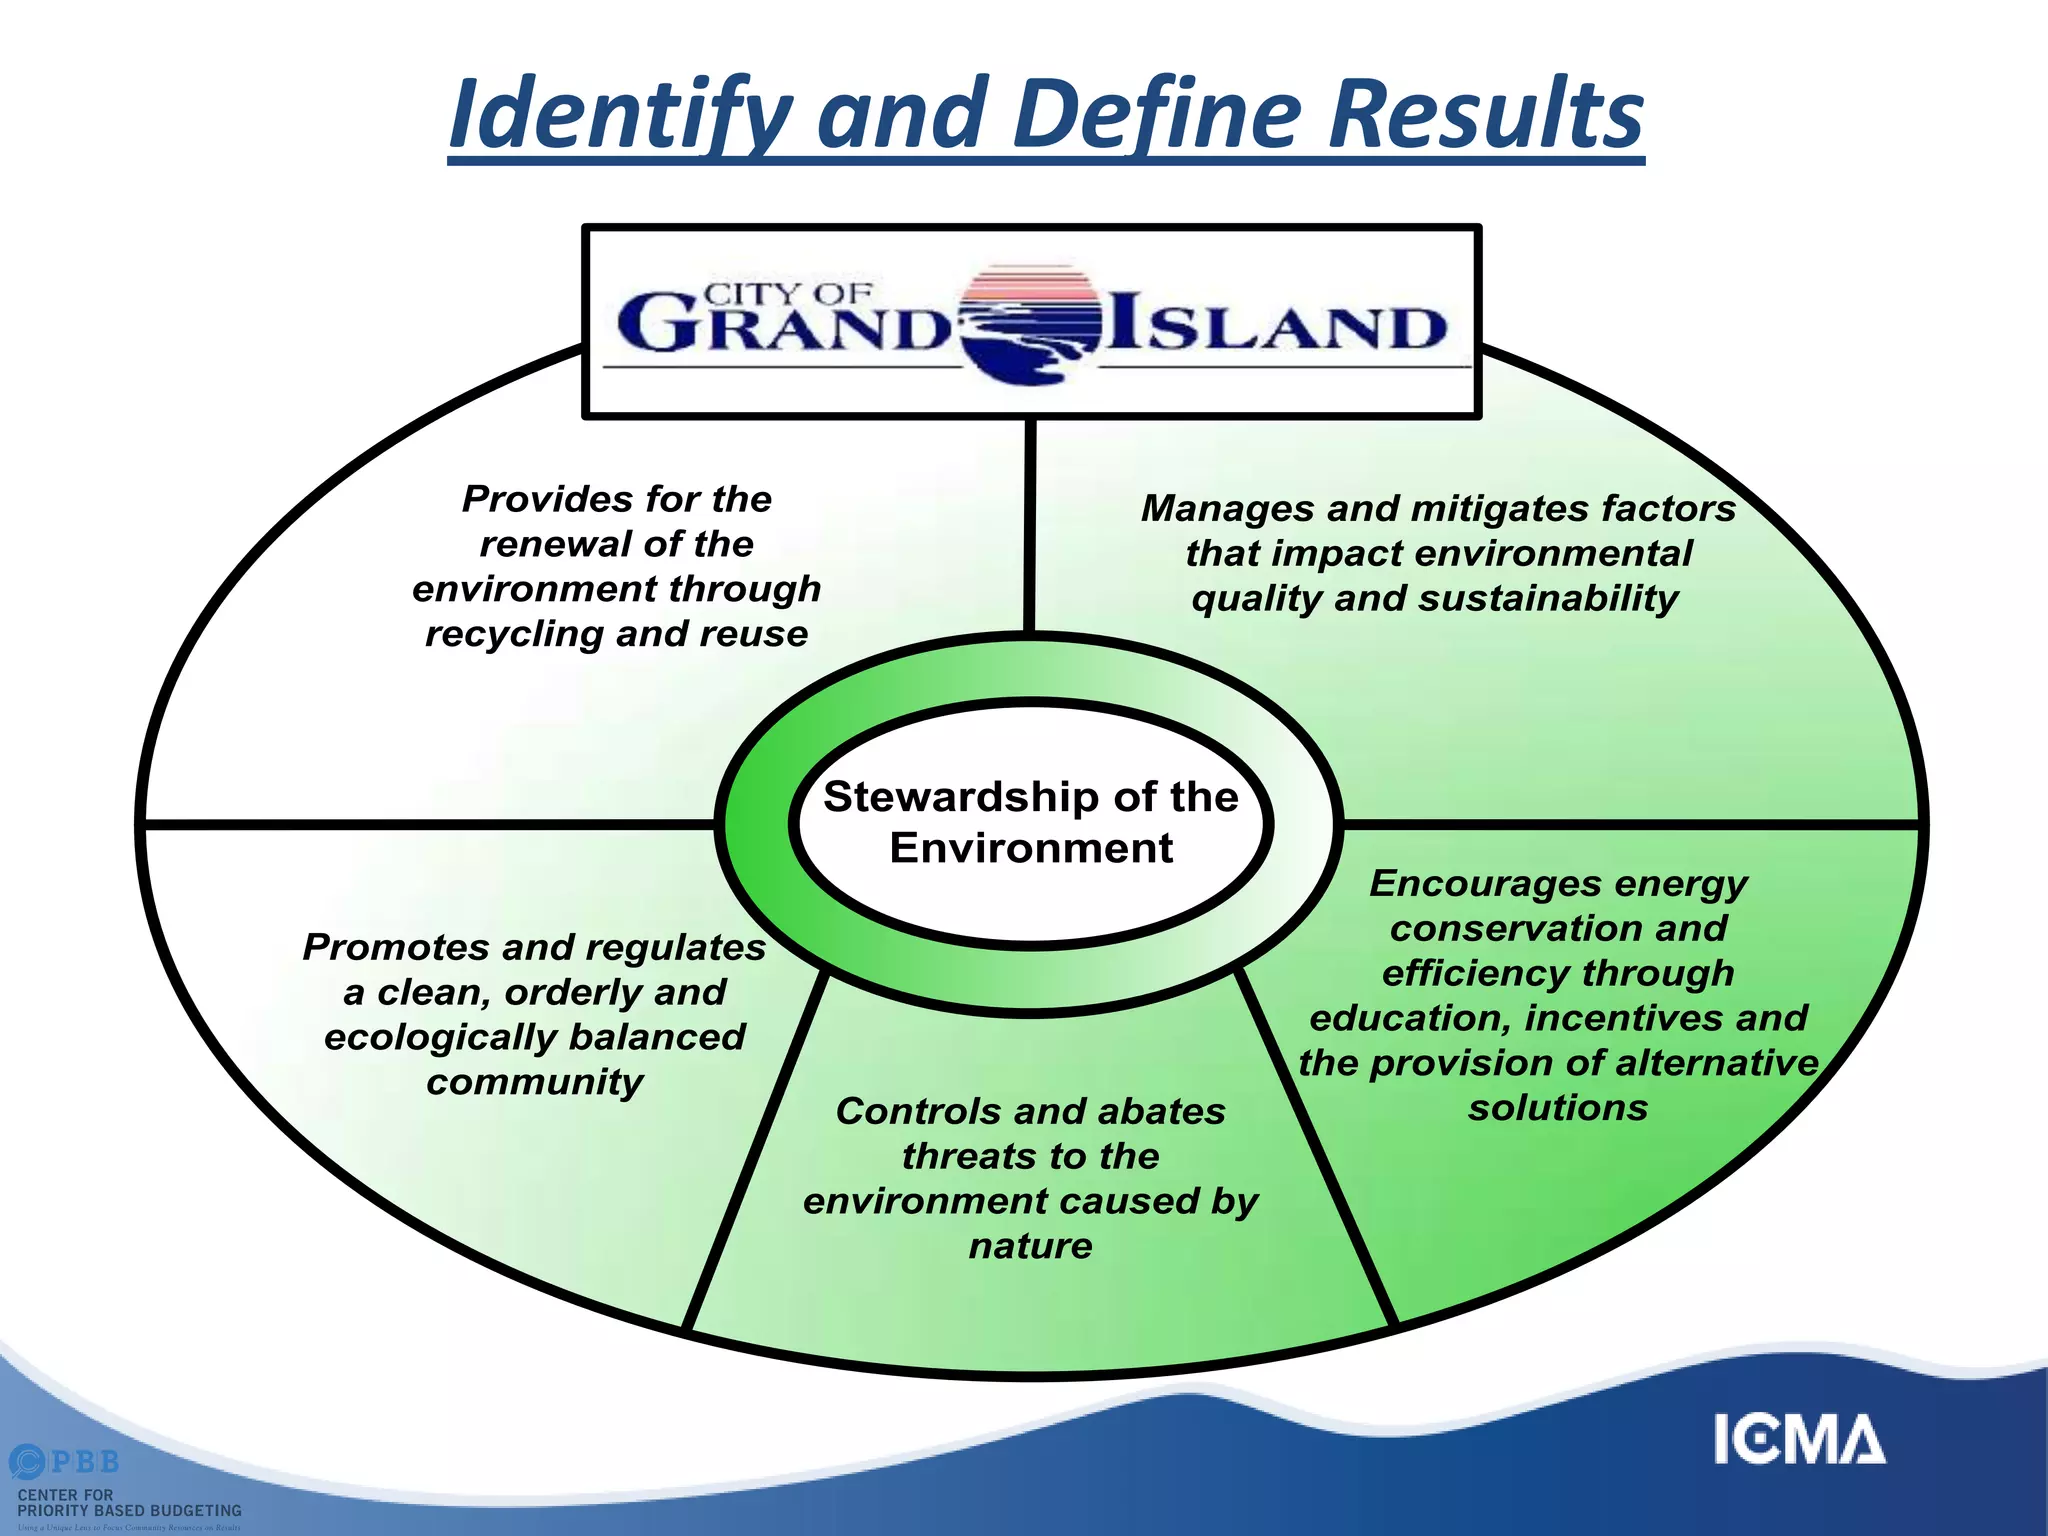
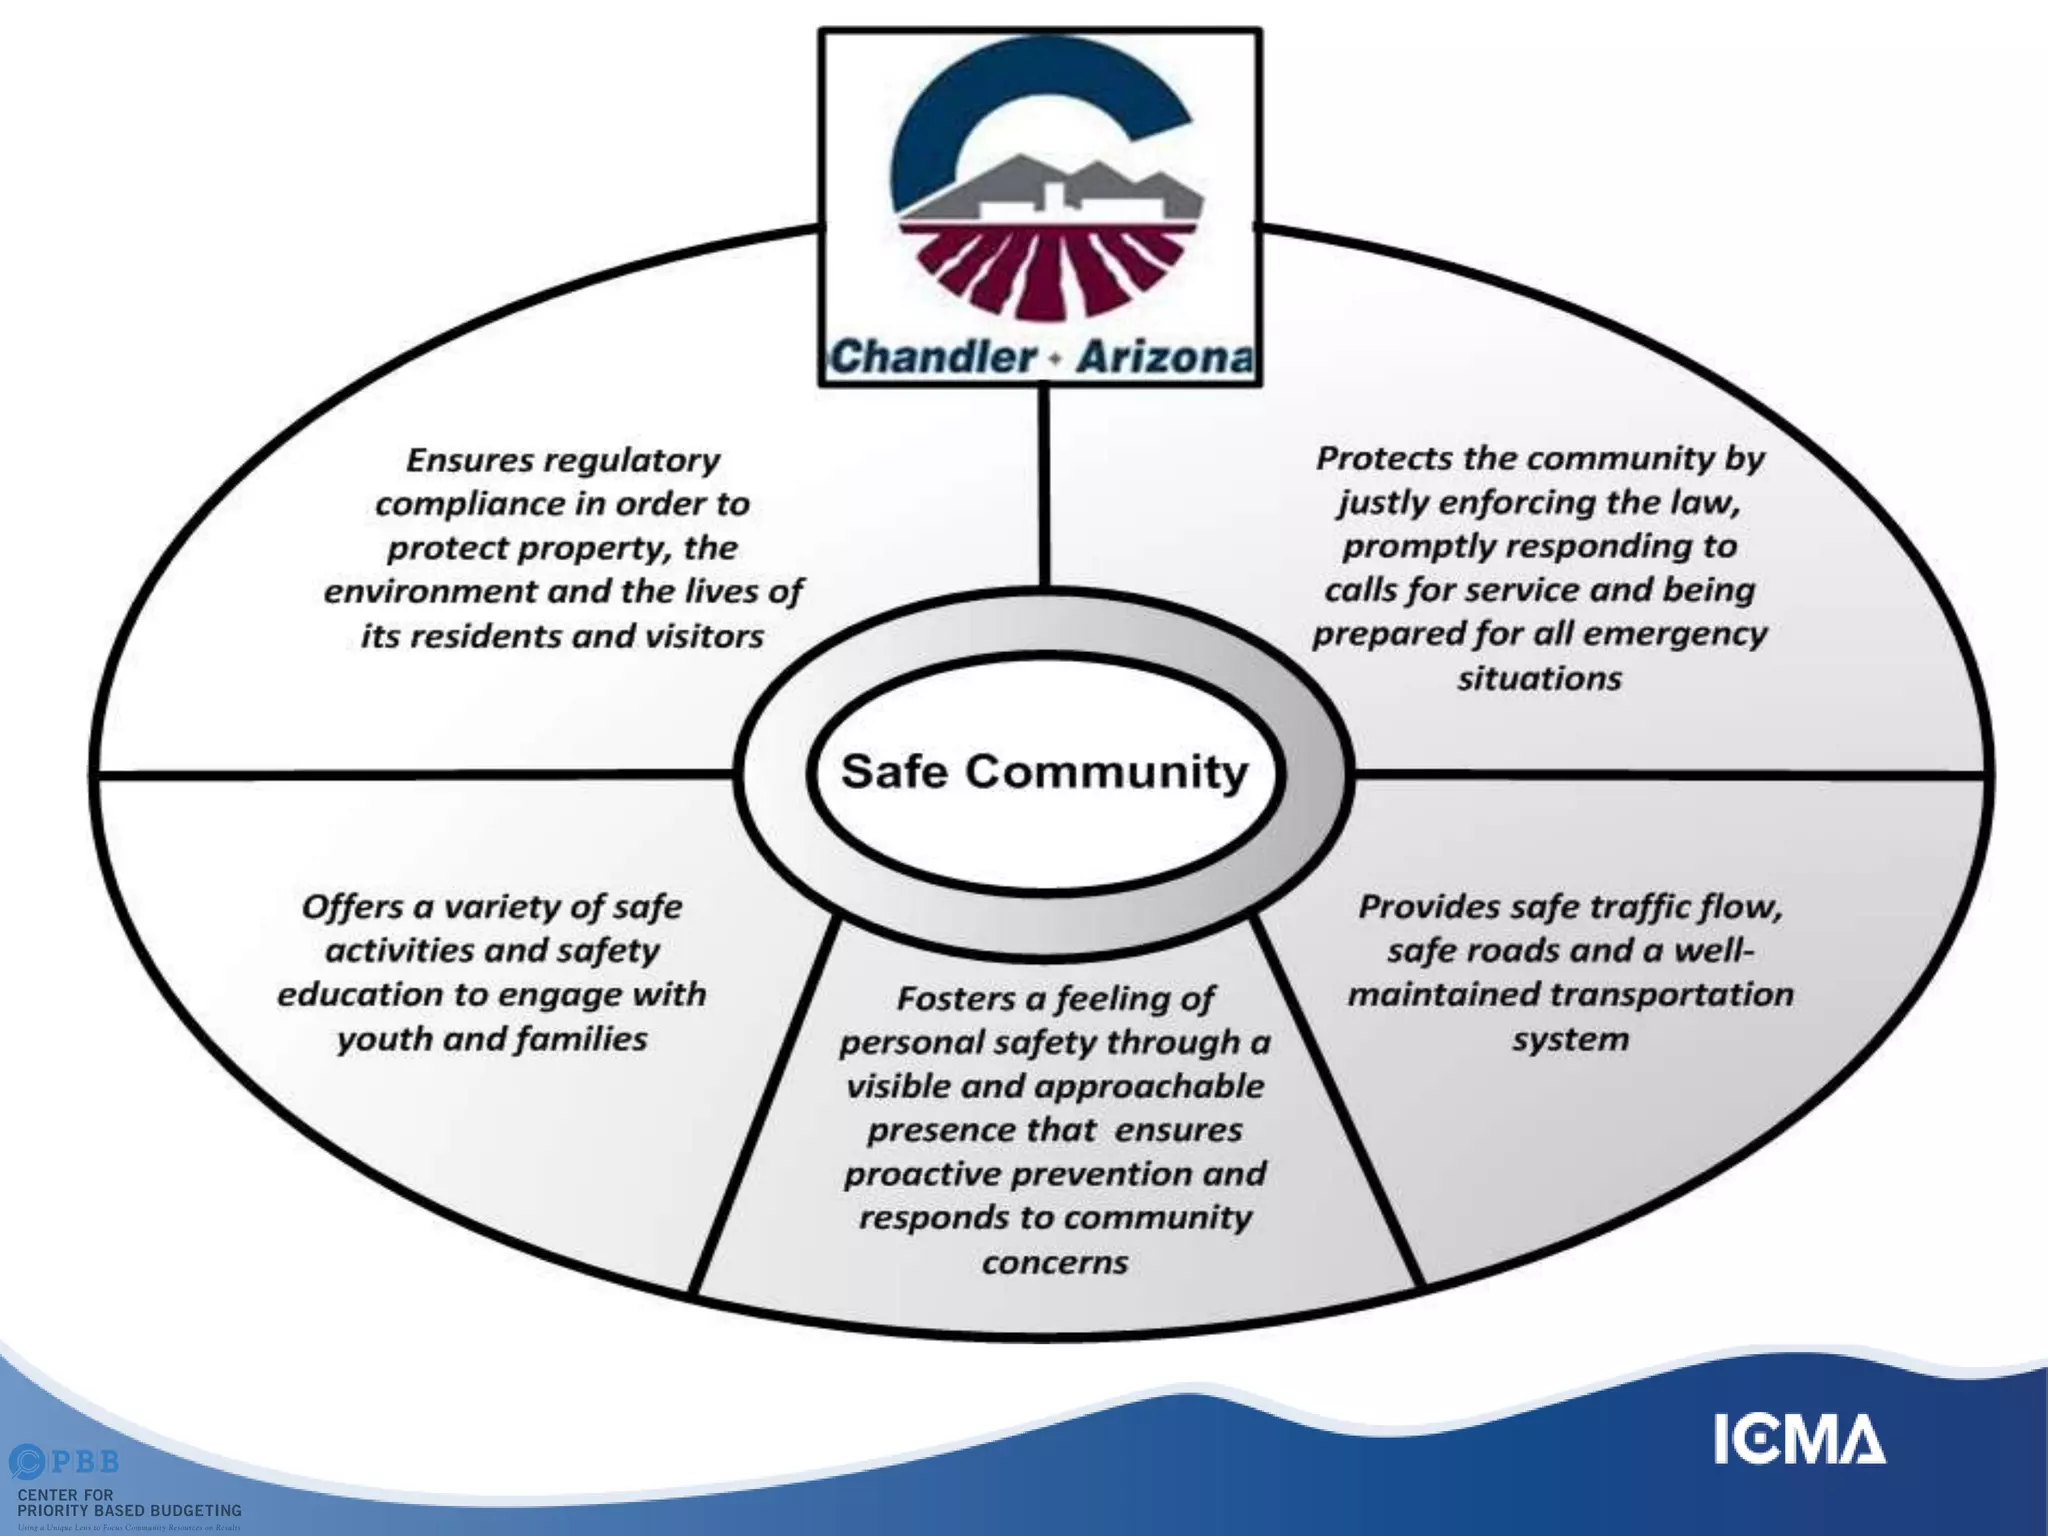
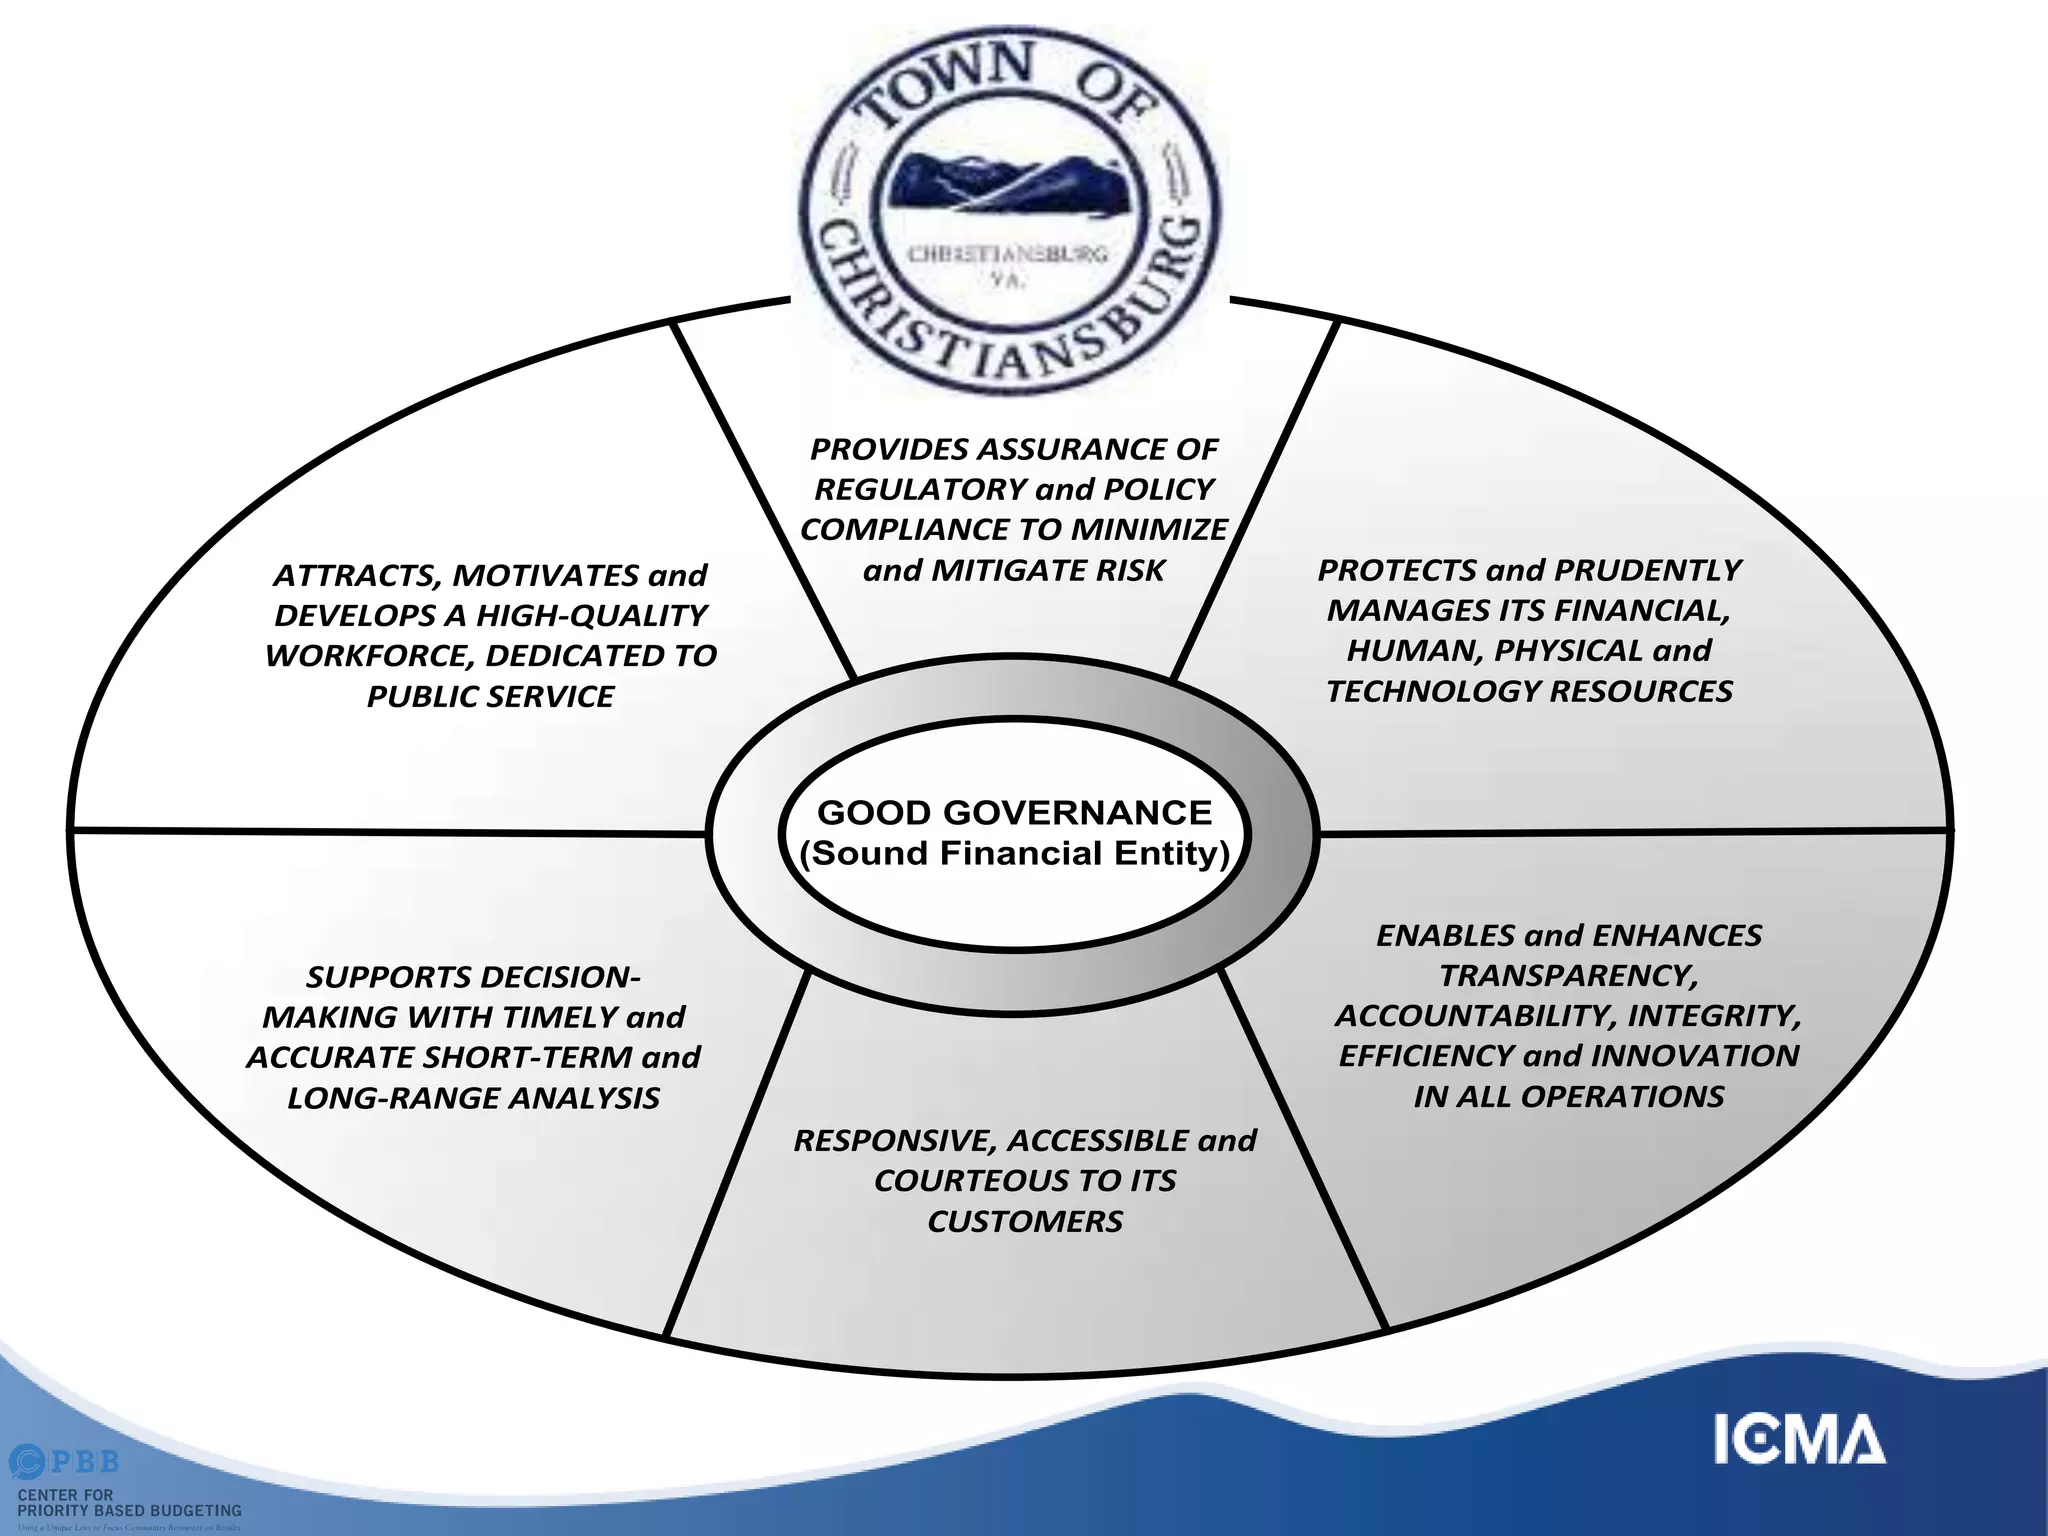
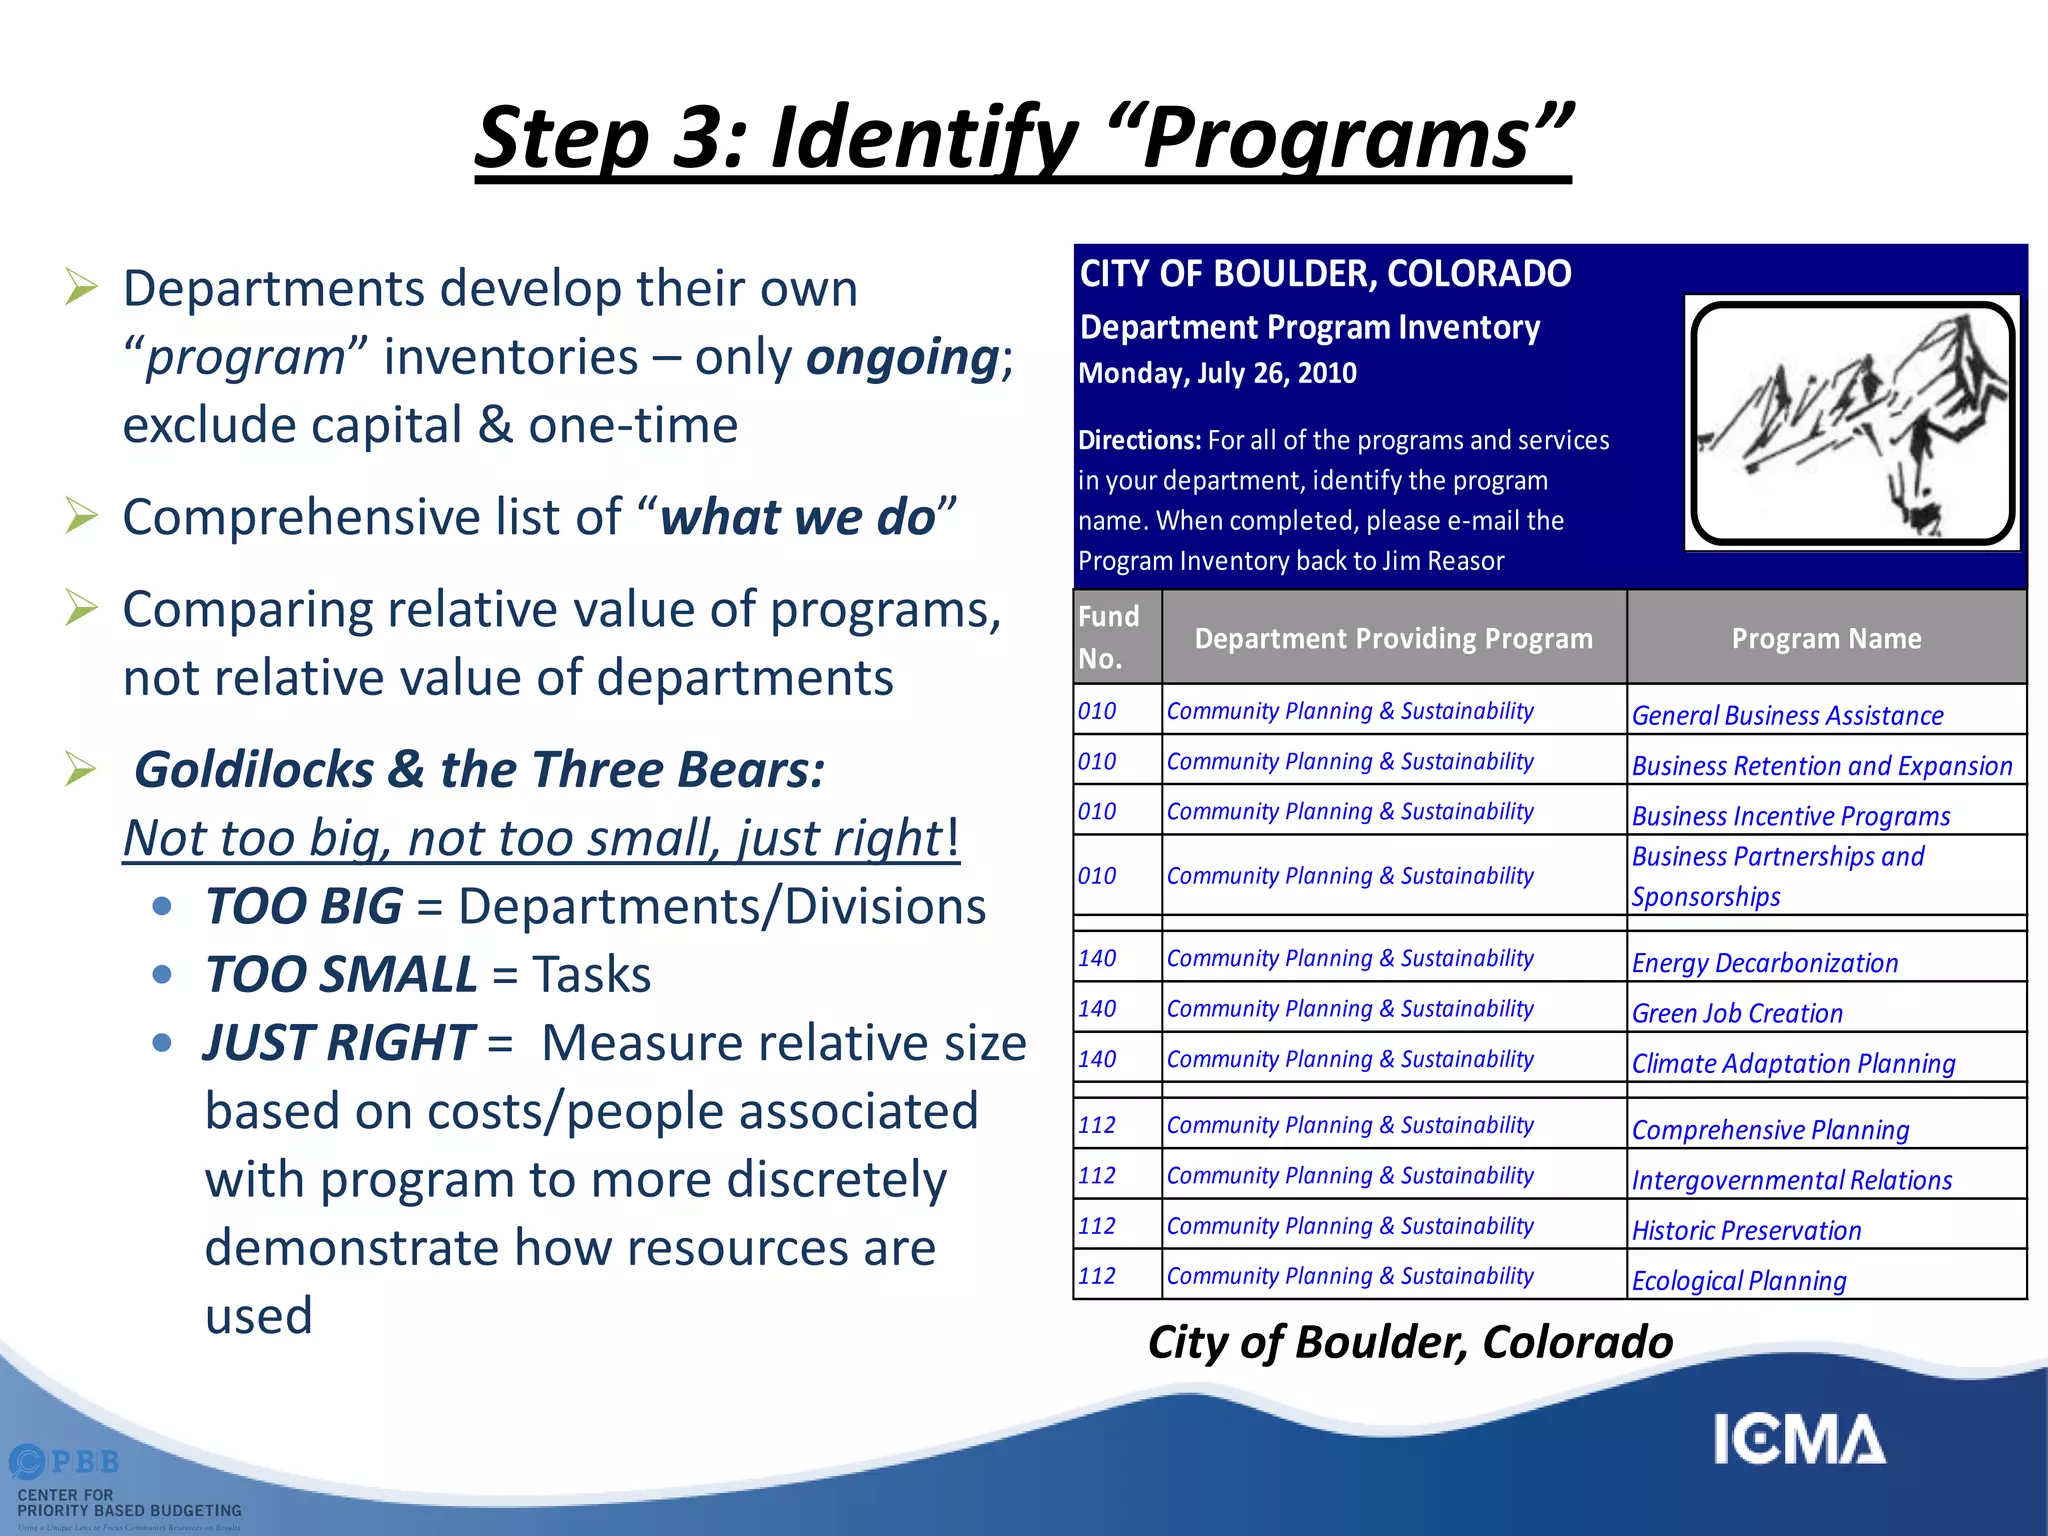
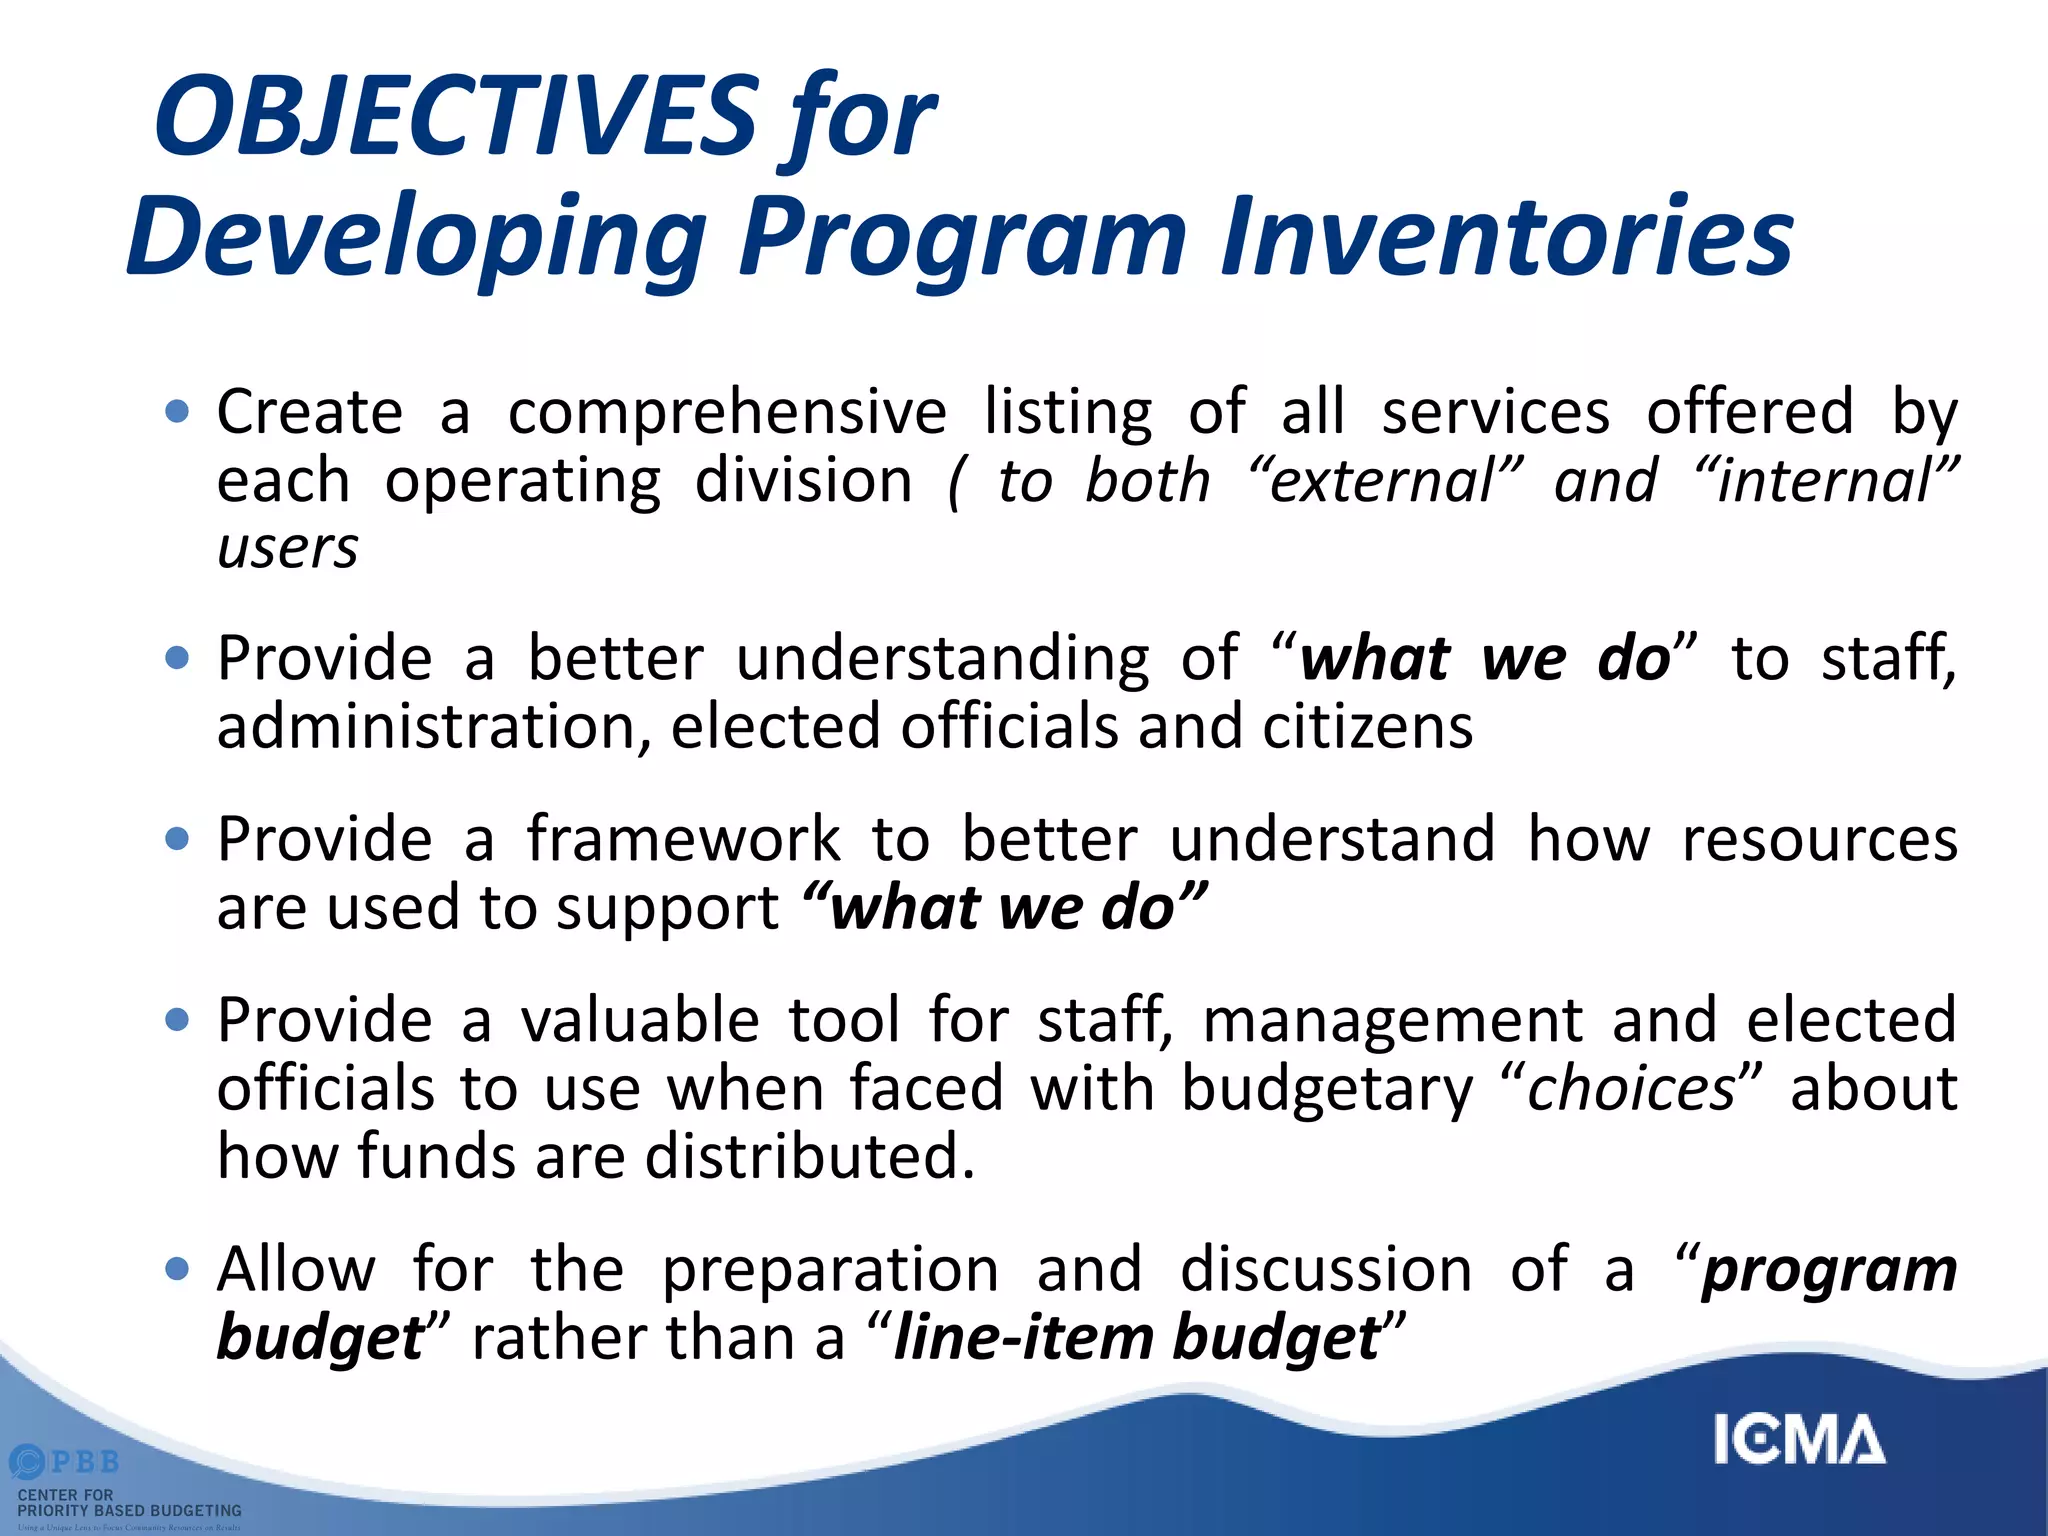
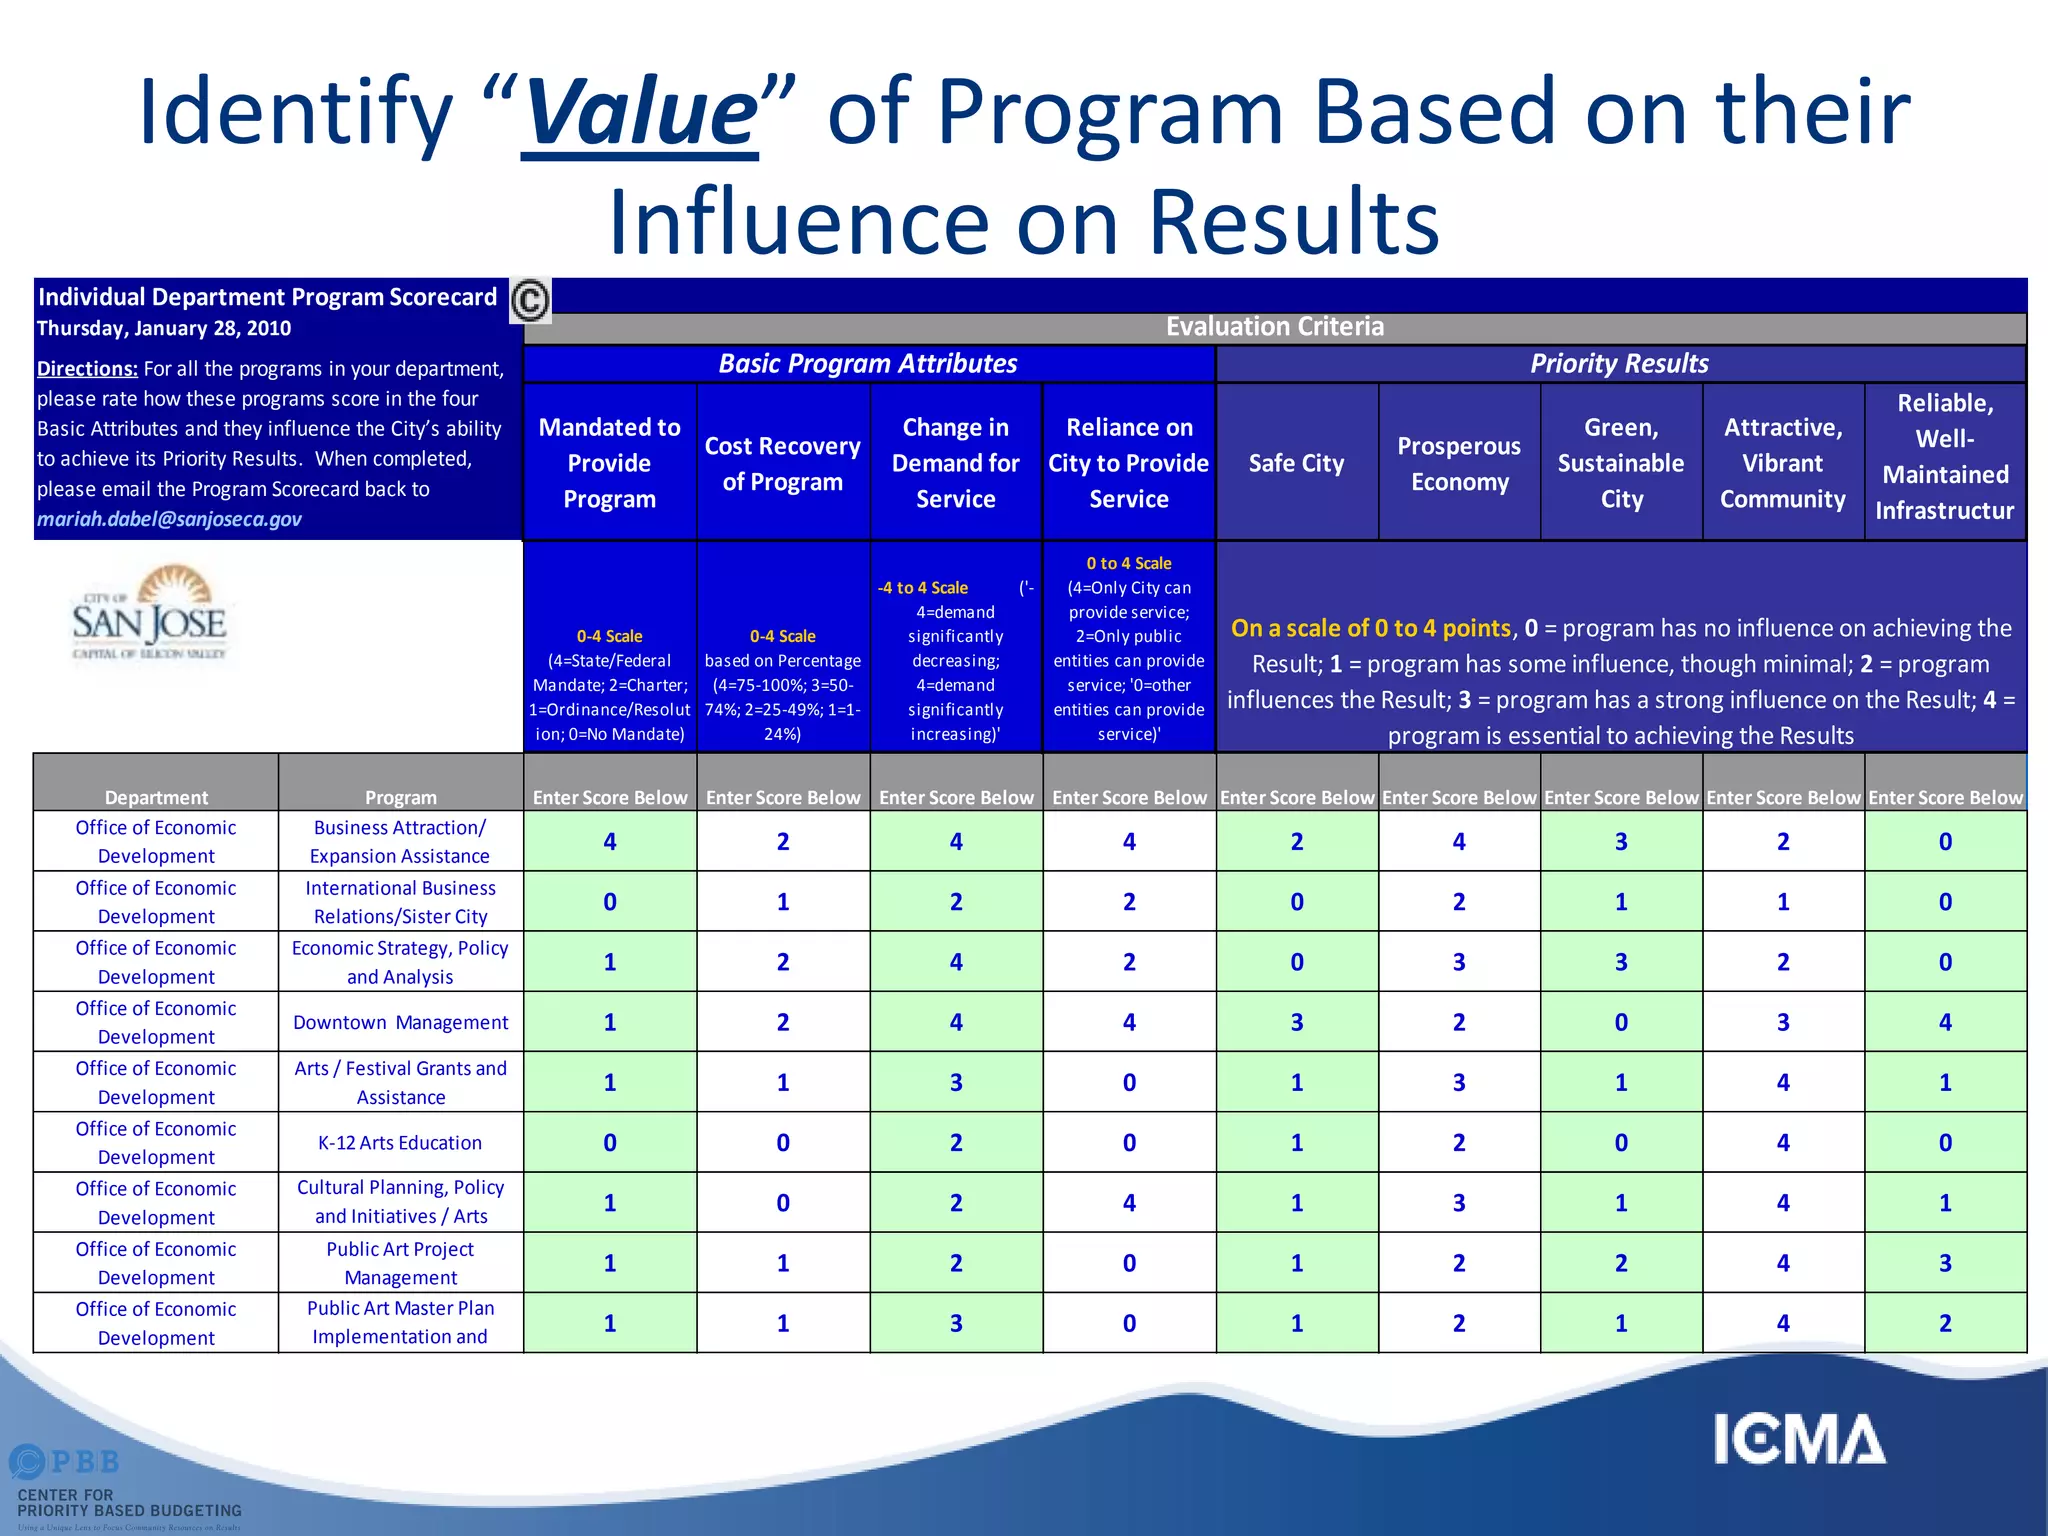
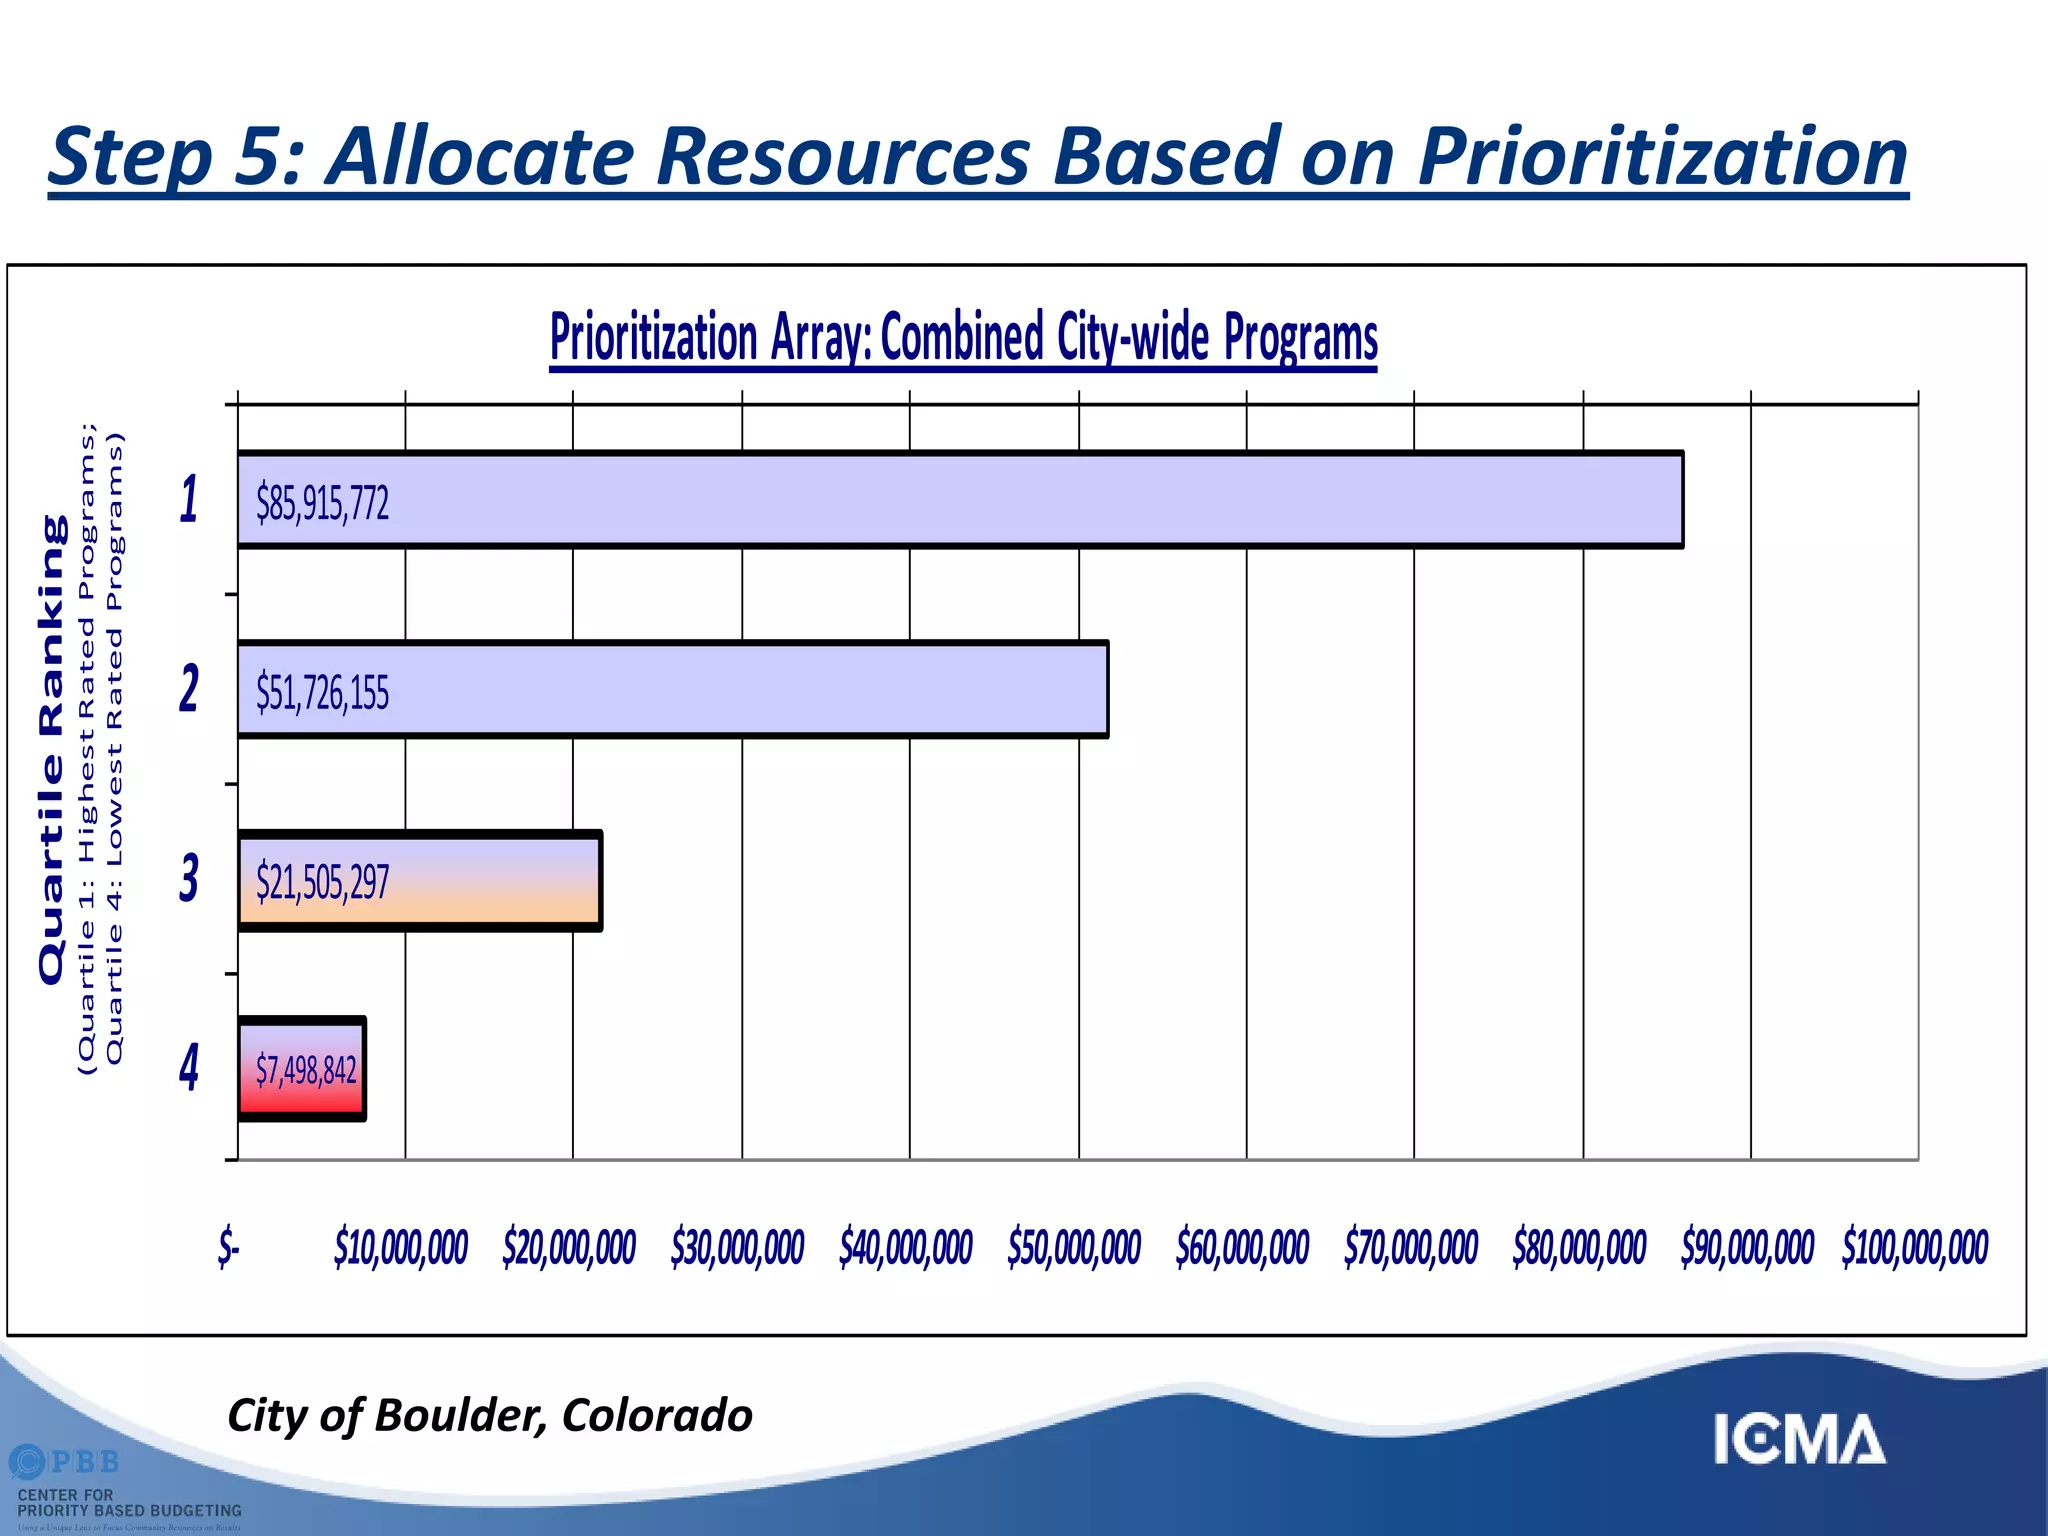
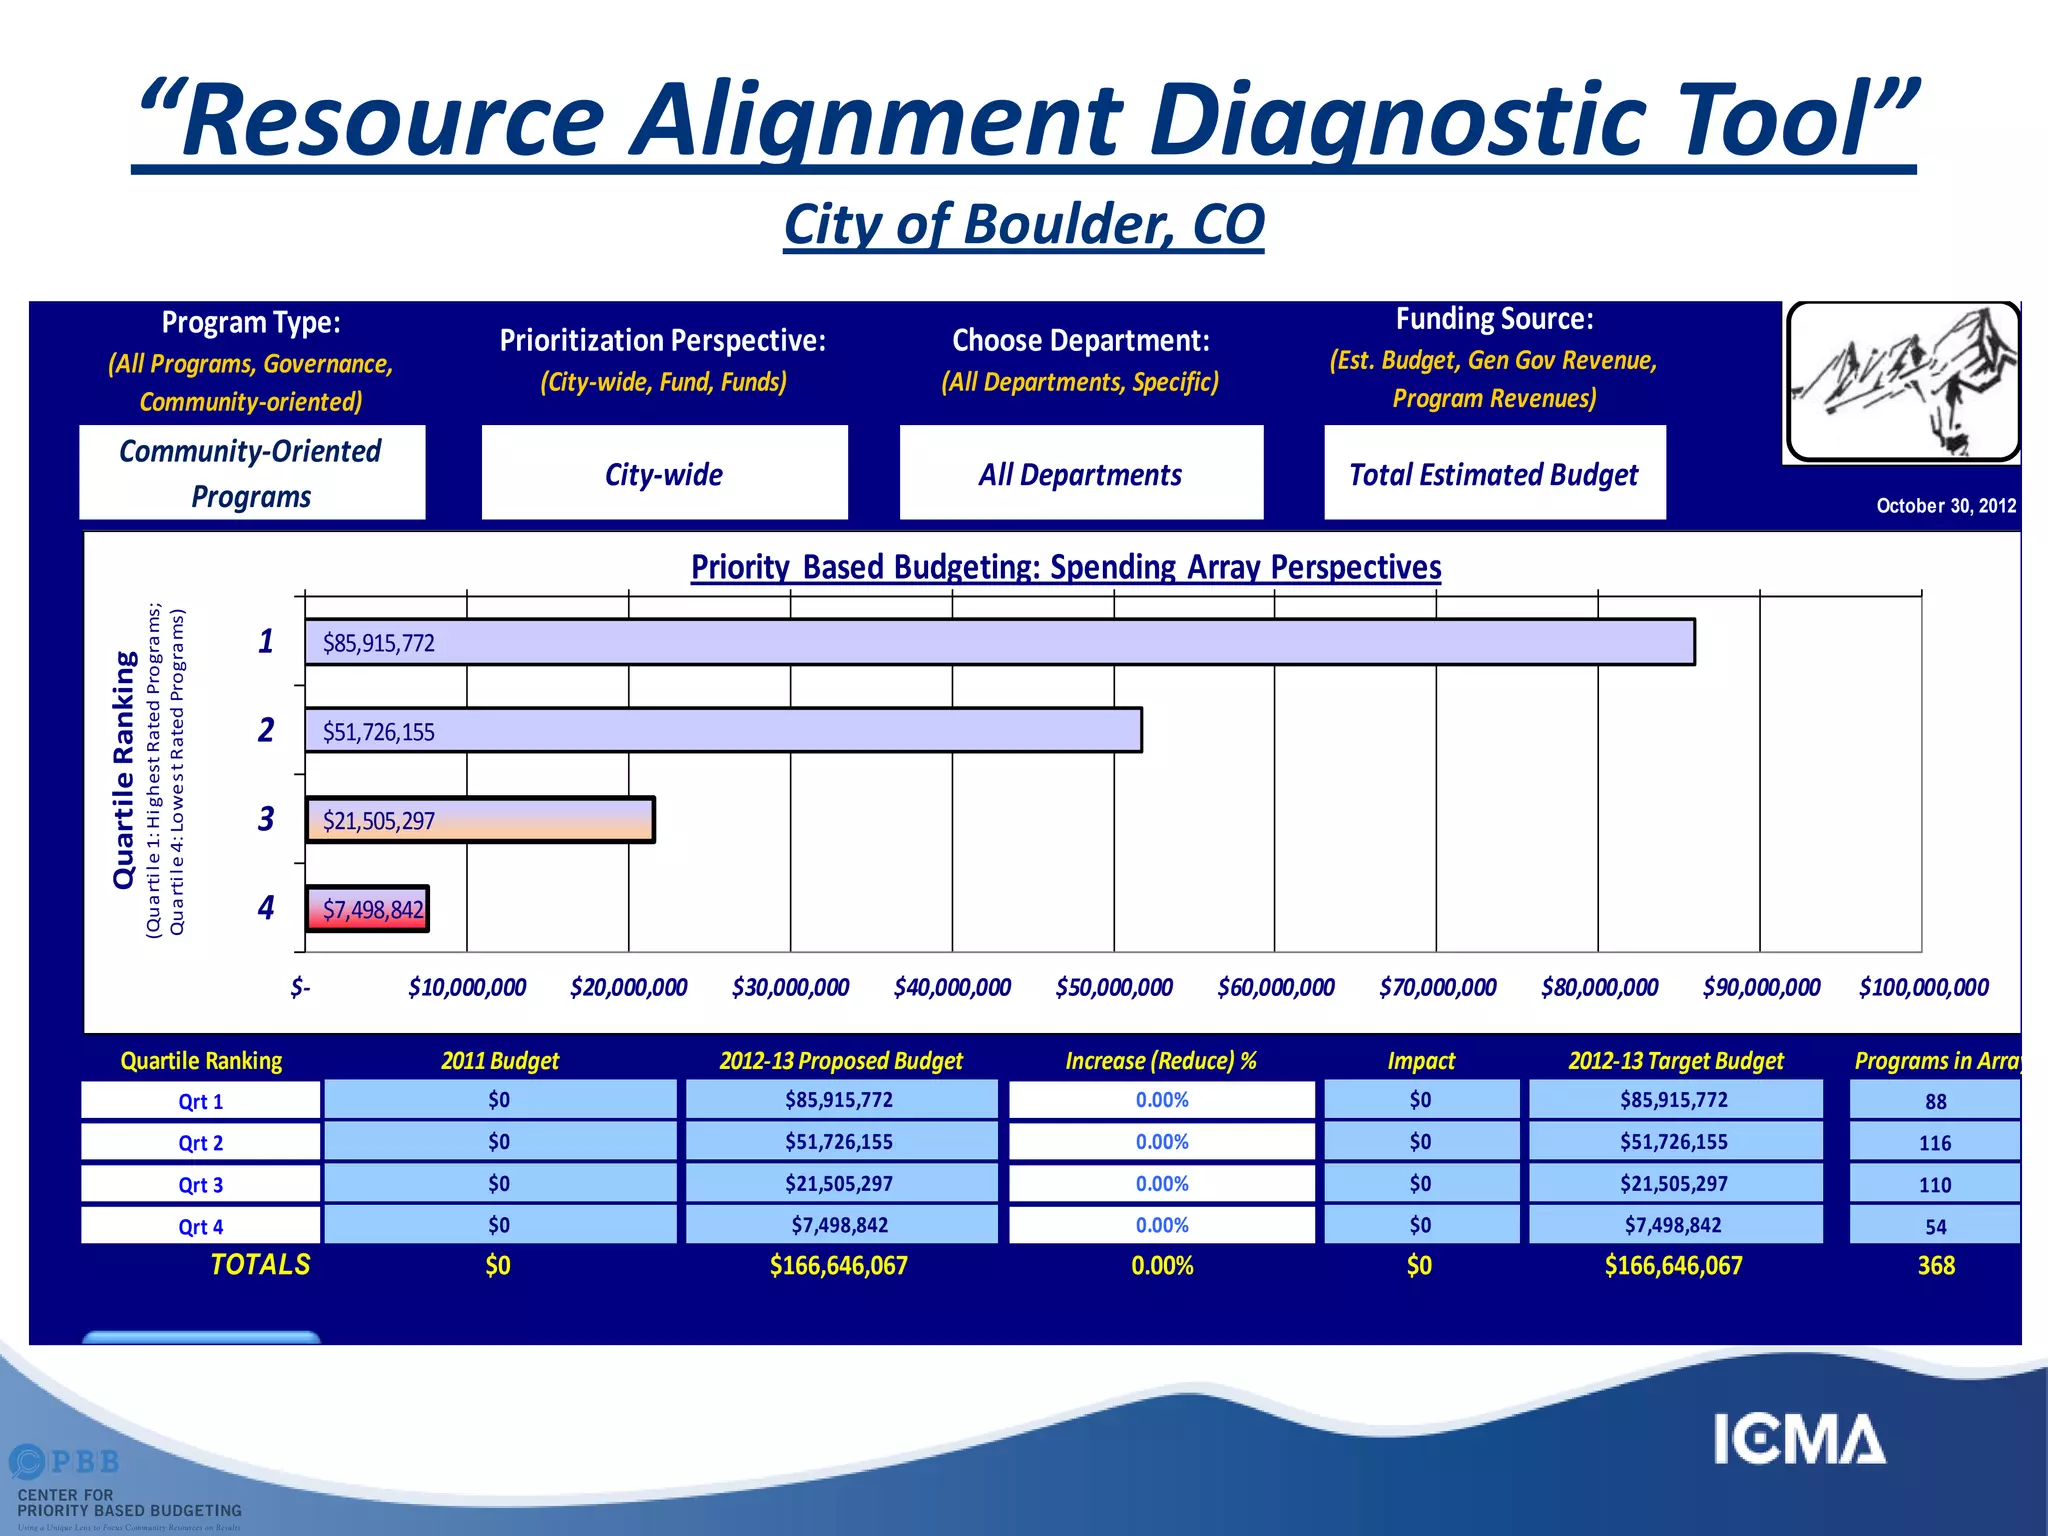
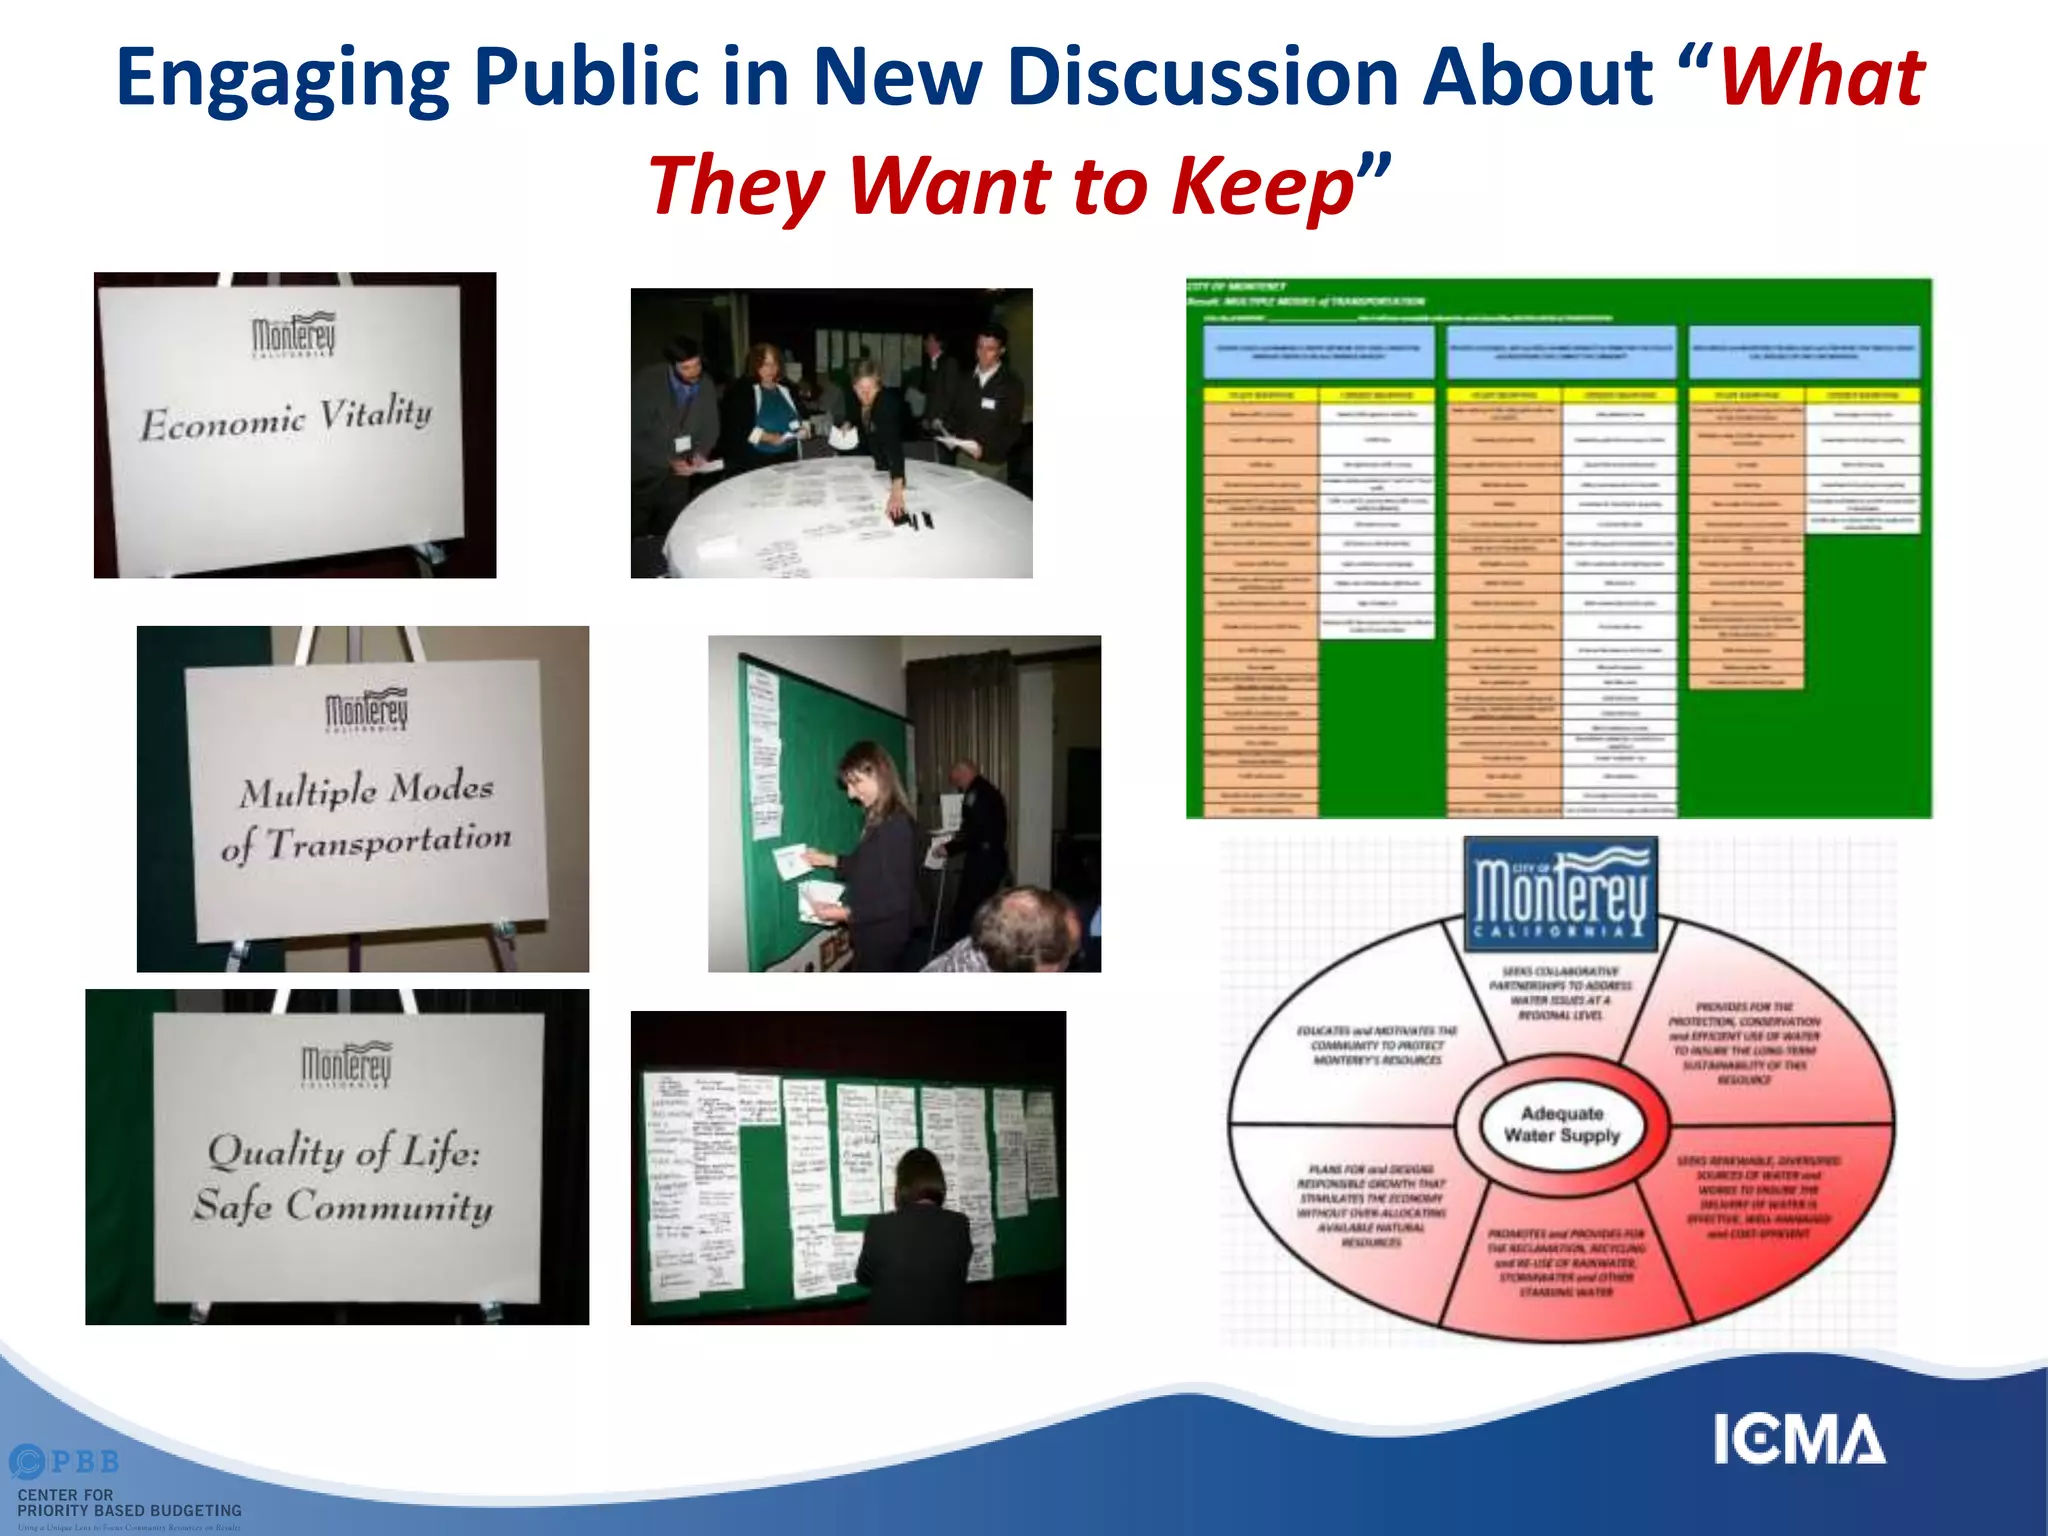
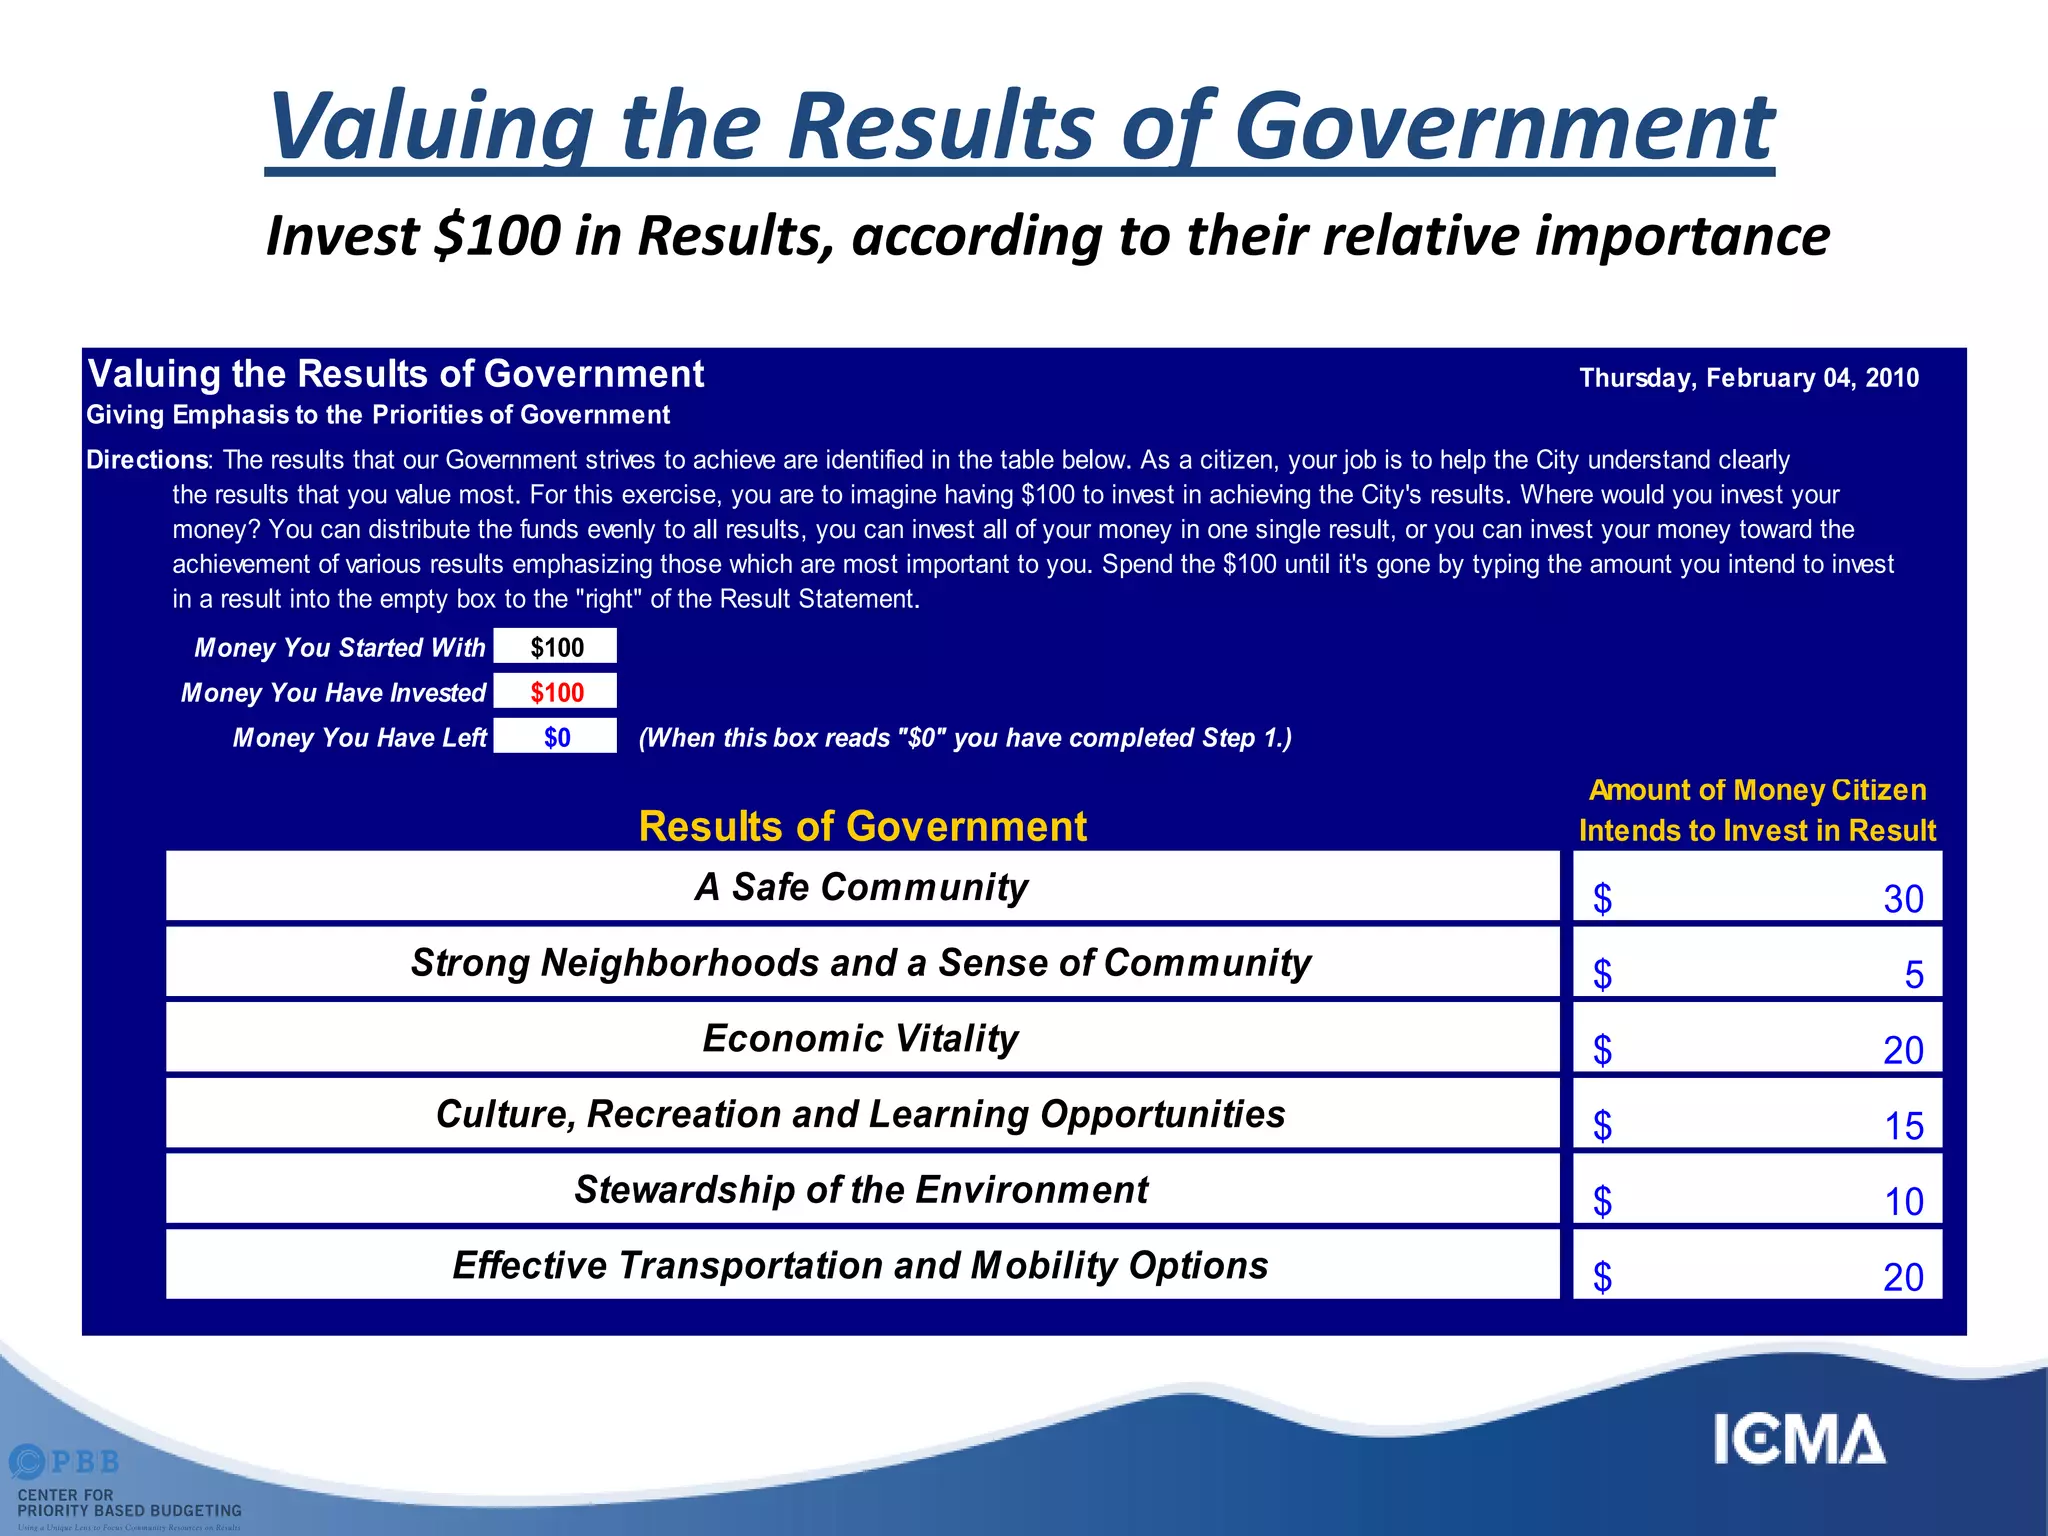
Jon Johnson, Chris Fabian & Kathie Novak
ICMA Conference Presenters
Leading Your Organization (and Elected Officials) to
“FISCAL HEALTH and WELLNESS through
PRIORITY BASED BUDGETING - Part II
Across the Board Cuts Address
$14.5 Billion Shortfall
 California Governor’s Office: “Across-the-board approach spreads
reductions as evenly as possible so no single program gets singled
out.”
 Reaction: “the governor’s approach would be like a family
deciding to cuts its monthly mortgage payment, dining-out tab
and Netflix subscription each by 10%, rather than eliminating the
restaurant and DVD spending in order to keep up the house
payments.”
From 2007
According to Moody’s:
 Across-the-Board versus Targeted Budget Cuts
 “Across-the-board cuts can be a way to avoid tough
decisions”
 “Targeted cuts require a serious discussion of community
values, relative benefits of different services, and long-
term implications”
 Moody's wants to see how local governments plan for
and respond to financial challenges over the long
term
 “Making targeted cuts can demonstrate a more strategic
approach to managing the fiscal crisis”
“Across the board cuts spreads the pain
evenly and also evenly spreads the
mediocrity”
- Budget Director for the State of Louisiana
Fiscal
Wellness
Achieve
Fiscal Health
Value Programs
Based on Evidence
of their Influence
on Results
Support Resource
Allocation Decision
Making with Prioritization
of Programs
Identify, Define and
Value the Results
of Government
Identify Programs
and Services
ACHIEVING LONG-TERM FISCAL WELLNESS
STEPS to SUCCESS – Priority Based Budgeting
1. Determine Results
 Accurate prioritization of programs, reflecting the organization’s stated
objectives, depends on the comprehensive identification of the Results it is
in business to achieve
2. Clarify Result Definitions
 Precision in prioritization depends on the articulation of the cause and
effect relationship between a program and a Result
 Using clearly defined “Result Maps”, detailing the factors that influence the
way Results are achieved, the organization can minimize subjectivity in the
process of linking programs with its Results
3. Identify Programs and Services
 Comparing individual programs and services as opposed to comparing
departments that provide those services allows for better prioritization
4. Value Programs Based on Results
 With the right Results that are clearly defined, the organization can more
accurately “value” a program relative to its influence on achieving Results
5. Allocate Resources Based on Priorities
 Using “Resource Alignment Diagnostic Tool”
Strategic Questions
1. What are we in “business” to do?
What are “Results”
 High-level and over-arching reasons the organization
exists in the eyes of the community
 Remain consistent and unchanged over time
 Comprehensive
 Distinguished from (i.e. “Results” are not…)
 Vision or Mission Statements
 Organizational Values
 How we want to achieve our results
 “Marketing” statements
 Look and feel of the community
 Specific short-term, projects, goals or initiatives
Step 1: Determine Results
City of Grand Island, Nebraska
Quality of Life
Stewardship of the
Environment
Safe Community
Strategic, Sustainable and
Maintained Development
City of Grand Island Results
Effective, Efficient and
Sustainable
Organization
Accessible and
Transparent
Organization
Stewardship of
Resources
Community Results
• Used to Differentiate Programs Offered to the
Community
• Not All Programs Achieve these Results
• Programs that Achieve Many Results, with a
High Degree of Influence, Achieve Highly in
Prioritization (demonstrate high degree of
relevance)
Quality Service Results
• Every Program Should Achieve these Results
(though potentially, not every program does)
• Not Used to Differentiate the Relevance of
Programs in Prioritization
Governance Results
• Used to Differentiate Programs Designed to
Support Governance
Validating Results
Step 2: Clarify Result Definitions
(Result Maps)
City of Boulder, CO
Results
 Accessible &
Connected Community
 Economically Vital
Community
 Healthy Environment
& Community
 Inclusive & Socially
Thriving Community
 Safe Community
Economically Vital
Community
Fosters regional and public/
private collaborative with
key institutions and
organizations that
contribute to economic
sustainability
Provides for a quality of
life that attracts, sustains
and retains diverse
businesses and creative
entrepreneurs
Helps sustain a qualified
and diversified workforce
that meets employers’
needs and supports
broad-based economic
diversity
Invests in primary
economic generators and
businesses
Encourages sustainable
development supported by
reliable and affordable
city services
Healthy Environment
and Community
Supports and
sustains resource
conservation
Promotes and sustains a safe,
clean and attractive place to
live, work and play
Promotes environmental
stewardship in a manner
that advances community
sustainability goals
Provides for inclusive and
diverse recreational and
arts programs
Provides for multi-
generational community
enrichment and community
engagement
Defining Results
Result Mapping Exercise
Creating Result Maps
CITY OF BILLINGS,
MONTANA
Result: COMPREHENSIVE, ORDERLY
GROWTH and DEVELOPMENT
If the CITY OF BILLINGS _____________________________, then it will have successfully achieved the result of providing COMPREHENSIVE, ORDERLY GROWTH and DEVELOPMENT
Provides, maintains and
invests in a well-planned
public infrastructure
network that
accommodatesthe long-
range growth needs of the
community
Develops, preserves and
revitalizes residential
neighborhoods that are
safe, attractive and
provide diverse,
affordable housing options
Appropriately plans for the
creation,maintenance and
accessibility of open space,
parks, recreational
activities and educational
opportunities
Optimizes the City's
resources and enhances
the growth needs of the
communitythrough well-
planned infill and
annexation
Develops and prepares integrated, comprehensive
long-range zoning and land use plans that are
consistently followed and managed
Partners to plan, prepare and collaboratively invest
in properly regulated, quality and future-focused
development and redevelopment that stimulates the
local economy and is consistent with community
standards
Fix existing infrastructure before
building new
Support affordable housing
development city-wide, not just in
low income areas
Park/trails/open space creation &
maintenance
Incentivize infill development
Structured/consistent land use
regulations
Funds the planning department Following existing phase policies
Invests in downtown &
neighborhoods
Administers and prioritizes its CIP
Promote neighborhood
revitalization
Develop resources to support
park development
Continue annexation policy that
identifies areas for growth
already served by City programs
Updates & reviews as zoning/land
use regulations
Planning related to growth Developer buy-in
Blighted/run-down area
redevelopment
Fund CIP on regular basis so
infrastructure is built, repaired &
replaced
Invests in downtown &
neighborhoods
Water Park 15 minutes from every
home
Annexation plan Zoning regulations (2) Planning for development
Reviews & approves fees for
service that cover at least 75% of
that true cost of development
review
Invest in downtown
Reviews & approves the CIP
Blighted/run-down area
redevelopment
Public indoor recreation centers
Well-defined annexation
plan/map/policy
Mixed use structures and
neighborhoods
Master plan
Figure "real cost" of
developments before approving
Dangerous building abatement
Long-term arterial road plan Provides broad housing choices Parks where needed
Identify whether infill areas are
sufficient to meet future growth
needs
Good zoning
Prepare/implement
neighborhood plans
Development review boards
De-localize businesses (so that I
don't have to travel across town
to get what I want)
Infrastructure paid for by
development
Ensure affordable housing
New recreation programs for
youth
Infill policy Zoning control Future planning Developers follow the rules
Support & encourage small
business
Anticipate, plan & provide for
increased infrastructure
SUBDIVISION ZONING - INCLUDES
LOW INCOME HOUSING
A park within walking distance
from every home
Stops annexing areas not up to
City standards
Green zone
Provide for long-range planning &
annexation
Partnering with development
community
Save small businesses
Comprehensive,
Orderly Growth and
Development
Develops, preserves and revitalizes
residential neighborhoods that are
safe, attractive and provide diverse,
affordable housing options
Develops and prepares integrated,
comprehensive long-range zoning and
land use plans that are consistently
followed and managed
Partners to plan, prepare and
collaboratively invest in properly
regulated, quality and future-
focused development and
redevelopment that stimulates
the local economy and is
consistent with community
standards
Optimizes the City's resources and
enhances the growth needs of the
community through well-planned infill
and annexation
Appropriately plans for the creation,
maintenance and accessibility of open
space, parks, recreational activities
and educational opportunities
Provides, maintains and invests in a
well-planned public infrastructure
network that accommodates the long-
range growth needs of the community
Identify and Define Results
Stewardship of the
Environment
Encourages energy
conservation and
efficiency through
education, incentives and
the provision of alternative
solutions
Provides for the
renewal of the
environment through
recycling and reuse
Manages and mitigates factors
that impact environmental
quality and sustainability
Promotes and regulates
a clean, orderly and
ecologically balanced
community
Controls and abates
threats to the
environment caused by
nature
Safe
Community
Offers protection, enforces the
law and is well-prepared to
promptly and effectively
respond to emergencies and
calls for service
Provides for the protection and
sustainability of the
environment through regulatory
compliance, planning and
effective stormwater
management
Offers and supports a variety of
safe activities and facilities that
provide for the physical health
and social well-being of the
community
Provides for a safe
transportation network that is
well-maintained, accessible,
enhances traffic flow and offers
safe mobility to motorists,
cyclists and pedestrians alike
Creates a secure, well-
regulated, well-maintained
community that is healthy,
clean, well-lit and visually
attractive
Fosters a feeling of personal
safety throughout the
community by establishing a
visible, accessible presence that
proactively provides for
prevention, intervention, safety
education, and community
involvement
GOOD GOVERNANCE
(Sound Financial Entity)
ENABLES and ENHANCES
TRANSPARENCY,
ACCOUNTABILITY, INTEGRITY,
EFFICIENCY and INNOVATION
IN ALL OPERATIONS
ATTRACTS, MOTIVATES and
DEVELOPS A HIGH-QUALITY
WORKFORCE, DEDICATED TO
PUBLIC SERVICE
PROVIDES ASSURANCE OF
REGULATORY and POLICY
COMPLIANCE TO MINIMIZE
and MITIGATE RISK
SUPPORTS DECISION-
MAKING WITH TIMELY and
ACCURATE SHORT-TERM and
LONG-RANGE ANALYSIS
RESPONSIVE, ACCESSIBLE and
COURTEOUS TO ITS
CUSTOMERS
PROTECTS and PRUDENTLY
MANAGES ITS FINANCIAL,
HUMAN, PHYSICAL and
TECHNOLOGY RESOURCES
Role of the Council/Board
 Develop and/or endorse the Results
 Partner with Staff to develop and/or endorse the Results
Definitions
 Decide on the level of public engagement
Role of the Citizens
 Partner with the Council/Board to develop and/or
endorse the Results
 Partner with Council/Board and Staff to develop or
endorse the Results Definitions
Strategic Questions
1. What are we in “business” to do?
2. What exactly do we do?
 Departments develop their own
“program” inventories – only ongoing;
exclude capital & one-time
 Comprehensive list of “what we do”
 Comparing relative value of programs,
not relative value of departments
 Goldilocks & the Three Bears:
Not too big, not too small, just right!
 TOO BIG = Departments/Divisions
 TOO SMALL = Tasks
 JUST RIGHT = Measure relative size
based on costs/people associated
with program to more discretely
demonstrate how resources are
used
Step 3: Identify “Programs”
CITY OF BOULDER, COLORADO
Department Program Inventory
Fund
No.
Department Providing Program Program Name
010 Community Planning & Sustainability General Business Assistance
010 Community Planning & Sustainability Business Retention and Expansion
010 Community Planning & Sustainability Business Incentive Programs
010 Community Planning & Sustainability
Business Partnerships and
Sponsorships
140 Community Planning & Sustainability Energy Decarbonization
140 Community Planning & Sustainability Green Job Creation
140 Community Planning & Sustainability Climate Adaptation Planning
112 Community Planning & Sustainability Comprehensive Planning
112 Community Planning & Sustainability Intergovernmental Relations
112 Community Planning & Sustainability Historic Preservation
112 Community Planning & Sustainability Ecological Planning
Directions: For all of the programs and services
in your department, identify the program
name. When completed, please e-mail the
Program Inventory back to Jim Reasor
Monday, July 26, 2010
City of Boulder, Colorado
OBJECTIVES for
Developing Program Inventories
 Create a comprehensive listing of all services offered by
each operating division ( to both “external” and “internal”
users
 Provide a better understanding of “what we do” to staff,
administration, elected officials and citizens
 Provide a framework to better understand how resources
are used to support “what we do”
 Provide a valuable tool for staff, management and elected
officials to use when faced with budgetary “choices” about
how funds are distributed.
 Allow for the preparation and discussion of a “program
budget” rather than a “line-item budget”
Defining Programs
 To determine “just right”, look for “differences” that might
help determine if an activity can be defined as a “stand-alone”
program
 “Who” are you doing the activity for?
 Does it benefit a specific demographic group or population?
 “Where” are you offering the service?
 Does it impact a specific area, location or environment
 “What” are you doing the service to?
 Does it affect a specific property or asset (infrastructure, facility, etc.)
 “How” is it funded? – Is there someone paying for it?
 Are there revenue sources associated directly with the program
(“Program Revenues”)
Defining Programs
 “What” percentage of your resources are used to
provide it? - Do you need “specialized resources?
 Is the estimated annual cost of the program a significant
percentage of your total section’s budget?
 Are the number of FTE’s associated with the program a significant
portion of your total section’s staff?
 Has someone told us we “have to do it?
 Are there statutes, ordinances, resolutions, or other legislative
documents that require us to provide the service?
 What “type” of service are you providing?
 Preventative, Replacement; Repair/Maintenance; Instruction;
Protection; Informative; etc.
Defining Programs
 Is there an “End Product” as a result of doing it?
 Does the external or internal user get something tangible when the
service is delivered?
 “Is there someone outside the organization that “does
the same thing”?
 Does a private business offer a similar service (“Yellow Pages
test”)
 Do we “advertise” that we do it?
 Is there a separate phone directory or website reference to
the service?
How to
Identify Program Costs
 1) Associate Salary & Benefit Costs with your Personnel
 2) Assign Personnel to the Programs they Provide
 3) Associate Non-Personnel Costs with Programs
 4) Line item Budget is now expressed as a Program Budget!
1) Associate Salary & Benefit Costs
with your Personnel
2) Assign Personnel to the
Programs they Provide
• Estimate for a given year (this is not a time study!)
• Accuracy, not precision, is the goal
• Can’t allocate an FTE over 100% (no matter how overworked they think
they are)
3) Associate Non-Personnel Costs
with Programs
• Choose a reasonable allocation methodology:
• Divide costs by FTE (i.e. supplies line item)
• Assign costs directly to program (i.e. annual audit)
Role of the Council/Board
 Have transparent access to listing of all programs offered
along with associated costs and FTE
 Educate themselves on the variety and diversity of
programs offered
Role of the Citizens
 Have transparent access to listing of all programs offered
along with associated costs and FTE
 Be informed about the nature of the programs offered to
residents businesses and visitors
Strategic Questions
1. What are we in “business” to do?
2. What exactly do we do?
3. How do we figure out what is “core” OR What
is of the highest importance?
City of Boulder’s Results Basic Program Attributes
 Accessible & Connected
Community
 Economically Vital
Community
 Healthy Environment &
Community
 Inclusive & Socially Thriving
Community
 Safe Community
 Mandated to Provide the
Program
 Reliance on the City to Provide
the Program
 Cost Recovery of the Program
 Change in Demand for the
Program
 Portion of Community Served
by the Program
 And/or any other criteria that
is relevant to your community
Step 4: Score Programs against
Results & Attributes
Simple Scoring Scale –
“Degree” of Relevance to a Result
4 = Program has an essential or critical role in
achieving Result
3 = Program has a strong influence on
achieving Result
2 = Program has some degree of influence on
achieving Result
1 = Program has minimal (but some) influence
on achieving Result
0 = Program has no influence on achieving
Result
No Clear
Connection
“Lower Degree” of
Relevance (still a
clear connection)
“High Degree” of
Relevance
Basic Program Attributes:
Mandated to Provide Program
• Programs that are mandated by another level of government (i.e. federal, state
or county) will receive a higher score for this attribute compared to programs
that are mandated solely by the City or have no mandate whatsoever.
• The grading criterion established to score programs, on a 0 to 4 scale is as
follows:
– 4 = Program is required in writing by Federal, State or County government
legislation
– 3 = Program is required by Charter or other incorporation documents OR is
required in order to comply with regulatory agency standards
– 2 = Program is required by code, ordinance, resolution or policy OR is
required to fulfill an executed franchise or contractual agreement
– 1 = Program is recommended by a national professional organization to
meet published standards or as a best practice
– 0 = No requirement or mandate exists
Basic Program Attributes:
Reliance on City to Provide Program
• Programs for which residents, businesses and visitors can only look to the City to
obtain the service will receive a higher score for this attribute compared to
programs that may be similarly obtained from another intergovernmental agency
or a private business
• The grading criterion established to score programs, on a 0 to 4 scale is as follows:
– 4 = City is the sole provider of the service and there are no other public or
private entities that provide this type of service
– 3 = City is currently the sole provider of the service but there are other public
or private entities that could be contracted to provide the service
– 2 = Program is only offered by another governmental, non-profit or civic agency
– 1 = Program is offered by other private businesses but none are located within
the City limits
– 0 = Program is offered by other private businesses within the City limits
Basic Program Attributes:
Change in Demand for Program
• Programs demonstrating an increase in demand or utilization will receive a higher score
for this attribute compared to programs that show no growth in demand for the program.
Programs demonstrating a decrease in demand or utilization will actually receive a
negative score for this attribute.
• The grading criterion established to score programs, on a -4 to 4 scale is as follows:
– 4 = Program experiencing a SUBSTANTIAL increase in demand of 25% or more
– 3 = Program experiencing a SIGNIFICANT increase in demand of 15% to 24%
– 2 = Program experiencing a MODEST increase in demand of 5% to 14%
– 1 = Program experiencing a MINIMAL increase in demand of 1% to 4%
– 0 = Program experiencing NO change in demand
– -1 = Program experiencing a MINIMAL decrease in demand of 1% to 4%
– -2 =Program experiencing a MODEST decrease in demand of 5% to 14%
– -3 =Program experiencing a SIGNIFICANT decrease in demand of 15% to 24%
– -4 =Program experiencing a SUBSTANTIAL decrease in demand of 25% or more
Basic Program Attributes:
Cost Recovery of Program
 Programs that demonstrate the ability to “pay for themselves” through user
fees, intergovernmental grants or other user-based charges for services will
receive a higher score for this attribute compared to programs that generate
limited or no funding to cover their cost.
 The grading criterion established to score programs, on a 0 to 4 scale is as
follows:
 4 = Fees generated cover 75% to 100% of the cost to provide the program
 3 = Fees generated cover 50% to 74% of the cost to provide the program
 2 = Fees generated cover 25% to 49% of the cost to provide the program
 1 = Fees generated cover 1% to 24% of the cost to provide the program
 0 = No fees are generated that cover the cost to provide the program
Basic Program Attributes:
Portion of Community Served by Program
• Programs that benefit or serve a larger segment of the City’s residents, businesses
and/or visitors will receive a higher score for this attribute compared to programs
that benefit or serve only a small segment of these populations.
• The grading criterion established to score programs, on a 0 to 4 scale is as
follows:
– 4 = Program benefits/serves the ENTIRE community (100%)
– 3 = Program benefits/serves a SUBSTANTIAL portion of the community (at
least 75%)
– 2 = Program benefits/serves a SIGNIFICANT portion of the community (at
least 50%)
– 1 = Program benefits/serves SOME portion of the community (at least 10%)
– 0 = Program benefits/serves only a SMALL portion of the community (less
than 10%)
Identify “Value” of Program Based on their
Influence on Results
Individual Department Program Scorecard
Mandated to
Provide
Program
Cost Recovery
of Program
Change in
Demand for
Service
Reliance on
City to Provide
Service
Safe City
Prosperous
Economy
Green,
Sustainable
City
Attractive,
Vibrant
Community
Reliable,
Well-
Maintained
Infrastructur
e
0-4 Scale
(4=State/Federal
Mandate; 2=Charter;
1=Ordinance/Resolut
ion; 0=No Mandate)
0-4 Scale
based on Percentage
(4=75-100%; 3=50-
74%; 2=25-49%; 1=1-
24%)
-4 to 4 Scale ('-
4=demand
significantly
decreasing;
4=demand
significantly
increasing)'
0 to 4 Scale
(4=Only City can
provide service;
2=Only public
entities can provide
service; '0=other
entities can provide
service)'
Department Program Enter Score Below Enter Score Below Enter Score Below Enter Score Below Enter Score Below Enter Score Below Enter Score Below Enter Score Below Enter Score Below
Office of Economic
Development
Business Attraction/
Expansion Assistance
4 2 4 4 2 4 3 2 0
Office of Economic
Development
International Business
Relations/Sister City
0 1 2 2 0 2 1 1 0
Office of Economic
Development
Economic Strategy, Policy
and Analysis
1 2 4 2 0 3 3 2 0
Office of Economic
Development
Downtown Management 1 2 4 4 3 2 0 3 4
Office of Economic
Development
Arts / Festival Grants and
Assistance
1 1 3 0 1 3 1 4 1
Office of Economic
Development
K-12 Arts Education 0 0 2 0 1 2 0 4 0
Office of Economic
Development
Cultural Planning, Policy
and Initiatives / Arts
Commission
1 0 2 4 1 3 1 4 1
Office of Economic
Development
Public Art Project
Management
1 1 2 0 1 2 2 4 3
Office of Economic
Development
Public Art Master Plan
Implementation and
Interagency Coordination
1 1 3 0 1 2 1 4 2
On a scale of 0 to 4 points, 0 = program has no influence on achieving the
Result; 1 = program has some influence, though minimal; 2 = program
influences the Result; 3 = program has a strong influence on the Result; 4 =
program is essential to achieving the Results
Directions: For all the programs in your department,
please rate how these programs score in the four
Basic Attributes and they influence the City’s ability
to achieve its Priority Results. When completed,
please email the Program Scorecard back to
mariah.dabel@sanjoseca.gov
Thursday, January 28, 2010 Evaluation Criteria
Basic Program Attributes Priority Results
Strategic Questions
1. What are we in “business” to do?
2. What exactly do we do?
3. How do we figure out what is “core” OR What is of the
highest importance?
4. How do we know we are successful?
Peer Review (Quality Control) Process
Role of the Council/Board
 Offer input and/or endorse the Basic Program Attributes.
 If desired, individually participate in Peer Review process as
member of one Result Team
 Understand and evaluate the “key indicators” being used to
validate achievement of desired Results
Role of the Citizens
 Selectively participate in Peer Review process as member of
one Result Team – City of San Jose, CA
 Understand and evaluate the “key indicators” being used to
validate achievement of desired Results
Strategic Questions
1. What are we in “business” to do?
2. What exactly do we do?
3. How do we figure out what is “core” OR What
is of the highest importance?
4. How do we know we are successful?
5. How do we ask “better” questions that
lead to “better” decisions about “what
we do” and “why we do it”?
Defining Quartile Groupings
0.0 10.0 20.0 30.0 40.0 50.0 60.0 70.0 80.0
1
4
7
10
13
16
19
22
25
28
31
34
37
40
43
46
49
52
55
58
61
64
67
70
73
76
79
82
85
88
91
94
97
100
103
Total Score for Community Oriented Programs
TotalNumberofPrograms
Quartile 1
Quartile 2
Quartile 3
Quartile 4
Key:
Programs are grouped into
Quartiles (not ranked, one
versus the other)
City of Boulder, Colorado
Step 5: Allocate Resources Based on Prioritization
$85,915,772
$51,726,155
$21,505,297
$7,498,842
$- $10,000,000 $20,000,000 $30,000,000 $40,000,000 $50,000,000 $60,000,000 $70,000,000 $80,000,000 $90,000,000 $100,000,000
1
2
3
4
QuartileRanking
(Quartile1:HighestRatedPrograms;
Quartile4:LowestRatedPrograms)
Prioritization Array:Combined City-wide Programs
City of Boulder, Colorado
“Resource Alignment Diagnostic Tool”
City of Boulder, CO
Quartile Ranking Programs in Array
Qrt 1 88
Qrt 2 116
Qrt 3 1102-10%
Qrt 4 54
TOTALS 368
October 30, 2012
Community-Oriented
Programs
All Departments
Funding Source:
(Est. Budget, Gen Gov Revenue,
Program Revenues)
Total Estimated BudgetCity-wide
Prioritization Perspective:
(City-wide, Fund, Funds)
Choose Department:
(All Departments, Specific)
Program Type:
(All Programs, Governance,
Community-oriented)
$00.00%
0.00%
$0
$0
$85,915,772
$21,505,297
$51,726,155
0.00%
$0
$0
$0 $85,915,772
$51,726,155 0.00%
$0 $166,646,067 0.00% $0 $166,646,067
2012-13Proposed Budget Increase (Reduce) % Impact 2012-13Target Budget
$0
$0
2011Budget
$7,498,842
$21,505,297
$7,498,842
$85,915,772
$51,726,155
$21,505,297
$7,498,842
$- $10,000,000 $20,000,000 $30,000,000 $40,000,000 $50,000,000 $60,000,000 $70,000,000 $80,000,000 $90,000,000 $100,000,000
1
2
3
4
QuartileRanking
(Quartile1:HighestRatedPrograms;
Quartile4:LowestRatedPrograms)
Priority Based Budgeting: Spending Array Perspectives
Role of the Council/Board
 Engage in the discussions by looking through this “new lens.”
 Be guided to ask the “right” questions – focused on POLICY
rather than OPERATIONS.
 Allocated resources based on priorities of the community
 Make better decisions that you can easily communicate to your
citizens.
Role of the Citizens
 See through the “new lens” how decision-makers are more
objectively allocating resources to achieve the community’s
priorities
 Better understand the budget “choices” that need to be made
and the impacts of those choices on the community
Strategic Questions
1. What are we in “business” to do?
2. What exactly do we do?
3. How do we figure out what is “core” OR What is of the
highest importance?
4. How do we know we are successful?
5. How do we ask “better” questions that lead to “better”
decisions about “what we do” and “why we do it”?
6. What do you want to “keep” (not “What do you
want to cut”) – THE ROLE OF CITIZENS
Keys to Public Engagement
 1.) Determine objective for engaging the Public
 Is it a “Means to an End” or an “End in and of Itself”?
 2.) Design the role of the Public so it will have a
meaningful influence
 3.) Ensure higher participation – GO TO THEM
 Use the Web
 Mail enclosures with Newsletters or Utility Bills
 Attend Community Meetings (i.e. Chamber of Commerce;
Civic Groups; School Board; HOA Meetings)
 Set up kiosks at Library, Rec Center, Senior Center, etc.
Many Challenges Inherent to Engaging
Public
 Level of discussion too
“Big Picture”
 Conversation is framed
contentiously (and
possibly with “fear”)
 Unclear about “how”
citizens will be able to
participate
Engaging Public in New Discussion About “What
They Want to Keep”
Invest $100 in Results, according to their relative importance
Valuing the Results of Government
Giving Emphasis to the Priorities of Government
Directions: The results that our Government strives to achieve are identified in the table below. As a citizen, your job is to help the City understand clearly
the results that you value most. For this exercise, you are to imagine having $100 to invest in achieving the City's results. Where would you invest your
money? You can distribute the funds evenly to all results, you can invest all of your money in one single result, or you can invest your money toward the
achievement of various results emphasizing those which are most important to you. Spend the $100 until it's gone by typing the amount you intend to invest
in a result into the empty box to the "right" of the Result Statement.
Money You Started With $100
Money You Have Invested $100
Money You Have Left $0 (When this box reads "$0" you have completed Step 1.)
Strong Neighborhoods and a Sense of Community
Economic Vitality
Culture, Recreation and Learning Opportunities
Stewardship of the Environment
Effective Transportation and Mobility Options
Results of Government
5$
20$
20$
15$
10$
Thursday, February 04, 2010
Amount of Money Citizen
Intends to Invest in Result
30$A Safe Community
Thank You !
www.pbbcenter.org
Jon Johnson, Co-Founder Chris Fabian, Co-Founder
303-909-9052 (cell) 303-520-1356 (cell)
jjohnson@pbbcenter.org cfabian@pbbcenter.org
Kathie Novak, Senior Advisor
720-339-5845 (cell)
the.kathie.novak@gmail.com
Copyright ©2009 by Chris Fabian and Jon Johnson d/b/a the Center for Priority Based Budgeting,
Denver, Colorado.
Questions/Comments?
ICMA Conference 2013 - Center for Priority Based Budgeting Presentation (2/2)

ICMA Conference 2013 - Center for Priority Based Budgeting Presentation (2/2)

  • 1.
    Jon Johnson, ChrisFabian & Kathie Novak ICMA Conference Presenters Leading Your Organization (and Elected Officials) to “FISCAL HEALTH and WELLNESS through PRIORITY BASED BUDGETING - Part II
  • 3.
    Across the BoardCuts Address $14.5 Billion Shortfall  California Governor’s Office: “Across-the-board approach spreads reductions as evenly as possible so no single program gets singled out.”  Reaction: “the governor’s approach would be like a family deciding to cuts its monthly mortgage payment, dining-out tab and Netflix subscription each by 10%, rather than eliminating the restaurant and DVD spending in order to keep up the house payments.” From 2007
  • 4.
    According to Moody’s: Across-the-Board versus Targeted Budget Cuts  “Across-the-board cuts can be a way to avoid tough decisions”  “Targeted cuts require a serious discussion of community values, relative benefits of different services, and long- term implications”  Moody's wants to see how local governments plan for and respond to financial challenges over the long term  “Making targeted cuts can demonstrate a more strategic approach to managing the fiscal crisis”
  • 5.
    “Across the boardcuts spreads the pain evenly and also evenly spreads the mediocrity” - Budget Director for the State of Louisiana
  • 6.
    Fiscal Wellness Achieve Fiscal Health Value Programs Basedon Evidence of their Influence on Results Support Resource Allocation Decision Making with Prioritization of Programs Identify, Define and Value the Results of Government Identify Programs and Services ACHIEVING LONG-TERM FISCAL WELLNESS
  • 7.
    STEPS to SUCCESS– Priority Based Budgeting 1. Determine Results  Accurate prioritization of programs, reflecting the organization’s stated objectives, depends on the comprehensive identification of the Results it is in business to achieve 2. Clarify Result Definitions  Precision in prioritization depends on the articulation of the cause and effect relationship between a program and a Result  Using clearly defined “Result Maps”, detailing the factors that influence the way Results are achieved, the organization can minimize subjectivity in the process of linking programs with its Results 3. Identify Programs and Services  Comparing individual programs and services as opposed to comparing departments that provide those services allows for better prioritization 4. Value Programs Based on Results  With the right Results that are clearly defined, the organization can more accurately “value” a program relative to its influence on achieving Results 5. Allocate Resources Based on Priorities  Using “Resource Alignment Diagnostic Tool”
  • 8.
    Strategic Questions 1. Whatare we in “business” to do?
  • 9.
    What are “Results” High-level and over-arching reasons the organization exists in the eyes of the community  Remain consistent and unchanged over time  Comprehensive  Distinguished from (i.e. “Results” are not…)  Vision or Mission Statements  Organizational Values  How we want to achieve our results  “Marketing” statements  Look and feel of the community  Specific short-term, projects, goals or initiatives
  • 10.
    Step 1: DetermineResults City of Grand Island, Nebraska Quality of Life Stewardship of the Environment Safe Community Strategic, Sustainable and Maintained Development City of Grand Island Results Effective, Efficient and Sustainable Organization Accessible and Transparent Organization Stewardship of Resources Community Results • Used to Differentiate Programs Offered to the Community • Not All Programs Achieve these Results • Programs that Achieve Many Results, with a High Degree of Influence, Achieve Highly in Prioritization (demonstrate high degree of relevance) Quality Service Results • Every Program Should Achieve these Results (though potentially, not every program does) • Not Used to Differentiate the Relevance of Programs in Prioritization Governance Results • Used to Differentiate Programs Designed to Support Governance
  • 12.
  • 13.
    Step 2: ClarifyResult Definitions (Result Maps) City of Boulder, CO Results  Accessible & Connected Community  Economically Vital Community  Healthy Environment & Community  Inclusive & Socially Thriving Community  Safe Community Economically Vital Community Fosters regional and public/ private collaborative with key institutions and organizations that contribute to economic sustainability Provides for a quality of life that attracts, sustains and retains diverse businesses and creative entrepreneurs Helps sustain a qualified and diversified workforce that meets employers’ needs and supports broad-based economic diversity Invests in primary economic generators and businesses Encourages sustainable development supported by reliable and affordable city services Healthy Environment and Community Supports and sustains resource conservation Promotes and sustains a safe, clean and attractive place to live, work and play Promotes environmental stewardship in a manner that advances community sustainability goals Provides for inclusive and diverse recreational and arts programs Provides for multi- generational community enrichment and community engagement
  • 14.
  • 15.
    Creating Result Maps CITYOF BILLINGS, MONTANA Result: COMPREHENSIVE, ORDERLY GROWTH and DEVELOPMENT If the CITY OF BILLINGS _____________________________, then it will have successfully achieved the result of providing COMPREHENSIVE, ORDERLY GROWTH and DEVELOPMENT Provides, maintains and invests in a well-planned public infrastructure network that accommodatesthe long- range growth needs of the community Develops, preserves and revitalizes residential neighborhoods that are safe, attractive and provide diverse, affordable housing options Appropriately plans for the creation,maintenance and accessibility of open space, parks, recreational activities and educational opportunities Optimizes the City's resources and enhances the growth needs of the communitythrough well- planned infill and annexation Develops and prepares integrated, comprehensive long-range zoning and land use plans that are consistently followed and managed Partners to plan, prepare and collaboratively invest in properly regulated, quality and future-focused development and redevelopment that stimulates the local economy and is consistent with community standards Fix existing infrastructure before building new Support affordable housing development city-wide, not just in low income areas Park/trails/open space creation & maintenance Incentivize infill development Structured/consistent land use regulations Funds the planning department Following existing phase policies Invests in downtown & neighborhoods Administers and prioritizes its CIP Promote neighborhood revitalization Develop resources to support park development Continue annexation policy that identifies areas for growth already served by City programs Updates & reviews as zoning/land use regulations Planning related to growth Developer buy-in Blighted/run-down area redevelopment Fund CIP on regular basis so infrastructure is built, repaired & replaced Invests in downtown & neighborhoods Water Park 15 minutes from every home Annexation plan Zoning regulations (2) Planning for development Reviews & approves fees for service that cover at least 75% of that true cost of development review Invest in downtown Reviews & approves the CIP Blighted/run-down area redevelopment Public indoor recreation centers Well-defined annexation plan/map/policy Mixed use structures and neighborhoods Master plan Figure "real cost" of developments before approving Dangerous building abatement Long-term arterial road plan Provides broad housing choices Parks where needed Identify whether infill areas are sufficient to meet future growth needs Good zoning Prepare/implement neighborhood plans Development review boards De-localize businesses (so that I don't have to travel across town to get what I want) Infrastructure paid for by development Ensure affordable housing New recreation programs for youth Infill policy Zoning control Future planning Developers follow the rules Support & encourage small business Anticipate, plan & provide for increased infrastructure SUBDIVISION ZONING - INCLUDES LOW INCOME HOUSING A park within walking distance from every home Stops annexing areas not up to City standards Green zone Provide for long-range planning & annexation Partnering with development community Save small businesses Comprehensive, Orderly Growth and Development Develops, preserves and revitalizes residential neighborhoods that are safe, attractive and provide diverse, affordable housing options Develops and prepares integrated, comprehensive long-range zoning and land use plans that are consistently followed and managed Partners to plan, prepare and collaboratively invest in properly regulated, quality and future- focused development and redevelopment that stimulates the local economy and is consistent with community standards Optimizes the City's resources and enhances the growth needs of the community through well-planned infill and annexation Appropriately plans for the creation, maintenance and accessibility of open space, parks, recreational activities and educational opportunities Provides, maintains and invests in a well-planned public infrastructure network that accommodates the long- range growth needs of the community
  • 16.
    Identify and DefineResults Stewardship of the Environment Encourages energy conservation and efficiency through education, incentives and the provision of alternative solutions Provides for the renewal of the environment through recycling and reuse Manages and mitigates factors that impact environmental quality and sustainability Promotes and regulates a clean, orderly and ecologically balanced community Controls and abates threats to the environment caused by nature
  • 18.
    Safe Community Offers protection, enforcesthe law and is well-prepared to promptly and effectively respond to emergencies and calls for service Provides for the protection and sustainability of the environment through regulatory compliance, planning and effective stormwater management Offers and supports a variety of safe activities and facilities that provide for the physical health and social well-being of the community Provides for a safe transportation network that is well-maintained, accessible, enhances traffic flow and offers safe mobility to motorists, cyclists and pedestrians alike Creates a secure, well- regulated, well-maintained community that is healthy, clean, well-lit and visually attractive Fosters a feeling of personal safety throughout the community by establishing a visible, accessible presence that proactively provides for prevention, intervention, safety education, and community involvement
  • 19.
    GOOD GOVERNANCE (Sound FinancialEntity) ENABLES and ENHANCES TRANSPARENCY, ACCOUNTABILITY, INTEGRITY, EFFICIENCY and INNOVATION IN ALL OPERATIONS ATTRACTS, MOTIVATES and DEVELOPS A HIGH-QUALITY WORKFORCE, DEDICATED TO PUBLIC SERVICE PROVIDES ASSURANCE OF REGULATORY and POLICY COMPLIANCE TO MINIMIZE and MITIGATE RISK SUPPORTS DECISION- MAKING WITH TIMELY and ACCURATE SHORT-TERM and LONG-RANGE ANALYSIS RESPONSIVE, ACCESSIBLE and COURTEOUS TO ITS CUSTOMERS PROTECTS and PRUDENTLY MANAGES ITS FINANCIAL, HUMAN, PHYSICAL and TECHNOLOGY RESOURCES
  • 20.
    Role of theCouncil/Board  Develop and/or endorse the Results  Partner with Staff to develop and/or endorse the Results Definitions  Decide on the level of public engagement Role of the Citizens  Partner with the Council/Board to develop and/or endorse the Results  Partner with Council/Board and Staff to develop or endorse the Results Definitions
  • 21.
    Strategic Questions 1. Whatare we in “business” to do? 2. What exactly do we do?
  • 22.
     Departments developtheir own “program” inventories – only ongoing; exclude capital & one-time  Comprehensive list of “what we do”  Comparing relative value of programs, not relative value of departments  Goldilocks & the Three Bears: Not too big, not too small, just right!  TOO BIG = Departments/Divisions  TOO SMALL = Tasks  JUST RIGHT = Measure relative size based on costs/people associated with program to more discretely demonstrate how resources are used Step 3: Identify “Programs” CITY OF BOULDER, COLORADO Department Program Inventory Fund No. Department Providing Program Program Name 010 Community Planning & Sustainability General Business Assistance 010 Community Planning & Sustainability Business Retention and Expansion 010 Community Planning & Sustainability Business Incentive Programs 010 Community Planning & Sustainability Business Partnerships and Sponsorships 140 Community Planning & Sustainability Energy Decarbonization 140 Community Planning & Sustainability Green Job Creation 140 Community Planning & Sustainability Climate Adaptation Planning 112 Community Planning & Sustainability Comprehensive Planning 112 Community Planning & Sustainability Intergovernmental Relations 112 Community Planning & Sustainability Historic Preservation 112 Community Planning & Sustainability Ecological Planning Directions: For all of the programs and services in your department, identify the program name. When completed, please e-mail the Program Inventory back to Jim Reasor Monday, July 26, 2010 City of Boulder, Colorado
  • 23.
    OBJECTIVES for Developing ProgramInventories  Create a comprehensive listing of all services offered by each operating division ( to both “external” and “internal” users  Provide a better understanding of “what we do” to staff, administration, elected officials and citizens  Provide a framework to better understand how resources are used to support “what we do”  Provide a valuable tool for staff, management and elected officials to use when faced with budgetary “choices” about how funds are distributed.  Allow for the preparation and discussion of a “program budget” rather than a “line-item budget”
  • 24.
    Defining Programs  Todetermine “just right”, look for “differences” that might help determine if an activity can be defined as a “stand-alone” program  “Who” are you doing the activity for?  Does it benefit a specific demographic group or population?  “Where” are you offering the service?  Does it impact a specific area, location or environment  “What” are you doing the service to?  Does it affect a specific property or asset (infrastructure, facility, etc.)  “How” is it funded? – Is there someone paying for it?  Are there revenue sources associated directly with the program (“Program Revenues”)
  • 25.
    Defining Programs  “What”percentage of your resources are used to provide it? - Do you need “specialized resources?  Is the estimated annual cost of the program a significant percentage of your total section’s budget?  Are the number of FTE’s associated with the program a significant portion of your total section’s staff?  Has someone told us we “have to do it?  Are there statutes, ordinances, resolutions, or other legislative documents that require us to provide the service?  What “type” of service are you providing?  Preventative, Replacement; Repair/Maintenance; Instruction; Protection; Informative; etc.
  • 26.
    Defining Programs  Isthere an “End Product” as a result of doing it?  Does the external or internal user get something tangible when the service is delivered?  “Is there someone outside the organization that “does the same thing”?  Does a private business offer a similar service (“Yellow Pages test”)  Do we “advertise” that we do it?  Is there a separate phone directory or website reference to the service?
  • 27.
    How to Identify ProgramCosts  1) Associate Salary & Benefit Costs with your Personnel  2) Assign Personnel to the Programs they Provide  3) Associate Non-Personnel Costs with Programs  4) Line item Budget is now expressed as a Program Budget!
  • 28.
    1) Associate Salary& Benefit Costs with your Personnel
  • 29.
    2) Assign Personnelto the Programs they Provide • Estimate for a given year (this is not a time study!) • Accuracy, not precision, is the goal • Can’t allocate an FTE over 100% (no matter how overworked they think they are)
  • 30.
    3) Associate Non-PersonnelCosts with Programs • Choose a reasonable allocation methodology: • Divide costs by FTE (i.e. supplies line item) • Assign costs directly to program (i.e. annual audit)
  • 31.
    Role of theCouncil/Board  Have transparent access to listing of all programs offered along with associated costs and FTE  Educate themselves on the variety and diversity of programs offered Role of the Citizens  Have transparent access to listing of all programs offered along with associated costs and FTE  Be informed about the nature of the programs offered to residents businesses and visitors
  • 32.
    Strategic Questions 1. Whatare we in “business” to do? 2. What exactly do we do? 3. How do we figure out what is “core” OR What is of the highest importance?
  • 33.
    City of Boulder’sResults Basic Program Attributes  Accessible & Connected Community  Economically Vital Community  Healthy Environment & Community  Inclusive & Socially Thriving Community  Safe Community  Mandated to Provide the Program  Reliance on the City to Provide the Program  Cost Recovery of the Program  Change in Demand for the Program  Portion of Community Served by the Program  And/or any other criteria that is relevant to your community Step 4: Score Programs against Results & Attributes
  • 34.
    Simple Scoring Scale– “Degree” of Relevance to a Result 4 = Program has an essential or critical role in achieving Result 3 = Program has a strong influence on achieving Result 2 = Program has some degree of influence on achieving Result 1 = Program has minimal (but some) influence on achieving Result 0 = Program has no influence on achieving Result No Clear Connection “Lower Degree” of Relevance (still a clear connection) “High Degree” of Relevance
  • 35.
    Basic Program Attributes: Mandatedto Provide Program • Programs that are mandated by another level of government (i.e. federal, state or county) will receive a higher score for this attribute compared to programs that are mandated solely by the City or have no mandate whatsoever. • The grading criterion established to score programs, on a 0 to 4 scale is as follows: – 4 = Program is required in writing by Federal, State or County government legislation – 3 = Program is required by Charter or other incorporation documents OR is required in order to comply with regulatory agency standards – 2 = Program is required by code, ordinance, resolution or policy OR is required to fulfill an executed franchise or contractual agreement – 1 = Program is recommended by a national professional organization to meet published standards or as a best practice – 0 = No requirement or mandate exists
  • 36.
    Basic Program Attributes: Relianceon City to Provide Program • Programs for which residents, businesses and visitors can only look to the City to obtain the service will receive a higher score for this attribute compared to programs that may be similarly obtained from another intergovernmental agency or a private business • The grading criterion established to score programs, on a 0 to 4 scale is as follows: – 4 = City is the sole provider of the service and there are no other public or private entities that provide this type of service – 3 = City is currently the sole provider of the service but there are other public or private entities that could be contracted to provide the service – 2 = Program is only offered by another governmental, non-profit or civic agency – 1 = Program is offered by other private businesses but none are located within the City limits – 0 = Program is offered by other private businesses within the City limits
  • 37.
    Basic Program Attributes: Changein Demand for Program • Programs demonstrating an increase in demand or utilization will receive a higher score for this attribute compared to programs that show no growth in demand for the program. Programs demonstrating a decrease in demand or utilization will actually receive a negative score for this attribute. • The grading criterion established to score programs, on a -4 to 4 scale is as follows: – 4 = Program experiencing a SUBSTANTIAL increase in demand of 25% or more – 3 = Program experiencing a SIGNIFICANT increase in demand of 15% to 24% – 2 = Program experiencing a MODEST increase in demand of 5% to 14% – 1 = Program experiencing a MINIMAL increase in demand of 1% to 4% – 0 = Program experiencing NO change in demand – -1 = Program experiencing a MINIMAL decrease in demand of 1% to 4% – -2 =Program experiencing a MODEST decrease in demand of 5% to 14% – -3 =Program experiencing a SIGNIFICANT decrease in demand of 15% to 24% – -4 =Program experiencing a SUBSTANTIAL decrease in demand of 25% or more
  • 38.
    Basic Program Attributes: CostRecovery of Program  Programs that demonstrate the ability to “pay for themselves” through user fees, intergovernmental grants or other user-based charges for services will receive a higher score for this attribute compared to programs that generate limited or no funding to cover their cost.  The grading criterion established to score programs, on a 0 to 4 scale is as follows:  4 = Fees generated cover 75% to 100% of the cost to provide the program  3 = Fees generated cover 50% to 74% of the cost to provide the program  2 = Fees generated cover 25% to 49% of the cost to provide the program  1 = Fees generated cover 1% to 24% of the cost to provide the program  0 = No fees are generated that cover the cost to provide the program
  • 39.
    Basic Program Attributes: Portionof Community Served by Program • Programs that benefit or serve a larger segment of the City’s residents, businesses and/or visitors will receive a higher score for this attribute compared to programs that benefit or serve only a small segment of these populations. • The grading criterion established to score programs, on a 0 to 4 scale is as follows: – 4 = Program benefits/serves the ENTIRE community (100%) – 3 = Program benefits/serves a SUBSTANTIAL portion of the community (at least 75%) – 2 = Program benefits/serves a SIGNIFICANT portion of the community (at least 50%) – 1 = Program benefits/serves SOME portion of the community (at least 10%) – 0 = Program benefits/serves only a SMALL portion of the community (less than 10%)
  • 40.
    Identify “Value” ofProgram Based on their Influence on Results Individual Department Program Scorecard Mandated to Provide Program Cost Recovery of Program Change in Demand for Service Reliance on City to Provide Service Safe City Prosperous Economy Green, Sustainable City Attractive, Vibrant Community Reliable, Well- Maintained Infrastructur e 0-4 Scale (4=State/Federal Mandate; 2=Charter; 1=Ordinance/Resolut ion; 0=No Mandate) 0-4 Scale based on Percentage (4=75-100%; 3=50- 74%; 2=25-49%; 1=1- 24%) -4 to 4 Scale ('- 4=demand significantly decreasing; 4=demand significantly increasing)' 0 to 4 Scale (4=Only City can provide service; 2=Only public entities can provide service; '0=other entities can provide service)' Department Program Enter Score Below Enter Score Below Enter Score Below Enter Score Below Enter Score Below Enter Score Below Enter Score Below Enter Score Below Enter Score Below Office of Economic Development Business Attraction/ Expansion Assistance 4 2 4 4 2 4 3 2 0 Office of Economic Development International Business Relations/Sister City 0 1 2 2 0 2 1 1 0 Office of Economic Development Economic Strategy, Policy and Analysis 1 2 4 2 0 3 3 2 0 Office of Economic Development Downtown Management 1 2 4 4 3 2 0 3 4 Office of Economic Development Arts / Festival Grants and Assistance 1 1 3 0 1 3 1 4 1 Office of Economic Development K-12 Arts Education 0 0 2 0 1 2 0 4 0 Office of Economic Development Cultural Planning, Policy and Initiatives / Arts Commission 1 0 2 4 1 3 1 4 1 Office of Economic Development Public Art Project Management 1 1 2 0 1 2 2 4 3 Office of Economic Development Public Art Master Plan Implementation and Interagency Coordination 1 1 3 0 1 2 1 4 2 On a scale of 0 to 4 points, 0 = program has no influence on achieving the Result; 1 = program has some influence, though minimal; 2 = program influences the Result; 3 = program has a strong influence on the Result; 4 = program is essential to achieving the Results Directions: For all the programs in your department, please rate how these programs score in the four Basic Attributes and they influence the City’s ability to achieve its Priority Results. When completed, please email the Program Scorecard back to mariah.dabel@sanjoseca.gov Thursday, January 28, 2010 Evaluation Criteria Basic Program Attributes Priority Results
  • 41.
    Strategic Questions 1. Whatare we in “business” to do? 2. What exactly do we do? 3. How do we figure out what is “core” OR What is of the highest importance? 4. How do we know we are successful?
  • 42.
    Peer Review (QualityControl) Process
  • 43.
    Role of theCouncil/Board  Offer input and/or endorse the Basic Program Attributes.  If desired, individually participate in Peer Review process as member of one Result Team  Understand and evaluate the “key indicators” being used to validate achievement of desired Results Role of the Citizens  Selectively participate in Peer Review process as member of one Result Team – City of San Jose, CA  Understand and evaluate the “key indicators” being used to validate achievement of desired Results
  • 44.
    Strategic Questions 1. Whatare we in “business” to do? 2. What exactly do we do? 3. How do we figure out what is “core” OR What is of the highest importance? 4. How do we know we are successful? 5. How do we ask “better” questions that lead to “better” decisions about “what we do” and “why we do it”?
  • 45.
    Defining Quartile Groupings 0.010.0 20.0 30.0 40.0 50.0 60.0 70.0 80.0 1 4 7 10 13 16 19 22 25 28 31 34 37 40 43 46 49 52 55 58 61 64 67 70 73 76 79 82 85 88 91 94 97 100 103 Total Score for Community Oriented Programs TotalNumberofPrograms Quartile 1 Quartile 2 Quartile 3 Quartile 4 Key: Programs are grouped into Quartiles (not ranked, one versus the other) City of Boulder, Colorado
  • 46.
    Step 5: AllocateResources Based on Prioritization $85,915,772 $51,726,155 $21,505,297 $7,498,842 $- $10,000,000 $20,000,000 $30,000,000 $40,000,000 $50,000,000 $60,000,000 $70,000,000 $80,000,000 $90,000,000 $100,000,000 1 2 3 4 QuartileRanking (Quartile1:HighestRatedPrograms; Quartile4:LowestRatedPrograms) Prioritization Array:Combined City-wide Programs City of Boulder, Colorado
  • 47.
    “Resource Alignment DiagnosticTool” City of Boulder, CO Quartile Ranking Programs in Array Qrt 1 88 Qrt 2 116 Qrt 3 1102-10% Qrt 4 54 TOTALS 368 October 30, 2012 Community-Oriented Programs All Departments Funding Source: (Est. Budget, Gen Gov Revenue, Program Revenues) Total Estimated BudgetCity-wide Prioritization Perspective: (City-wide, Fund, Funds) Choose Department: (All Departments, Specific) Program Type: (All Programs, Governance, Community-oriented) $00.00% 0.00% $0 $0 $85,915,772 $21,505,297 $51,726,155 0.00% $0 $0 $0 $85,915,772 $51,726,155 0.00% $0 $166,646,067 0.00% $0 $166,646,067 2012-13Proposed Budget Increase (Reduce) % Impact 2012-13Target Budget $0 $0 2011Budget $7,498,842 $21,505,297 $7,498,842 $85,915,772 $51,726,155 $21,505,297 $7,498,842 $- $10,000,000 $20,000,000 $30,000,000 $40,000,000 $50,000,000 $60,000,000 $70,000,000 $80,000,000 $90,000,000 $100,000,000 1 2 3 4 QuartileRanking (Quartile1:HighestRatedPrograms; Quartile4:LowestRatedPrograms) Priority Based Budgeting: Spending Array Perspectives
  • 49.
    Role of theCouncil/Board  Engage in the discussions by looking through this “new lens.”  Be guided to ask the “right” questions – focused on POLICY rather than OPERATIONS.  Allocated resources based on priorities of the community  Make better decisions that you can easily communicate to your citizens. Role of the Citizens  See through the “new lens” how decision-makers are more objectively allocating resources to achieve the community’s priorities  Better understand the budget “choices” that need to be made and the impacts of those choices on the community
  • 50.
    Strategic Questions 1. Whatare we in “business” to do? 2. What exactly do we do? 3. How do we figure out what is “core” OR What is of the highest importance? 4. How do we know we are successful? 5. How do we ask “better” questions that lead to “better” decisions about “what we do” and “why we do it”? 6. What do you want to “keep” (not “What do you want to cut”) – THE ROLE OF CITIZENS
  • 51.
    Keys to PublicEngagement  1.) Determine objective for engaging the Public  Is it a “Means to an End” or an “End in and of Itself”?  2.) Design the role of the Public so it will have a meaningful influence  3.) Ensure higher participation – GO TO THEM  Use the Web  Mail enclosures with Newsletters or Utility Bills  Attend Community Meetings (i.e. Chamber of Commerce; Civic Groups; School Board; HOA Meetings)  Set up kiosks at Library, Rec Center, Senior Center, etc.
  • 52.
    Many Challenges Inherentto Engaging Public  Level of discussion too “Big Picture”  Conversation is framed contentiously (and possibly with “fear”)  Unclear about “how” citizens will be able to participate
  • 53.
    Engaging Public inNew Discussion About “What They Want to Keep”
  • 54.
    Invest $100 inResults, according to their relative importance Valuing the Results of Government Valuing the Results of Government Giving Emphasis to the Priorities of Government Directions: The results that our Government strives to achieve are identified in the table below. As a citizen, your job is to help the City understand clearly the results that you value most. For this exercise, you are to imagine having $100 to invest in achieving the City's results. Where would you invest your money? You can distribute the funds evenly to all results, you can invest all of your money in one single result, or you can invest your money toward the achievement of various results emphasizing those which are most important to you. Spend the $100 until it's gone by typing the amount you intend to invest in a result into the empty box to the "right" of the Result Statement. Money You Started With $100 Money You Have Invested $100 Money You Have Left $0 (When this box reads "$0" you have completed Step 1.) Strong Neighborhoods and a Sense of Community Economic Vitality Culture, Recreation and Learning Opportunities Stewardship of the Environment Effective Transportation and Mobility Options Results of Government 5$ 20$ 20$ 15$ 10$ Thursday, February 04, 2010 Amount of Money Citizen Intends to Invest in Result 30$A Safe Community
  • 55.
    Thank You ! www.pbbcenter.org JonJohnson, Co-Founder Chris Fabian, Co-Founder 303-909-9052 (cell) 303-520-1356 (cell) jjohnson@pbbcenter.org cfabian@pbbcenter.org Kathie Novak, Senior Advisor 720-339-5845 (cell) the.kathie.novak@gmail.com Copyright ©2009 by Chris Fabian and Jon Johnson d/b/a the Center for Priority Based Budgeting, Denver, Colorado.
  • 56.