Download as PDF, PPTX


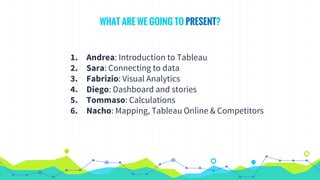
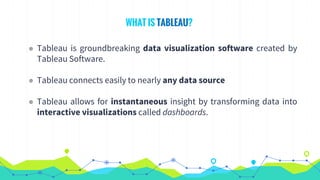
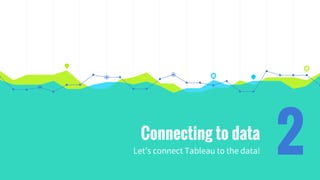
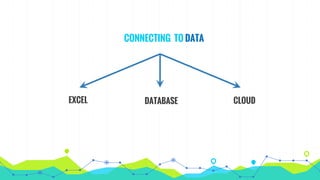
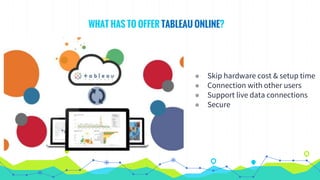

This document provides an overview of Tableau, a data visualization software. It outlines the agenda for the presentation, which will cover connecting to data, visual analytics with Tableau, dashboards and stories, calculations, and mapping capabilities. Tableau allows users to connect to various data sources, transform raw data into interactive visualizations, and share dashboards or publish them online. It is a leading tool for data analysis and visualization.


![Educatioal Tecnology[1]](https://cdn.slidesharecdn.com/ss_thumbnails/educatioaltecnology1-100120170441-phpapp02-thumbnail.jpg?width=640&height=640&fit=bounds)


![제 23회 보아즈(BOAZ) 빅데이터 컨퍼런스 - [MBOAX] : ABSA를 활용한 소비자 반응 분석 기반 운영 효율화 대시보드 설계](https://cdn.slidesharecdn.com/ss_thumbnails/3-1boaz23rdconferencemboax-260203102709-9d519923-thumbnail.jpg?width=640&height=640&fit=bounds)


