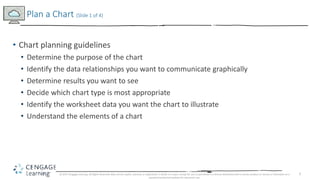
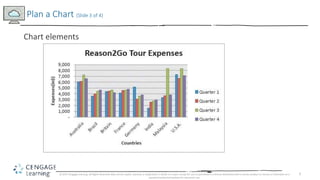
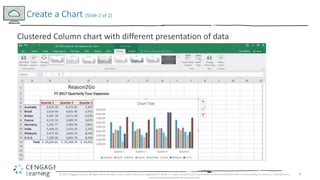
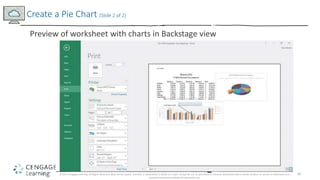
1
Excel 2016 Module 4
Working with Charts
2
• Plan a chart
• Create a chart
• Move and resize a chart
• Change the chart design
• Change the chart format
• Format a chart
• Annotate and draw on a chart
• Create a pie chart
Module Objectives
© 2017 Cengage Learning. All Rights Reserved. May not be copied, scanned, or duplicated, in whole or in part, except for use as permitted in a license distributed with a certain product or service or otherwise on a
password-protected website for classroom use.
3
• Chart planning guidelines
• Determine the purpose of the chart
• Identify the data relationships you want to communicate graphically
• Determine results you want to see
• Decide which chart type is most appropriate
• Identify the worksheet data you want the chart to illustrate
• Understand the elements of a chart
Plan a Chart (Slide 1 of 4)
© 2017 Cengage Learning. All Rights Reserved. May not be copied, scanned, or duplicated, in whole or in part, except for use as permitted in a license distributed with a certain product or service or otherwise on a
password-protected website for classroom use.
4
• Chart elements
• The horizontal axis (x-axis) is also called the category axis
• The vertical axis (y-axis) is also called the value axis
• The z-axis is present in 3-D charts
• Area inside the horizontal and vertical axes is called the plot area
• The scale of measure on the y-axis is identified by tick marks
• A legend makes it easy to identify each data series
• A data point is the value in a cell you select for your chart
• A data marker visually represents each data point in the chart
• A group of related data points is a data series
Plan a Chart (Slide 2 of 4)
© 2017 Cengage Learning. All Rights Reserved. May not be copied, scanned, or duplicated, in whole or in part, except for use as permitted in a license distributed with a certain product or service or otherwise on a
password-protected website for classroom use.
5
Plan a Chart (Slide 3 of 4)
© 2017 Cengage Learning. All Rights Reserved. May not be copied, scanned, or duplicated, in whole or in part, except for use as permitted in a license distributed with a certain product or service or otherwise on a
password-protected website for classroom use.
Chart elements
6
Plan a Chart (Slide 4 of 4)
© 2017 Cengage Learning. All Rights Reserved. May not be copied, scanned, or duplicated, in whole or in part, except for use as permitted in a license distributed with a certain product or service or otherwise on a
password-protected website for classroom use.
Common chart types
7
• To create a chart:
• Select a range of data
• Use buttons on the Insert tab of the Ribbon to create and modify a chart
• Sizing handles indicate that the chart is selected
• An embedded chart is one that is inserted directly in the current worksheet
• A chart sheet is a sheet in a workbook that contains only a chart, which is linked
to the workbook data
Create a Chart (Slide 1 of 2)
© 2017 Cengage Learning. All Rights Reserved. May not be copied, scanned, or duplicated, in whole or in part, except for use as permitted in a license distributed with a certain product or service or otherwise on a
password-protected website for classroom use.
8
Create a Chart (Slide 2 of 2)
© 2017 Cengage Learning. All Rights Reserved. May not be copied, scanned, or duplicated, in whole or in part, except for use as permitted in a license distributed with a certain product or service or otherwise on a
password-protected website for classroom use.
Clustered Column chart with different presentation of data
9
• An object is an independent element on a worksheet
• Moving a chart object does not affect formulas or data
• Resize a chart by dragging its sizing handles;
• Move a chart by dragging the chart itself
Move and Resize a Chart (Slide 1 of 2)
© 2017 Cengage Learning. All Rights Reserved. May not be copied, scanned, or duplicated, in whole or in part, except for use as permitted in a license distributed with a certain product or service or otherwise on a
password-protected website for classroom use.
10
Move and Resize a Chart (Slide 2 of 2)
© 2017 Cengage Learning. All Rights Reserved. May not be copied, scanned, or duplicated, in whole or in part, except for use as permitted in a license distributed with a certain product or service or otherwise on a
password-protected website for classroom use.
Moved and resized chart
11
• Changing data values in the worksheet automatically updates the chart
• Chart Tools tabs can be used to make specific changes in a chart
• Using the Chart Tools Design tab, you can:
• Change the chart type
• Modify the data range and configuration
• Change the layout of objects
• Choose from coordinating color schemes
• Move the location of the chart
Change the Chart Design (Slide 1 of 2)
© 2017 Cengage Learning. All Rights Reserved. May not be copied, scanned, or duplicated, in whole or in part, except for use as permitted in a license distributed with a certain product or service or otherwise on a
password-protected website for classroom use.
12
Change the Chart Design (Slide 2 of 2)
© 2017 Cengage Learning. All Rights Reserved. May not be copied, scanned, or duplicated, in whole or in part, except for use as permitted in a license distributed with a certain product or service or otherwise on a
password-protected website for classroom use.
Change Chart Type dialog box
13
• Chart Elements button makes it easy to add, remove, and modify chart objects
• Using options on this shortcut menu:
• Add text to a chart
• Add and modify labels
• Change the display of axes
Change the Chart Format (Slide 1 of 2)
© 2017 Cengage Learning. All Rights Reserved. May not be copied, scanned, or duplicated, in whole or in part, except for use as permitted in a license distributed with a certain product or service or otherwise on a
password-protected website for classroom use.
14
Change the Chart Format (Slide 2 of 2)
© 2017 Cengage Learning. All Rights Reserved. May not be copied, scanned, or duplicated, in whole or in part, except for use as permitted in a license distributed with a certain product or service or otherwise on a
password-protected website for classroom use.
Enhanced Chart
15
• Chart Tools Format tab can be used to make formatting enhancements
• Change colors in a specific data series
• Apply a style to a series using the Shape Styles group
Format a Chart (Slide 1 of 2)
© 2017 Cengage Learning. All Rights Reserved. May not be copied, scanned, or duplicated, in whole or in part, except for use as permitted in a license distributed with a certain product or service or otherwise on a
password-protected website for classroom use.
16
Format a Chart (Slide 1 of 2)
© 2017 Cengage Learning. All Rights Reserved. May not be copied, scanned, or duplicated, in whole or in part, except for use as permitted in a license distributed with a certain product or service or otherwise on a
password-protected website for classroom use.
Live Preview of new style applied to data series
17
• A text annotation is a label that you add to a chart to further describe data
• You can add shapes such as arrows and boxes to a chart
• Lines and arrows can be used to point out exact locations you want to emphasize
Annotate and Draw on a Chart (Slide 1 or 2)
© 2017 Cengage Learning. All Rights Reserved. May not be copied, scanned, or duplicated, in whole or in part, except for use as permitted in a license distributed with a certain product or service or otherwise on a
password-protected website for classroom use.
18
Annotate and Draw on a Chart (Slide 2 or 2)
© 2017 Cengage Learning. All Rights Reserved. May not be copied, scanned, or duplicated, in whole or in part, except for use as permitted in a license distributed with a certain product or service or otherwise on a
password-protected website for classroom use.
Text annotation and arrow shape added to chart
19
• You can create multiple charts based on the same worksheet data
• Different chart types can be better at emphasizing different parts of the data
• In a pie chart, emphasize a data point by exploding, or pulling that slice away
from the pie chart
Create a Pie Chart (Slide 1 of 2)
© 2017 Cengage Learning. All Rights Reserved. May not be copied, scanned, or duplicated, in whole or in part, except for use as permitted in a license distributed with a certain product or service or otherwise on a
password-protected website for classroom use.
20
Create a Pie Chart (Slide 2 of 2)
© 2017 Cengage Learning. All Rights Reserved. May not be copied, scanned, or duplicated, in whole or in part, except for use as permitted in a license distributed with a certain product or service or otherwise on a
password-protected website for classroom use.
Preview of worksheet with charts in Backstage view

Excel module 4 ppt presentation

  • 1.
    1 Excel 2016 Module4 Working with Charts
  • 2.
    2 • Plan achart • Create a chart • Move and resize a chart • Change the chart design • Change the chart format • Format a chart • Annotate and draw on a chart • Create a pie chart Module Objectives © 2017 Cengage Learning. All Rights Reserved. May not be copied, scanned, or duplicated, in whole or in part, except for use as permitted in a license distributed with a certain product or service or otherwise on a password-protected website for classroom use.
  • 3.
    3 • Chart planningguidelines • Determine the purpose of the chart • Identify the data relationships you want to communicate graphically • Determine results you want to see • Decide which chart type is most appropriate • Identify the worksheet data you want the chart to illustrate • Understand the elements of a chart Plan a Chart (Slide 1 of 4) © 2017 Cengage Learning. All Rights Reserved. May not be copied, scanned, or duplicated, in whole or in part, except for use as permitted in a license distributed with a certain product or service or otherwise on a password-protected website for classroom use.
  • 4.
    4 • Chart elements •The horizontal axis (x-axis) is also called the category axis • The vertical axis (y-axis) is also called the value axis • The z-axis is present in 3-D charts • Area inside the horizontal and vertical axes is called the plot area • The scale of measure on the y-axis is identified by tick marks • A legend makes it easy to identify each data series • A data point is the value in a cell you select for your chart • A data marker visually represents each data point in the chart • A group of related data points is a data series Plan a Chart (Slide 2 of 4) © 2017 Cengage Learning. All Rights Reserved. May not be copied, scanned, or duplicated, in whole or in part, except for use as permitted in a license distributed with a certain product or service or otherwise on a password-protected website for classroom use.
  • 5.
    5 Plan a Chart(Slide 3 of 4) © 2017 Cengage Learning. All Rights Reserved. May not be copied, scanned, or duplicated, in whole or in part, except for use as permitted in a license distributed with a certain product or service or otherwise on a password-protected website for classroom use. Chart elements
  • 6.
    6 Plan a Chart(Slide 4 of 4) © 2017 Cengage Learning. All Rights Reserved. May not be copied, scanned, or duplicated, in whole or in part, except for use as permitted in a license distributed with a certain product or service or otherwise on a password-protected website for classroom use. Common chart types
  • 7.
    7 • To createa chart: • Select a range of data • Use buttons on the Insert tab of the Ribbon to create and modify a chart • Sizing handles indicate that the chart is selected • An embedded chart is one that is inserted directly in the current worksheet • A chart sheet is a sheet in a workbook that contains only a chart, which is linked to the workbook data Create a Chart (Slide 1 of 2) © 2017 Cengage Learning. All Rights Reserved. May not be copied, scanned, or duplicated, in whole or in part, except for use as permitted in a license distributed with a certain product or service or otherwise on a password-protected website for classroom use.
  • 8.
    8 Create a Chart(Slide 2 of 2) © 2017 Cengage Learning. All Rights Reserved. May not be copied, scanned, or duplicated, in whole or in part, except for use as permitted in a license distributed with a certain product or service or otherwise on a password-protected website for classroom use. Clustered Column chart with different presentation of data
  • 9.
    9 • An objectis an independent element on a worksheet • Moving a chart object does not affect formulas or data • Resize a chart by dragging its sizing handles; • Move a chart by dragging the chart itself Move and Resize a Chart (Slide 1 of 2) © 2017 Cengage Learning. All Rights Reserved. May not be copied, scanned, or duplicated, in whole or in part, except for use as permitted in a license distributed with a certain product or service or otherwise on a password-protected website for classroom use.
  • 10.
    10 Move and Resizea Chart (Slide 2 of 2) © 2017 Cengage Learning. All Rights Reserved. May not be copied, scanned, or duplicated, in whole or in part, except for use as permitted in a license distributed with a certain product or service or otherwise on a password-protected website for classroom use. Moved and resized chart
  • 11.
    11 • Changing datavalues in the worksheet automatically updates the chart • Chart Tools tabs can be used to make specific changes in a chart • Using the Chart Tools Design tab, you can: • Change the chart type • Modify the data range and configuration • Change the layout of objects • Choose from coordinating color schemes • Move the location of the chart Change the Chart Design (Slide 1 of 2) © 2017 Cengage Learning. All Rights Reserved. May not be copied, scanned, or duplicated, in whole or in part, except for use as permitted in a license distributed with a certain product or service or otherwise on a password-protected website for classroom use.
  • 12.
    12 Change the ChartDesign (Slide 2 of 2) © 2017 Cengage Learning. All Rights Reserved. May not be copied, scanned, or duplicated, in whole or in part, except for use as permitted in a license distributed with a certain product or service or otherwise on a password-protected website for classroom use. Change Chart Type dialog box
  • 13.
    13 • Chart Elementsbutton makes it easy to add, remove, and modify chart objects • Using options on this shortcut menu: • Add text to a chart • Add and modify labels • Change the display of axes Change the Chart Format (Slide 1 of 2) © 2017 Cengage Learning. All Rights Reserved. May not be copied, scanned, or duplicated, in whole or in part, except for use as permitted in a license distributed with a certain product or service or otherwise on a password-protected website for classroom use.
  • 14.
    14 Change the ChartFormat (Slide 2 of 2) © 2017 Cengage Learning. All Rights Reserved. May not be copied, scanned, or duplicated, in whole or in part, except for use as permitted in a license distributed with a certain product or service or otherwise on a password-protected website for classroom use. Enhanced Chart
  • 15.
    15 • Chart ToolsFormat tab can be used to make formatting enhancements • Change colors in a specific data series • Apply a style to a series using the Shape Styles group Format a Chart (Slide 1 of 2) © 2017 Cengage Learning. All Rights Reserved. May not be copied, scanned, or duplicated, in whole or in part, except for use as permitted in a license distributed with a certain product or service or otherwise on a password-protected website for classroom use.
  • 16.
    16 Format a Chart(Slide 1 of 2) © 2017 Cengage Learning. All Rights Reserved. May not be copied, scanned, or duplicated, in whole or in part, except for use as permitted in a license distributed with a certain product or service or otherwise on a password-protected website for classroom use. Live Preview of new style applied to data series
  • 17.
    17 • A textannotation is a label that you add to a chart to further describe data • You can add shapes such as arrows and boxes to a chart • Lines and arrows can be used to point out exact locations you want to emphasize Annotate and Draw on a Chart (Slide 1 or 2) © 2017 Cengage Learning. All Rights Reserved. May not be copied, scanned, or duplicated, in whole or in part, except for use as permitted in a license distributed with a certain product or service or otherwise on a password-protected website for classroom use.
  • 18.
    18 Annotate and Drawon a Chart (Slide 2 or 2) © 2017 Cengage Learning. All Rights Reserved. May not be copied, scanned, or duplicated, in whole or in part, except for use as permitted in a license distributed with a certain product or service or otherwise on a password-protected website for classroom use. Text annotation and arrow shape added to chart
  • 19.
    19 • You cancreate multiple charts based on the same worksheet data • Different chart types can be better at emphasizing different parts of the data • In a pie chart, emphasize a data point by exploding, or pulling that slice away from the pie chart Create a Pie Chart (Slide 1 of 2) © 2017 Cengage Learning. All Rights Reserved. May not be copied, scanned, or duplicated, in whole or in part, except for use as permitted in a license distributed with a certain product or service or otherwise on a password-protected website for classroom use.
  • 20.
    20 Create a PieChart (Slide 2 of 2) © 2017 Cengage Learning. All Rights Reserved. May not be copied, scanned, or duplicated, in whole or in part, except for use as permitted in a license distributed with a certain product or service or otherwise on a password-protected website for classroom use. Preview of worksheet with charts in Backstage view