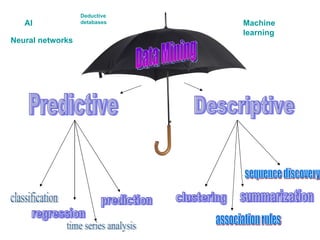
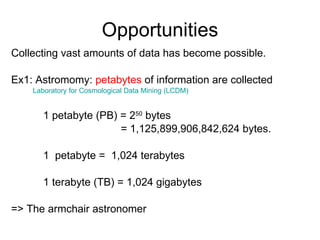
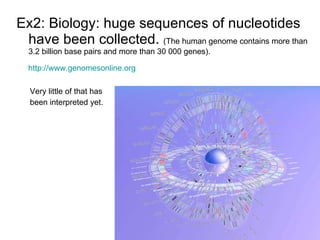
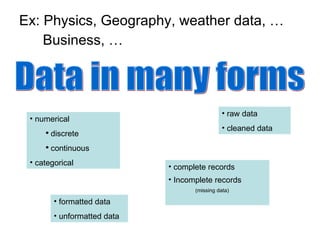
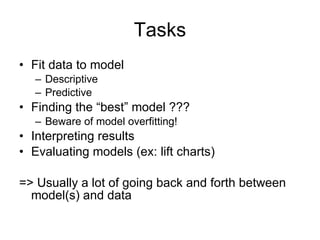
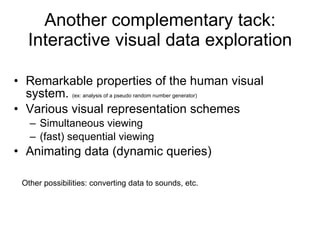
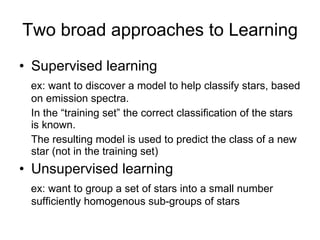
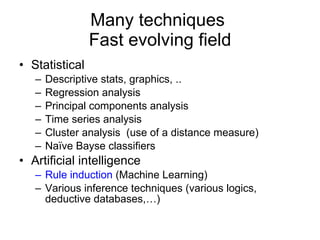
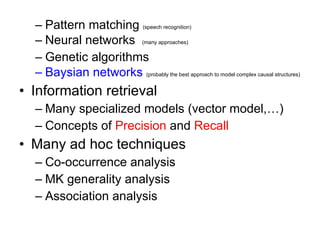
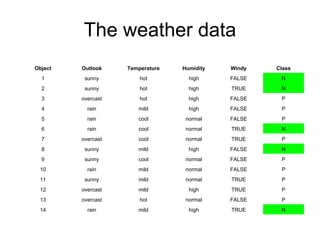
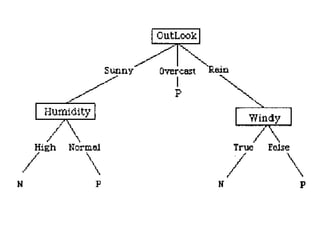
Data Mining Predictive Descriptive classification regression time series analysis prediction clustering association rules summarization sequence discovery AI Machine learning Neural networks Deductive detabases
Detecting regularities in data  (bird flue cases) Detecting rare occurrences, rare events Finding “causal” relationships Discovering useful information  in large  data sets
Opportunities Collecting vast amounts of data has become possible.  Ex1: Astromomy:  petabytes  of information are collected  Laboratory for Cosmological Data Mining (LCDM)  1 petabyte (PB) = 2 50  bytes    = 1,125,899,906,842,624 bytes.  1  petabyte =  1,024 terabytes 1 terabyte (TB) = 1,024 gigabytes => The armchair astronomer
Ex2: Biology: huge sequences of nucleotides have been collected.  (The human genome contains more than 3.2 billion base pairs and more than 30 000 genes). http://www.genomesonline.org Very little of that has been interpreted yet.
Ex: Physics, Geography, weather data, … Business, … Data in many forms numerical discrete continuous categorical raw data cleaned data complete records Incomplete records  (missing data) formatted data unformatted data
Tasks Fit data to model Descriptive Predictive Finding the “best” model ??? Beware of model overfitting! Interpreting results Evaluating models (ex: lift charts) => Usually a lot of going back and forth between model(s) and data
Another complementary tack: Interactive visual data exploration Remarkable properties of the human visual system.  (ex: analysis of a pseudo random number generator) Various visual representation schemes Simultaneous viewing (fast) sequential viewing Animating data (dynamic queries) Other possibilities: converting data to sounds, etc.
Two broad approaches to Learning Supervised learning ex: want to discover a model to help classify stars, based on emission spectra. In the “training set” the correct classification of the stars is known. The resulting model is used to predict the class of a new star (not in the training set) Unsupervised learning ex: want to group a set of stars into a small number sufficiently homogenous sub-groups of stars
Many techniques  Fast evolving field Statistical Descriptive stats, graphics, .. Regression analysis Principal components analysis Time series analysis Cluster analysis  (use of a distance measure) Naïve Bayse classifiers Artificial intelligence Rule induction  (Machine Learning) Various inference techniques (various logics, deductive databases,…)
Pattern matching  (speech recognition) Neural networks  (many approaches) Genetic algorithms Baysian networks   (probably the best approach to model complex causal structures) Information retrieval Many specialized models (vector model,…) Concepts of  Precision  and  Recall Many ad hoc techniques Co-occurrence analysis MK generality analysis Association analysis
One famous technique Ross Quinlan’s ID3 algorithm
The weather data N TRUE high mild rain 14 P FALSE normal hot overcast 13 P TRUE high mild overcast 12 P TRUE normal mild sunny 11 P FALSE normal mild rain 10 P FALSE normal cool sunny 9 N FALSE high mild sunny 8 P TRUE normal cool overcast 7 N TRUE normal cool rain 6 P FALSE normal cool rain 5 P FALSE high mild rain 4 P FALSE high hot overcast 3 N TRUE high hot sunny 2 N FALSE high hot sunny 1 Class Windy Humidity Temperature Outlook Object
 
From decision trees to rules  Reading rules from a tree Unambiguous  Rule order not counting Alternative rules for the same conclusion are ORed But too complex rules
Rules can be much more compact than trees Ex: if x=1 and y = 1 then class=a if z=1and w=1 then class=a Otherwise class=b
From rules to decision trees Rule disjunction result in too complex trees. Ex: write as a tree If a and b then x If c and d then x  ( Fig. 3.2 ) (replicated sub-tree problem) Ex : tree and rules of equivalent complexity Ex: tree much more complex than rules
To learn from examples, the examples must be rich enough Ex: sister-of relation ( fig 2-1 ) Denormalization ( fig 2-3 ) Importance of data preparation
Attributes An attribute may be irrelevant in a given context (ex: number of wheels for a ship in a database of transportation vehicles => Create value “irrelevant”
Software tools Many commercial software CART  ( http://www.salford-systems.com/landing.php ) SPSS modules WEKA  (free)  ( http://www.cs.waikato.ac.nz/~ml/weka/ ) For a larger list:   http:// www.kdnuggets.com/software/suites.html Many field specific software In the context of GRID computing  Demonstrating WEKA
Ad hoc methods Co-occurrence analysis MK  generality analysis
Term Co-occurrence Analysis The following approach measures the strength of association between a term i and a term j of the set of documents by: e(i,j) 2  =  (C ij ) 2 /(C i   * C j ) Where: Ci : is the number of documents indexed by term i Cj : is the number of documents indexed by term j Cij : is the number of documents indexed both by terms i and j
 
Interactive Data Visualization Fish eye views Hyperbolic trees Linear Visual data sequences Dynamic queries
 
Tree Maps Financial Data   http://www.smartmoney.com/marketmap/
Conclusion Current state of the art  (Graphic Models – Markov networks) Still an art Ethical issues
Baysian Networks Objective: determine probability estimates that a given sample belongs to a class Probability(x   Class | attribute values) Baysian network:  One node for each attribute Nodes connected in an acyclic graph Conditional independance
 
Learning a baysian network from data Function for evaluating a given network based on the data Function for searching through the space of possible networks K1 and TAN algorithms
Baysian Networks    Graphical Models   =  Markov models    undirected edges

(Talk in Powerpoint Format)

  • 1.
    Data Mining PredictiveDescriptive classification regression time series analysis prediction clustering association rules summarization sequence discovery AI Machine learning Neural networks Deductive detabases
  • 2.
    Detecting regularities indata (bird flue cases) Detecting rare occurrences, rare events Finding “causal” relationships Discovering useful information in large data sets
  • 3.
    Opportunities Collecting vastamounts of data has become possible. Ex1: Astromomy: petabytes of information are collected Laboratory for Cosmological Data Mining (LCDM) 1 petabyte (PB) = 2 50 bytes = 1,125,899,906,842,624 bytes. 1 petabyte = 1,024 terabytes 1 terabyte (TB) = 1,024 gigabytes => The armchair astronomer
  • 4.
    Ex2: Biology: hugesequences of nucleotides have been collected. (The human genome contains more than 3.2 billion base pairs and more than 30 000 genes). http://www.genomesonline.org Very little of that has been interpreted yet.
  • 5.
    Ex: Physics, Geography,weather data, … Business, … Data in many forms numerical discrete continuous categorical raw data cleaned data complete records Incomplete records (missing data) formatted data unformatted data
  • 6.
    Tasks Fit datato model Descriptive Predictive Finding the “best” model ??? Beware of model overfitting! Interpreting results Evaluating models (ex: lift charts) => Usually a lot of going back and forth between model(s) and data
  • 7.
    Another complementary tack:Interactive visual data exploration Remarkable properties of the human visual system. (ex: analysis of a pseudo random number generator) Various visual representation schemes Simultaneous viewing (fast) sequential viewing Animating data (dynamic queries) Other possibilities: converting data to sounds, etc.
  • 8.
    Two broad approachesto Learning Supervised learning ex: want to discover a model to help classify stars, based on emission spectra. In the “training set” the correct classification of the stars is known. The resulting model is used to predict the class of a new star (not in the training set) Unsupervised learning ex: want to group a set of stars into a small number sufficiently homogenous sub-groups of stars
  • 9.
    Many techniques Fast evolving field Statistical Descriptive stats, graphics, .. Regression analysis Principal components analysis Time series analysis Cluster analysis (use of a distance measure) Naïve Bayse classifiers Artificial intelligence Rule induction (Machine Learning) Various inference techniques (various logics, deductive databases,…)
  • 10.
    Pattern matching (speech recognition) Neural networks (many approaches) Genetic algorithms Baysian networks (probably the best approach to model complex causal structures) Information retrieval Many specialized models (vector model,…) Concepts of Precision and Recall Many ad hoc techniques Co-occurrence analysis MK generality analysis Association analysis
  • 11.
    One famous techniqueRoss Quinlan’s ID3 algorithm
  • 12.
    The weather dataN TRUE high mild rain 14 P FALSE normal hot overcast 13 P TRUE high mild overcast 12 P TRUE normal mild sunny 11 P FALSE normal mild rain 10 P FALSE normal cool sunny 9 N FALSE high mild sunny 8 P TRUE normal cool overcast 7 N TRUE normal cool rain 6 P FALSE normal cool rain 5 P FALSE high mild rain 4 P FALSE high hot overcast 3 N TRUE high hot sunny 2 N FALSE high hot sunny 1 Class Windy Humidity Temperature Outlook Object
  • 13.
  • 14.
    From decision treesto rules Reading rules from a tree Unambiguous Rule order not counting Alternative rules for the same conclusion are ORed But too complex rules
  • 15.
    Rules can bemuch more compact than trees Ex: if x=1 and y = 1 then class=a if z=1and w=1 then class=a Otherwise class=b
  • 16.
    From rules todecision trees Rule disjunction result in too complex trees. Ex: write as a tree If a and b then x If c and d then x ( Fig. 3.2 ) (replicated sub-tree problem) Ex : tree and rules of equivalent complexity Ex: tree much more complex than rules
  • 17.
    To learn fromexamples, the examples must be rich enough Ex: sister-of relation ( fig 2-1 ) Denormalization ( fig 2-3 ) Importance of data preparation
  • 18.
    Attributes An attributemay be irrelevant in a given context (ex: number of wheels for a ship in a database of transportation vehicles => Create value “irrelevant”
  • 19.
    Software tools Manycommercial software CART ( http://www.salford-systems.com/landing.php ) SPSS modules WEKA (free) ( http://www.cs.waikato.ac.nz/~ml/weka/ ) For a larger list: http:// www.kdnuggets.com/software/suites.html Many field specific software In the context of GRID computing Demonstrating WEKA
  • 20.
    Ad hoc methodsCo-occurrence analysis MK generality analysis
  • 21.
    Term Co-occurrence AnalysisThe following approach measures the strength of association between a term i and a term j of the set of documents by: e(i,j) 2 = (C ij ) 2 /(C i * C j ) Where: Ci : is the number of documents indexed by term i Cj : is the number of documents indexed by term j Cij : is the number of documents indexed both by terms i and j
  • 22.
  • 23.
    Interactive Data VisualizationFish eye views Hyperbolic trees Linear Visual data sequences Dynamic queries
  • 24.
  • 25.
    Tree Maps FinancialData http://www.smartmoney.com/marketmap/
  • 26.
    Conclusion Current stateof the art (Graphic Models – Markov networks) Still an art Ethical issues
  • 27.
    Baysian Networks Objective:determine probability estimates that a given sample belongs to a class Probability(x  Class | attribute values) Baysian network: One node for each attribute Nodes connected in an acyclic graph Conditional independance
  • 28.
  • 29.
    Learning a baysiannetwork from data Function for evaluating a given network based on the data Function for searching through the space of possible networks K1 and TAN algorithms
  • 30.
    Baysian Networks   Graphical Models = Markov models undirected edges