Download to read offline
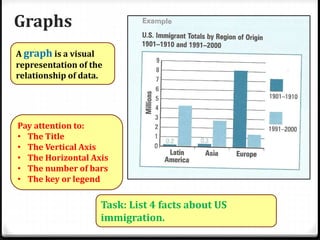
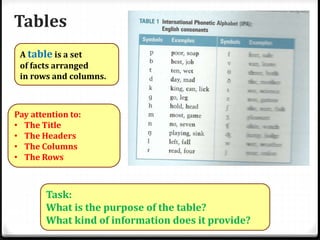
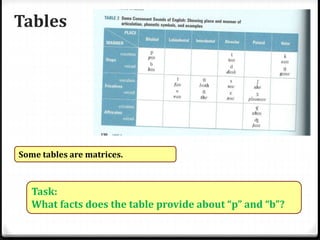
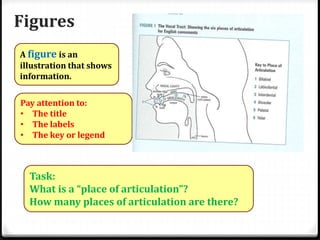
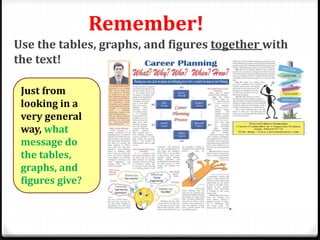
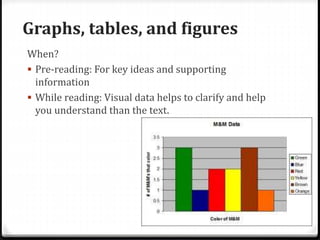

This document provides guidance on interpreting graphs, tables, and figures in documents. It discusses paying attention to titles, axes, numbers of bars, legends, headers, columns, rows, matrices, labels, keys, and using visual elements together with the text for clarification and a better understanding of the information presented. The document advises when to use graphs, tables, and figures, such as for pre-reading to gain key ideas and supporting information or while reading to help clarify and enhance understanding beyond the text.