Downloaded 16 times

![If you have any questions about Speak Up, please contact: Julie Evans Project Tomorrow [email_address] 949-609-4660 x15 Copyright Project Tomorrow 2008. This work is the intellectual property of the author. Permission is granted for this material to be shared for non-commercial, educational purposes, provided that this copyright statement appears on the reproduced materials and notice is given that the copying is by permission of the author. To disseminate otherwise or to republish requires written permission from the author.](https://image.slidesharecdn.com/fetcvirtualconferencestudentspeakupgames-090513180559-phpapp02/85/Students-Speak-Up-about-Games-2009-60-320.jpg)

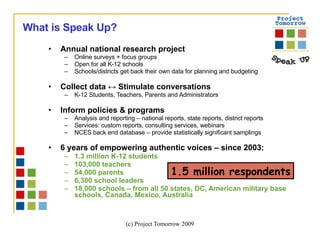
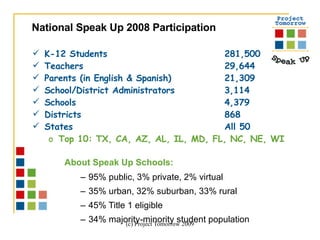
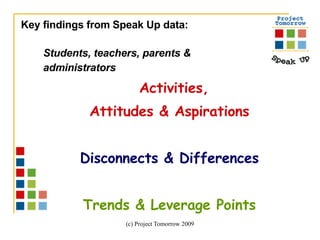
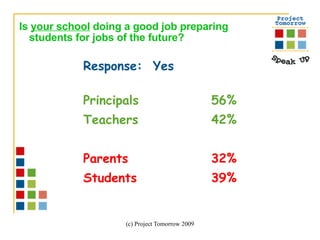
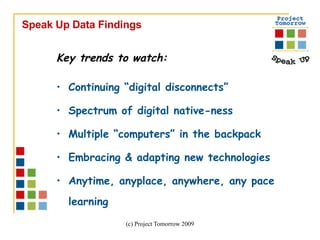
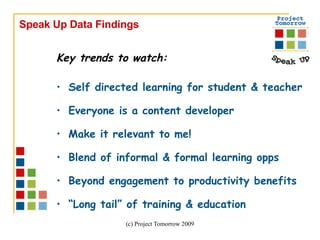
- Speak Up is an annual national research project that collects data through online surveys from K-12 students, teachers, parents, and administrators to understand perspectives on 21st century learning and education technology. - Over 1.3 million individuals from over 18,000 schools have participated in Speak Up since 2003, providing insights into technology access and use, digital skills, and preferences for teaching and learning tools. - Key findings show a "digital disconnect" between how students live and learn, with students considering themselves more advanced technology users than teachers and desiring more technology access and skills development at school.


