Download to read offline
![It has been great to learn from you today. If you have any questions, please contact us: Julie Evans Project Tomorrow [email_address] 949-609-4660 x15 Copyright Project Tomorrow 2008. This work is the intellectual property of the author. Permission is granted for this material to be shared for non-commercial, educational purposes, provided that this copyright statement appears on the reproduced materials and notice is given that the copying is by permission of the author. To disseminate otherwise or to republish requires written permission from the author.](https://image.slidesharecdn.com/cosnwebinar101508jevans-100211150308-phpapp02/85/Speak-Up-2007-National-Findings-74-320.jpg)

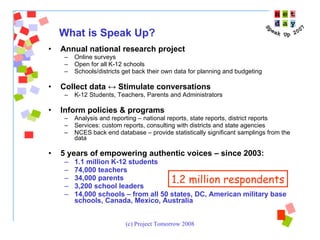
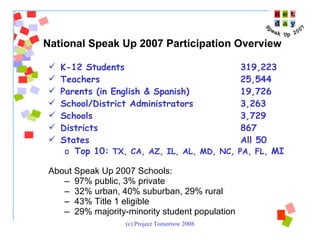
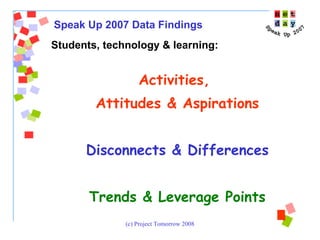
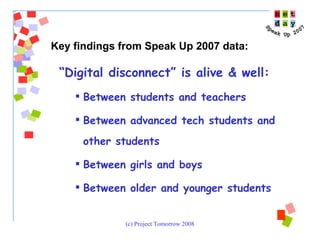
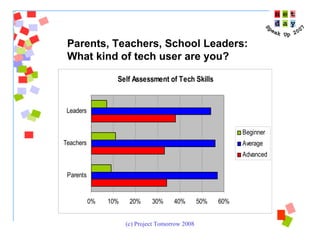
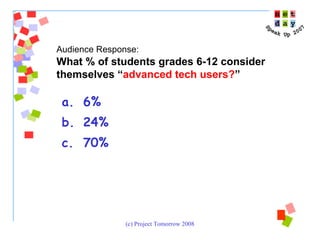
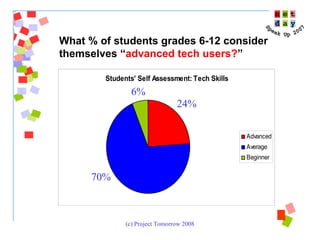
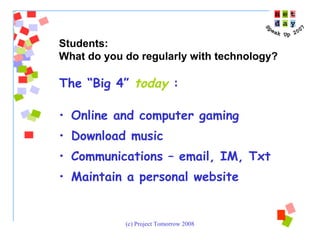
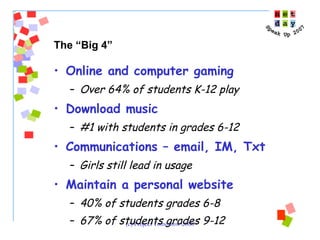
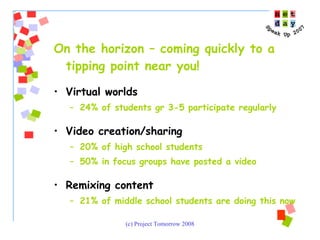
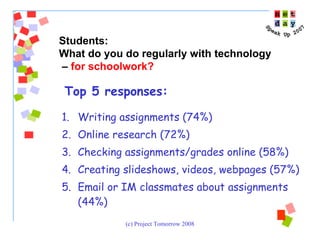
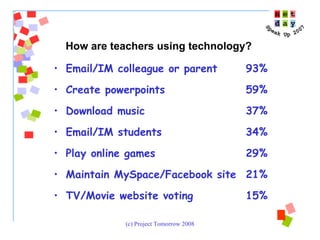
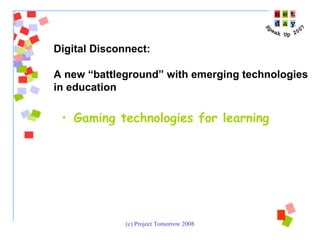
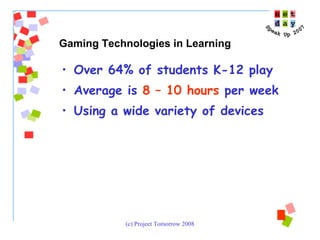
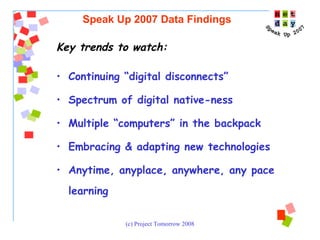
The document summarizes key findings from the 2007 Speak Up national research project, which surveyed over 1 million K-12 students, teachers, parents, and administrators about technology use in education. Some of the main points included: - A "digital disconnect" exists between how students live and learn, with students considering themselves more advanced technology users than educators. - The top activities students engage in regularly using technology are online/computer gaming, downloading music, communications, and maintaining personal websites. - Mobile devices, online learning, and gaming technologies are emerging areas that could impact learning but also face barriers to adoption. - Overall, while students, parents, and some educators see potential for technology to enhance learning,


