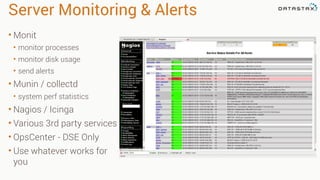
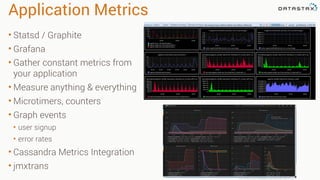
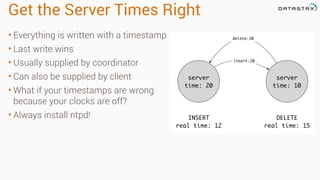
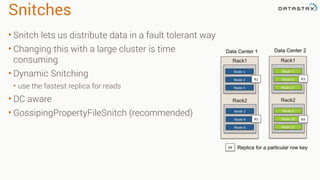
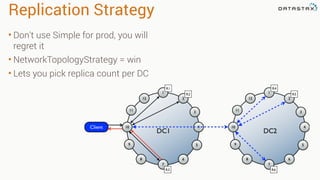
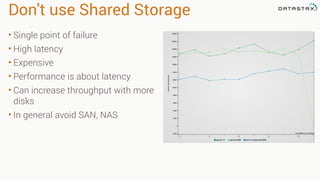
©2013 DataStax Confidential. Do not distribute without consent.
Jon Haddad, Technical Evangelist
@rustyrazorblade
Standing up your first cluster
1
First Step: Preparation
Server Monitoring & Alerts
• Monit
• monitor processes
• monitor disk usage
• send alerts
• Munin / collectd
• system perf statistics
• Nagios / Icinga
• Various 3rd party services
• OpsCenter - DSE Only
• Use whatever works for
you
Application Metrics
• Statsd / Graphite
• Grafana
• Gather constant metrics from
your application
• Measure anything & everything
• Microtimers, counters
• Graph events
• user signup
• error rates
• Cassandra Metrics Integration
• jmxtrans
Log Aggregation
• Hosted - Splunk, Loggly
• OSS - Logstash + Kibana, Greylog
• Many more…
• For best results all logs should be
aggregated here
• Oh yeah, and log your errors.
Get the Server Times Right
• Everything is written with a timestamp
• Last write wins
• Usually supplied by coordinator
• Can also be supplied by client
• What if your timestamps are wrong
because your clocks are off?
• Always install ntpd!
server
time: 10
server
time: 20
INSERT
real time: 12
DELETE
real time: 15
insert:20
delete:10
Snitches
• Snitch lets us distribute data in a fault tolerant way
• Changing this with a large cluster is time
consuming
• Dynamic Snitching
• use the fastest replica for reads
• DC aware
• GossipingPropertyFileSnitch (recommended)
Replication Strategy
• Don't use Simple for prod, you will
regret it
• NetworkTopologyStrategy = win
• Lets you pick replica count per DC
Don't use Shared Storage
• Single point of failure
• High latency
• Expensive
• Performance is about latency
• Can increase throughput with more
disks
• In general avoid SAN, NAS
Know your compaction!
• Compaction merges SSTables
• Size Tiered
• Just merge stuff, get big
• Leveled: SSD
• Read Heavy (More I/O)
• DateTiered / Timewindow
• DT included with OSS
• TW written by Jeff Jirsa
• Both written to solve Time series
• TW easier to configure
• DT more options
Utilities
nodetool tpstats
• What's blocked?
• MemtableFlushWriter? - Slow
disks!
• also leads to GC issues
• Dropped mutations?
• need repair!
Proxy Histograms
• nodetool proxyhistograms
• High level read and write times
• Includes network latency
Table Histograms
• nodetool tablehistograms <keyspace> <table>
• reports stats for single table on a single node
• Used to identify tables with performance problems
Query Tracing
JVM Garbage Collection
JVM GC Overview
• What is garbage collection?
• Manual vs automatic memory management
• Generational garbage collection (ParNew & CMS)
• New Generation
• Old Generation
New Generation
• New objects are created in the new gen (eden)
• Comprised of Eden & 2 survivor spaces (SurvivorRatio)
• Space identified by HEAP_NEWSIZE in cassandra-env.sh
• Historically limited to 800MB
Minor GC
• Occurs when Eden fills up
• Stop the world
• Dead objects are removed
• Copy current survivor to empty survivor
• Live objects are promoted into survivor (S0 & S1) then old gen
• Some survivor objects promoted to old gen (MaxTenuringThreshold)
• Spillover promoted to old gen
• Removing objects is fast, promoting objects is slow
Old Generation
• Objects are promoted to new gen from old gen
• Major GC
• Mostly concurrent
• 2 short stop the world pauses
Full GC
• Occurs when old gen fills up or
objects can’t be promoted
• Stop the world
• Collects all generations
• Defragments old gen
• These are bad!
• Massive pauses
Workload 1: Write Heavy
• Objects promoted: Memtables
• New gen too big
• Remember: promoting objects is slow!
• Huge new gen = potentially a lot of promotion
new gen old gen
too much promotion
Workload 2: Read Heavy
• Short lived objects being promoted into old gen
• Lots of minor GCs
• Read heavy workloads on SSD
• Results in frequent full GC
new gen old gen (full of short lived objects)
early promotion
fills up quickly
G1GC
• Improvement over ParNew+CMS
• Hard to tune
• CASSANDRA-8150
• G1 has more predictable pauses
• Better latency
• Many new gen, many old gen
• G1 is adaptive to usage
E SO
SO E
O S
EE
Eden Old GenS0 S1
GC Profiling
• Opscenter gc stats
• Look for correlations between gc spikes
and read/write latency
• Cassandra GC Logging
• Can be activated in cassandra-env.sh
• jstat
• prints gc activity
How much does it matter?
©2013 DataStax Confidential. Do not distribute without consent. 27

Standing Up Your First Cluster

  • 1.
    ©2013 DataStax Confidential.Do not distribute without consent. Jon Haddad, Technical Evangelist @rustyrazorblade Standing up your first cluster 1
  • 2.
  • 3.
    Server Monitoring &Alerts • Monit • monitor processes • monitor disk usage • send alerts • Munin / collectd • system perf statistics • Nagios / Icinga • Various 3rd party services • OpsCenter - DSE Only • Use whatever works for you
  • 4.
    Application Metrics • Statsd/ Graphite • Grafana • Gather constant metrics from your application • Measure anything & everything • Microtimers, counters • Graph events • user signup • error rates • Cassandra Metrics Integration • jmxtrans
  • 5.
    Log Aggregation • Hosted- Splunk, Loggly • OSS - Logstash + Kibana, Greylog • Many more… • For best results all logs should be aggregated here • Oh yeah, and log your errors.
  • 6.
    Get the ServerTimes Right • Everything is written with a timestamp • Last write wins • Usually supplied by coordinator • Can also be supplied by client • What if your timestamps are wrong because your clocks are off? • Always install ntpd! server time: 10 server time: 20 INSERT real time: 12 DELETE real time: 15 insert:20 delete:10
  • 7.
    Snitches • Snitch letsus distribute data in a fault tolerant way • Changing this with a large cluster is time consuming • Dynamic Snitching • use the fastest replica for reads • DC aware • GossipingPropertyFileSnitch (recommended)
  • 8.
    Replication Strategy • Don'tuse Simple for prod, you will regret it • NetworkTopologyStrategy = win • Lets you pick replica count per DC
  • 9.
    Don't use SharedStorage • Single point of failure • High latency • Expensive • Performance is about latency • Can increase throughput with more disks • In general avoid SAN, NAS
  • 10.
    Know your compaction! •Compaction merges SSTables • Size Tiered • Just merge stuff, get big • Leveled: SSD • Read Heavy (More I/O) • DateTiered / Timewindow • DT included with OSS • TW written by Jeff Jirsa • Both written to solve Time series • TW easier to configure • DT more options
  • 11.
  • 12.
    nodetool tpstats • What'sblocked? • MemtableFlushWriter? - Slow disks! • also leads to GC issues • Dropped mutations? • need repair!
  • 13.
    Proxy Histograms • nodetoolproxyhistograms • High level read and write times • Includes network latency
  • 14.
    Table Histograms • nodetooltablehistograms <keyspace> <table> • reports stats for single table on a single node • Used to identify tables with performance problems
  • 15.
  • 16.
  • 17.
    JVM GC Overview •What is garbage collection? • Manual vs automatic memory management • Generational garbage collection (ParNew & CMS) • New Generation • Old Generation
  • 18.
    New Generation • Newobjects are created in the new gen (eden) • Comprised of Eden & 2 survivor spaces (SurvivorRatio) • Space identified by HEAP_NEWSIZE in cassandra-env.sh • Historically limited to 800MB
  • 19.
    Minor GC • Occurswhen Eden fills up • Stop the world • Dead objects are removed • Copy current survivor to empty survivor • Live objects are promoted into survivor (S0 & S1) then old gen • Some survivor objects promoted to old gen (MaxTenuringThreshold) • Spillover promoted to old gen • Removing objects is fast, promoting objects is slow
  • 20.
    Old Generation • Objectsare promoted to new gen from old gen • Major GC • Mostly concurrent • 2 short stop the world pauses
  • 21.
    Full GC • Occurswhen old gen fills up or objects can’t be promoted • Stop the world • Collects all generations • Defragments old gen • These are bad! • Massive pauses
  • 22.
    Workload 1: WriteHeavy • Objects promoted: Memtables • New gen too big • Remember: promoting objects is slow! • Huge new gen = potentially a lot of promotion new gen old gen too much promotion
  • 23.
    Workload 2: ReadHeavy • Short lived objects being promoted into old gen • Lots of minor GCs • Read heavy workloads on SSD • Results in frequent full GC new gen old gen (full of short lived objects) early promotion fills up quickly
  • 24.
    G1GC • Improvement overParNew+CMS • Hard to tune • CASSANDRA-8150 • G1 has more predictable pauses • Better latency • Many new gen, many old gen • G1 is adaptive to usage E SO SO E O S EE Eden Old GenS0 S1
  • 25.
    GC Profiling • Opscentergc stats • Look for correlations between gc spikes and read/write latency • Cassandra GC Logging • Can be activated in cassandra-env.sh • jstat • prints gc activity
  • 26.
    How much doesit matter?
  • 27.
    ©2013 DataStax Confidential.Do not distribute without consent. 27