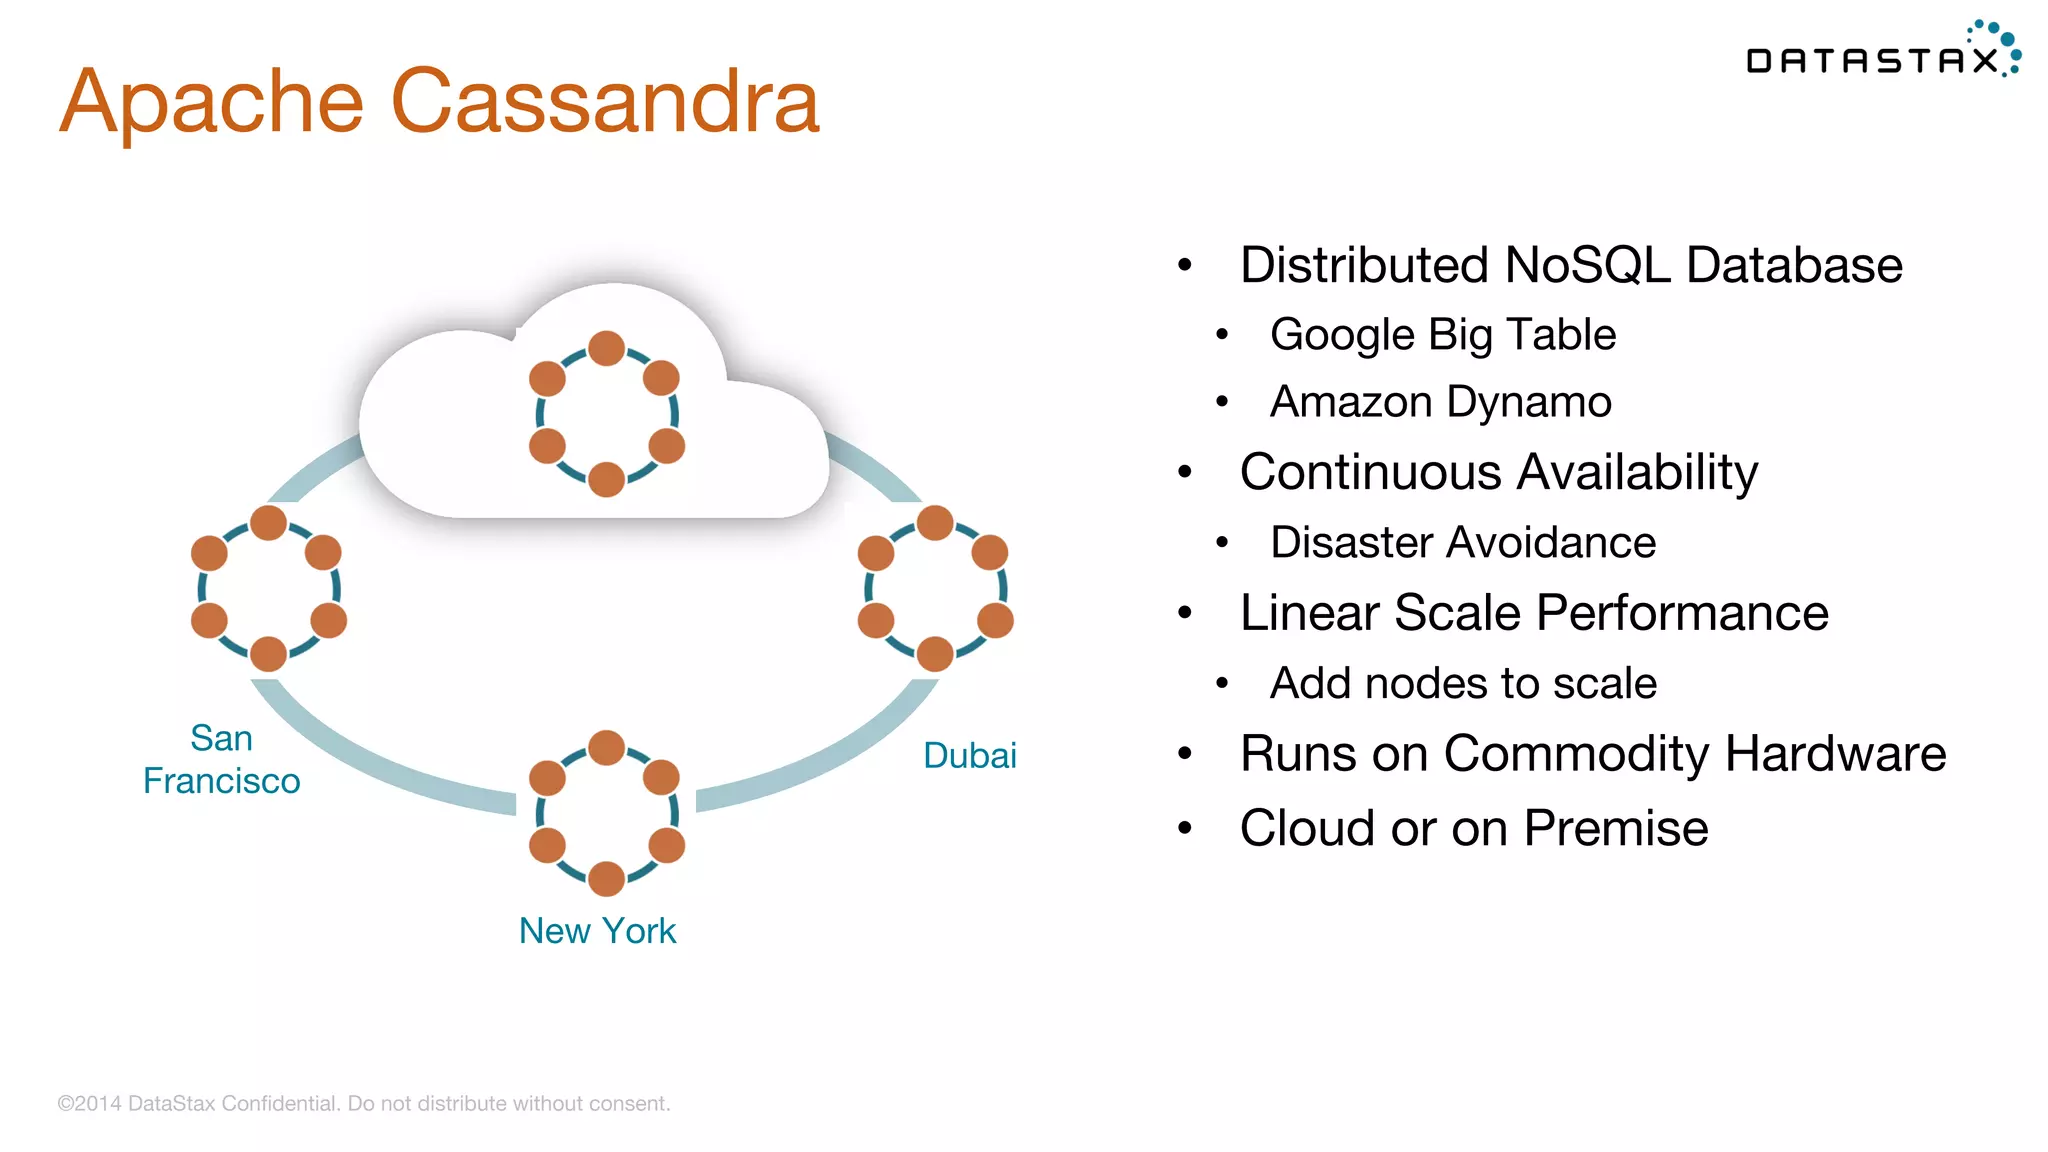
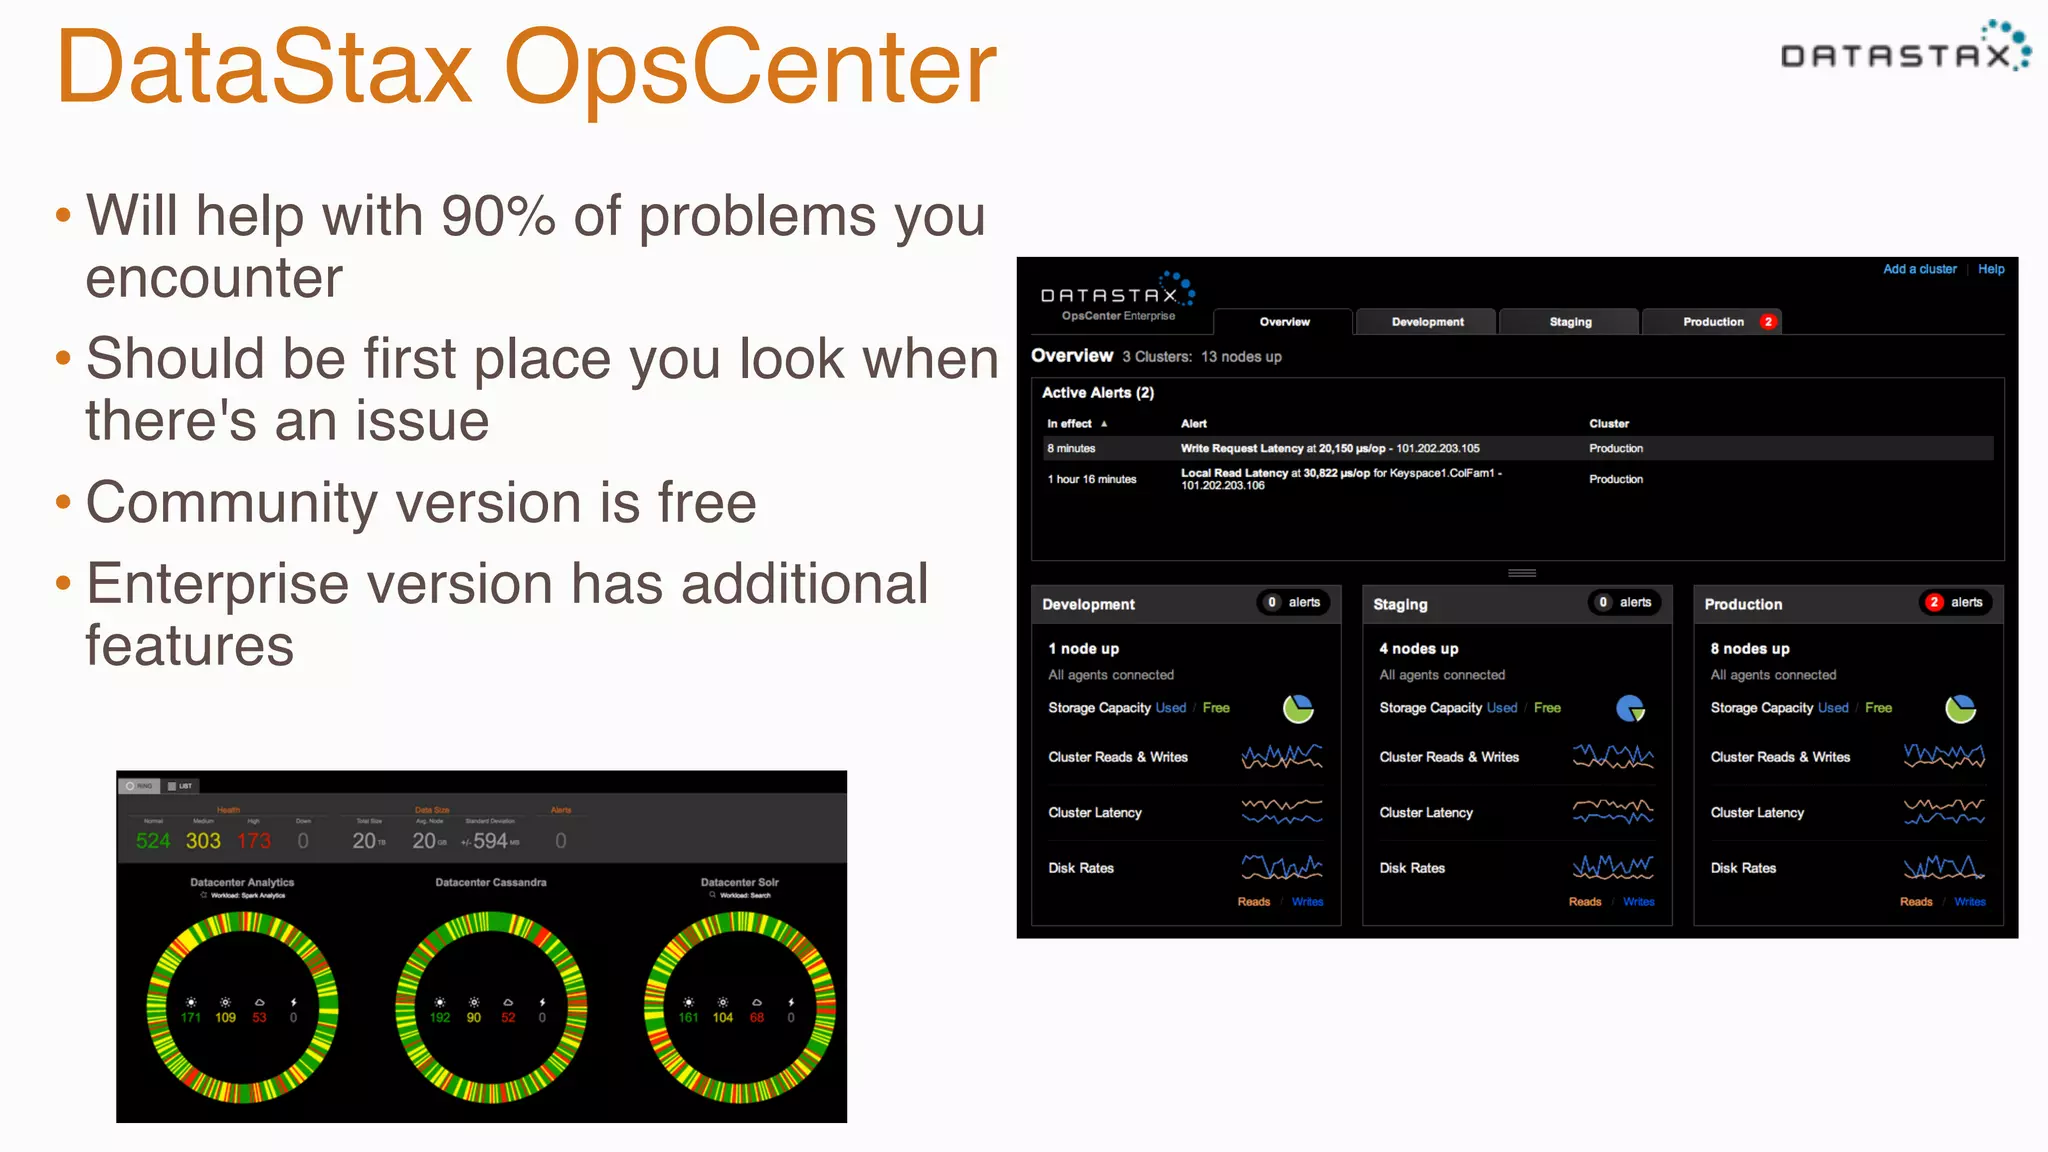
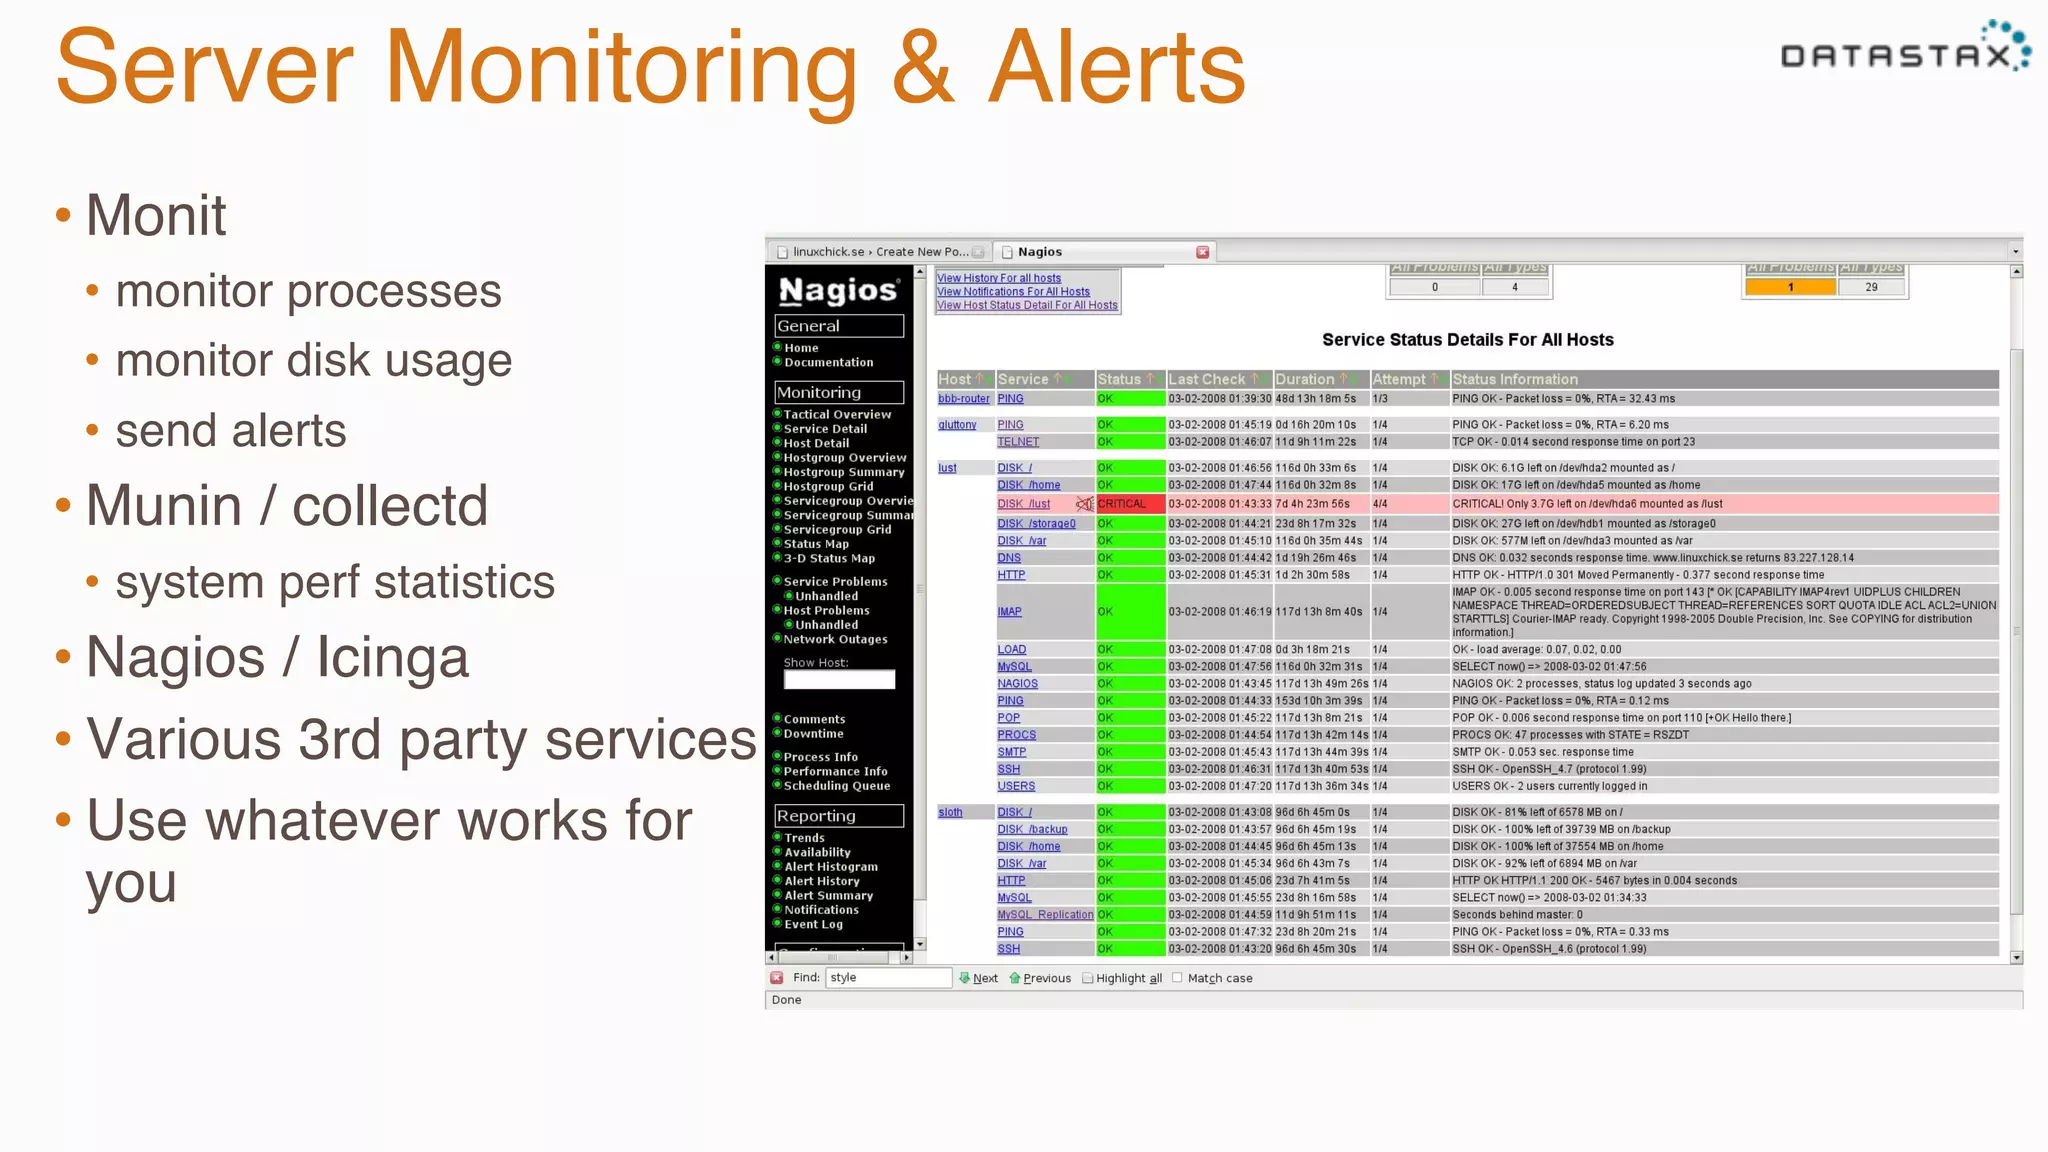
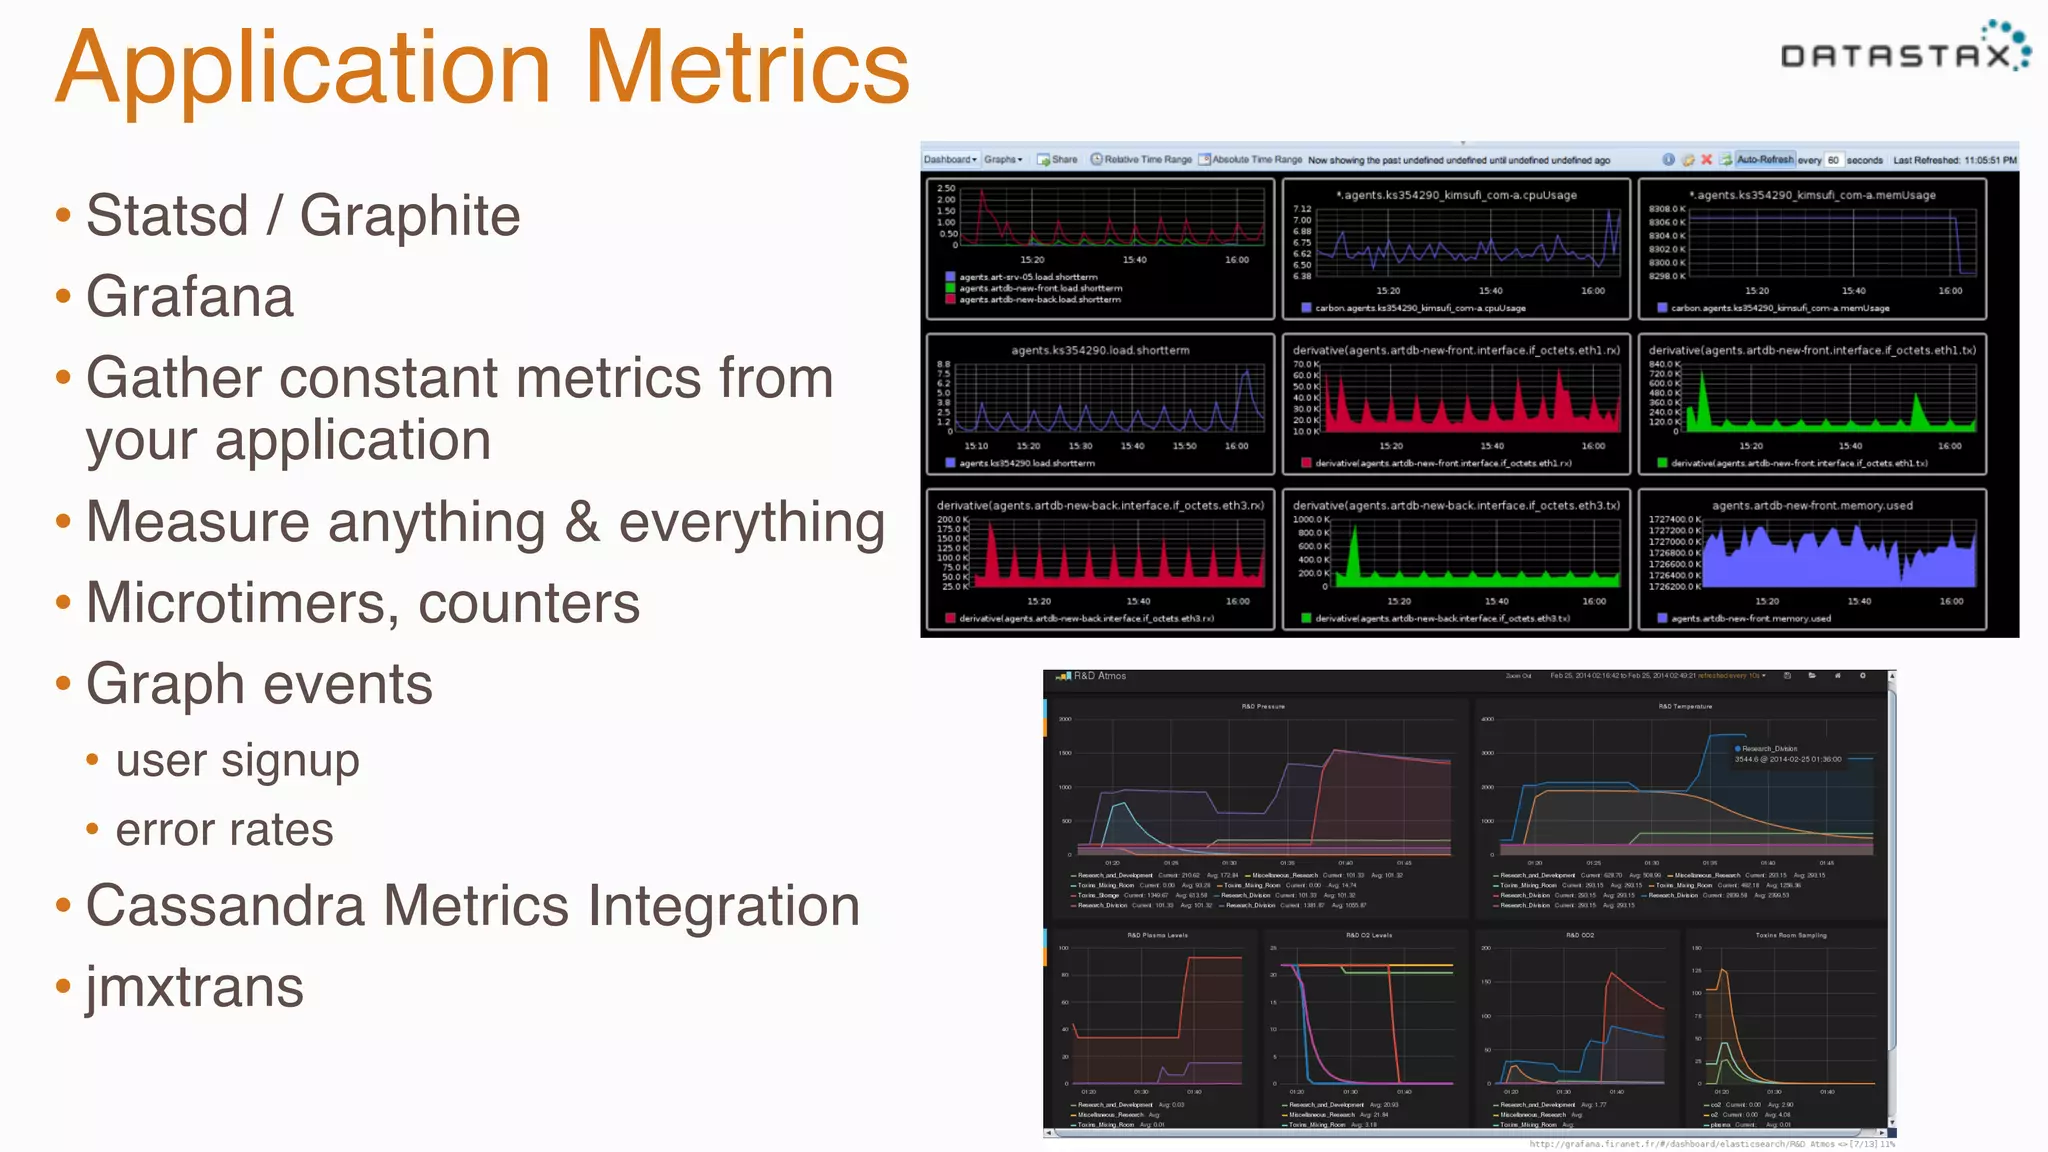
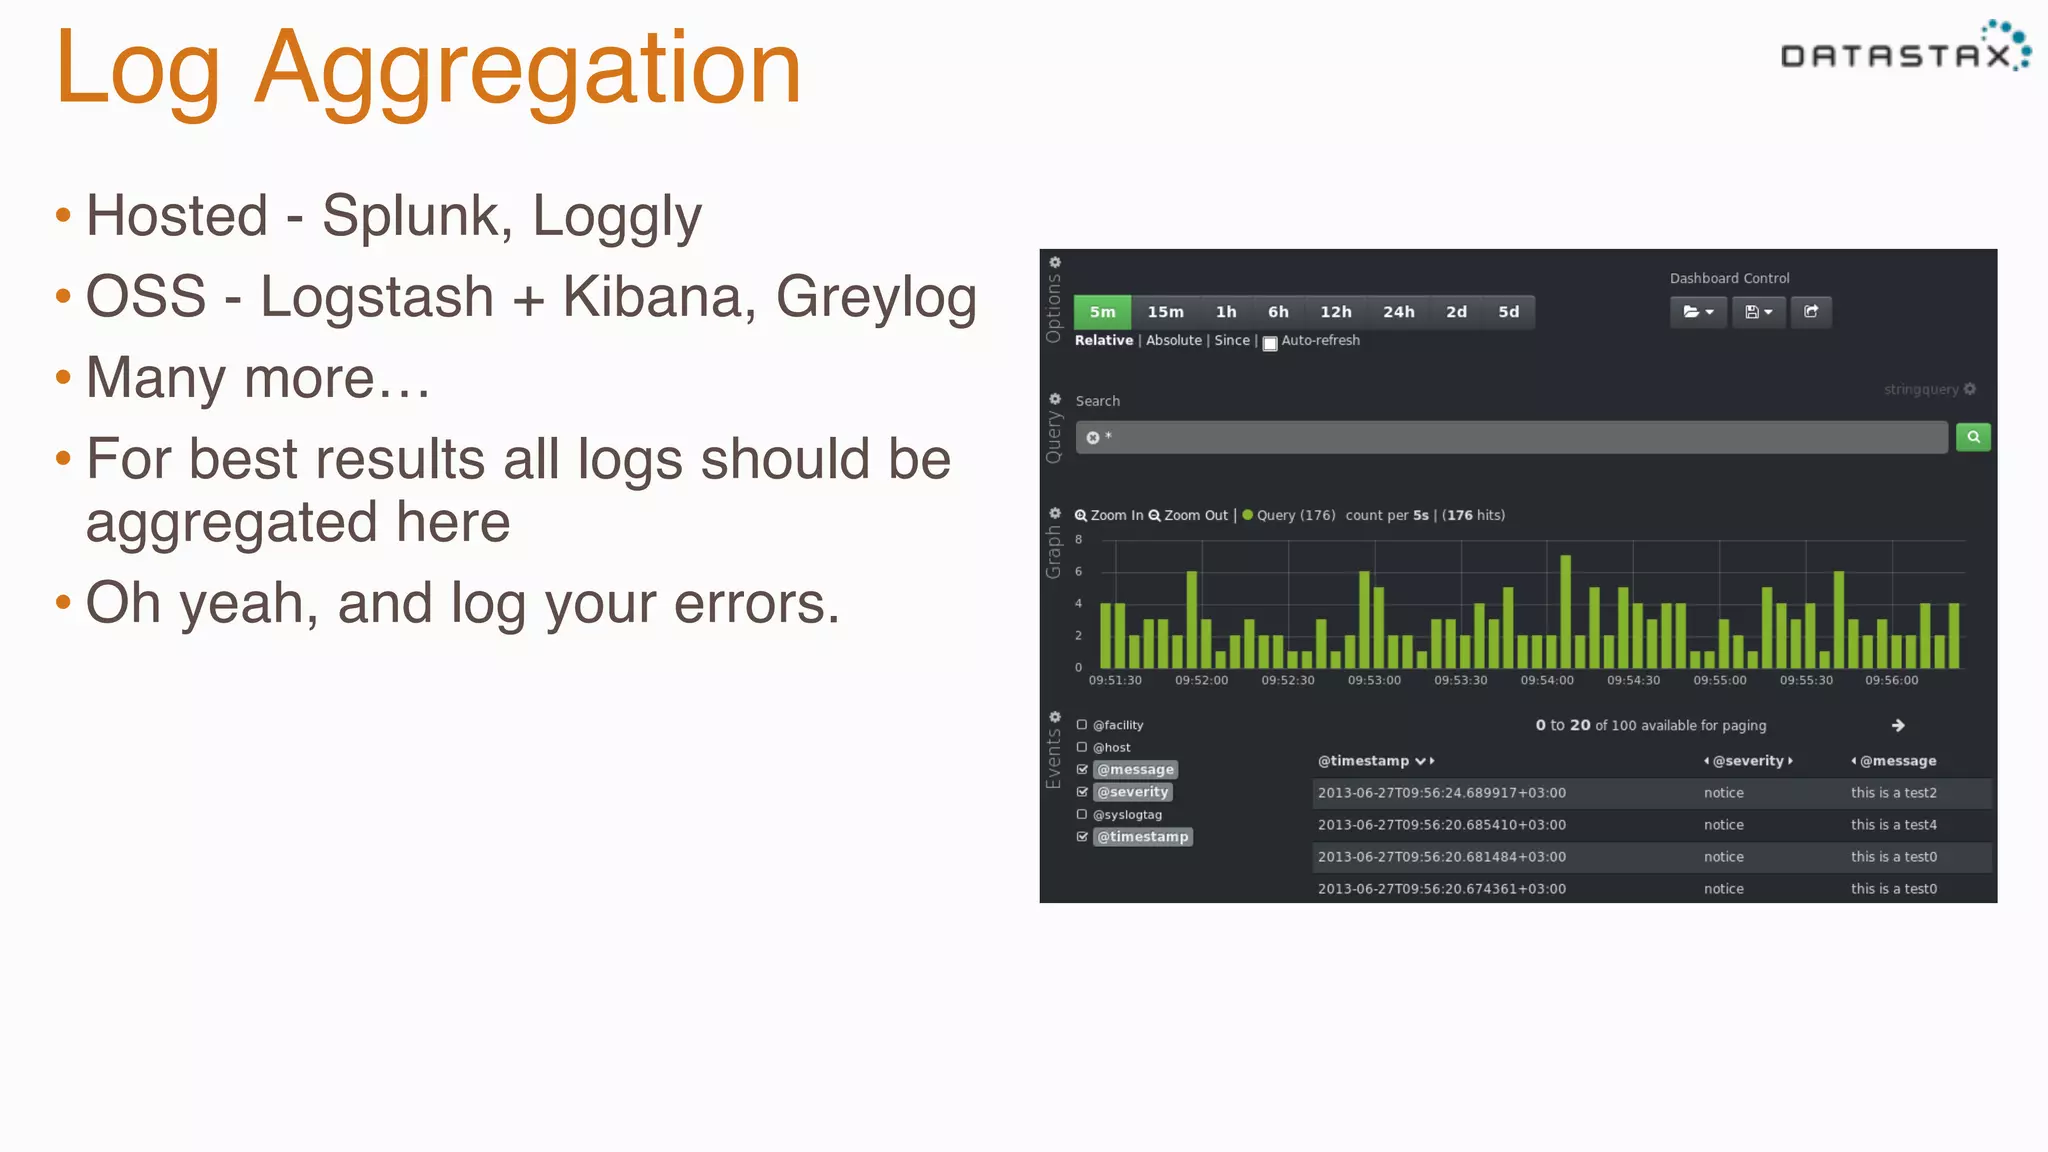
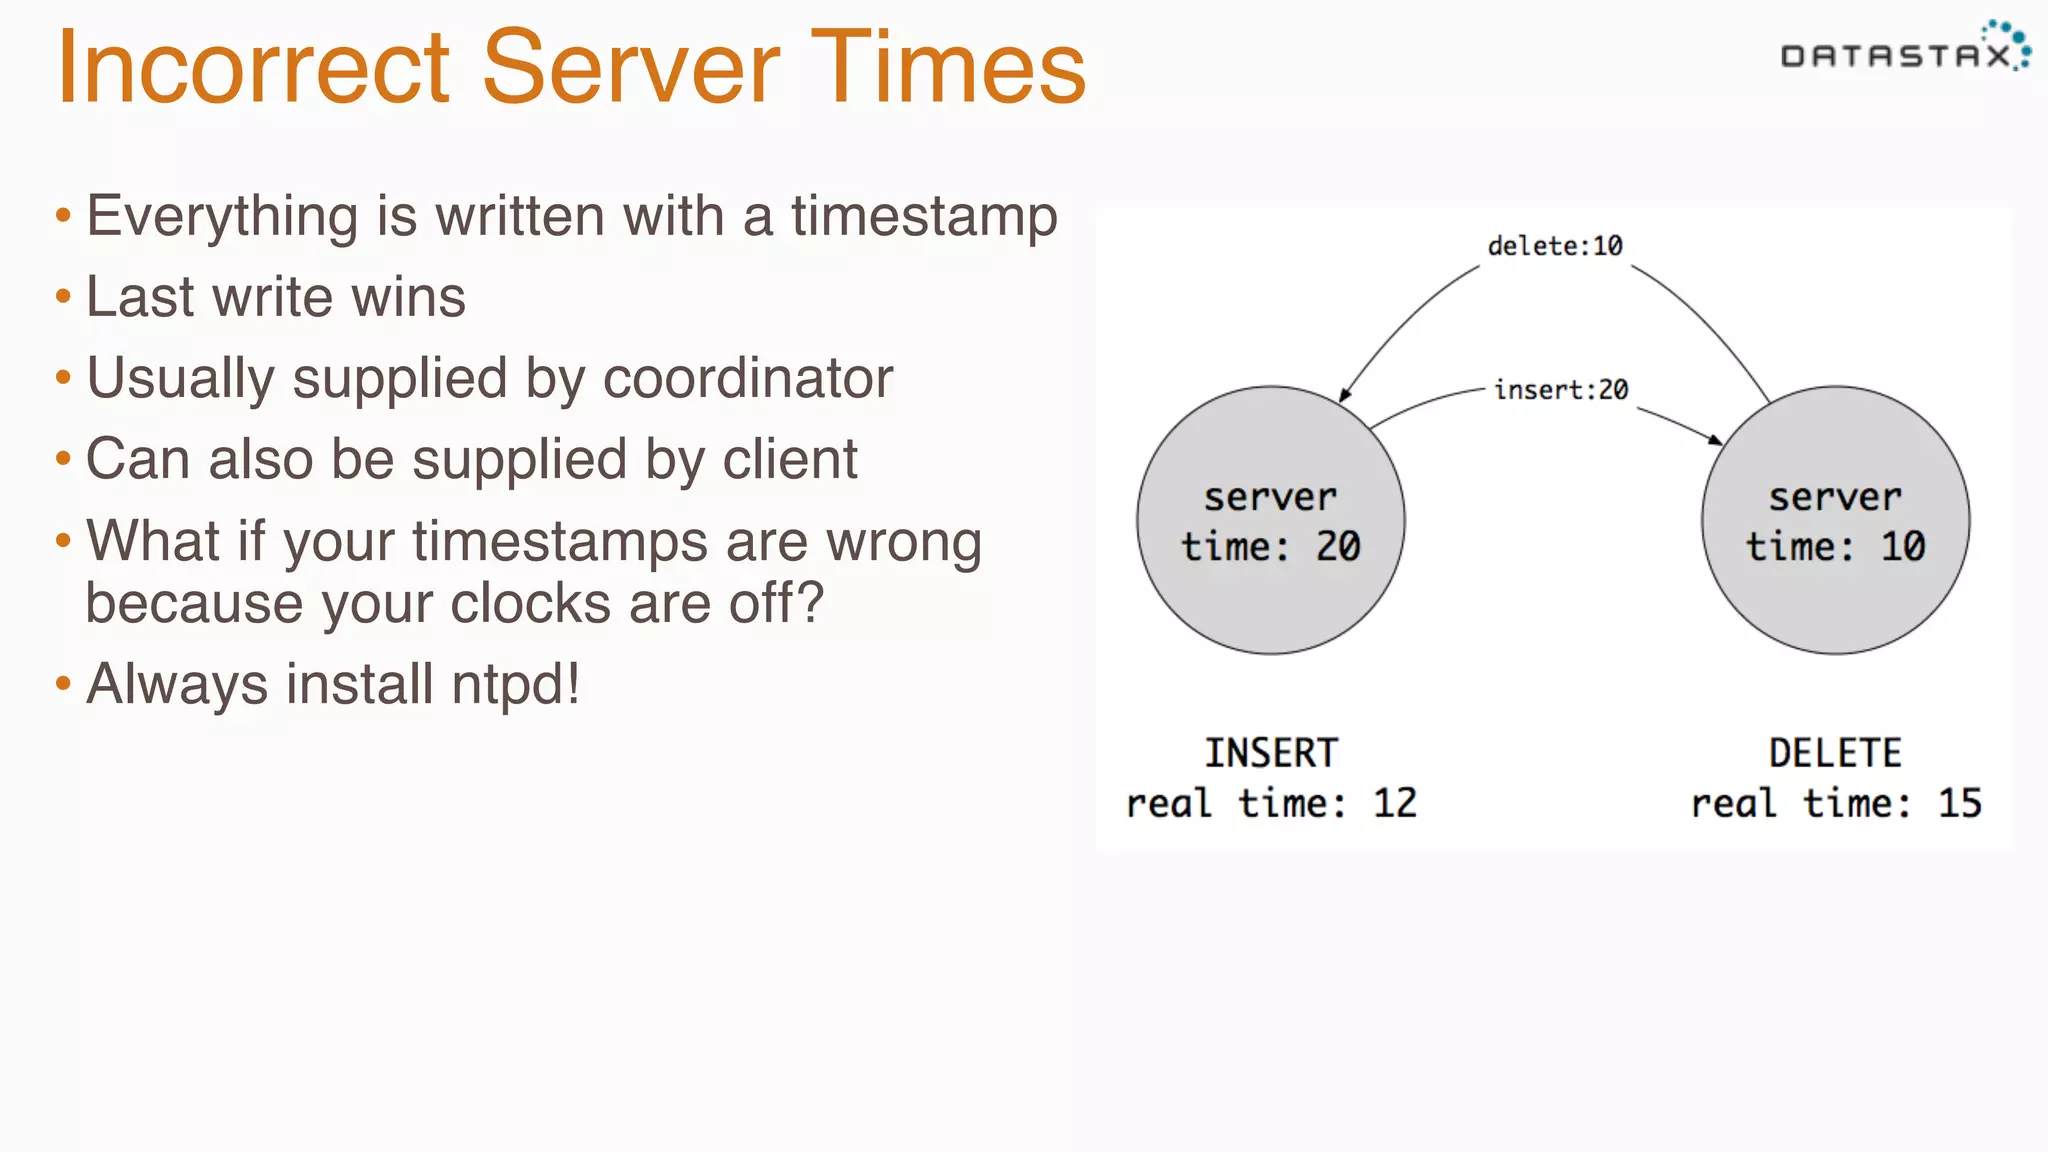
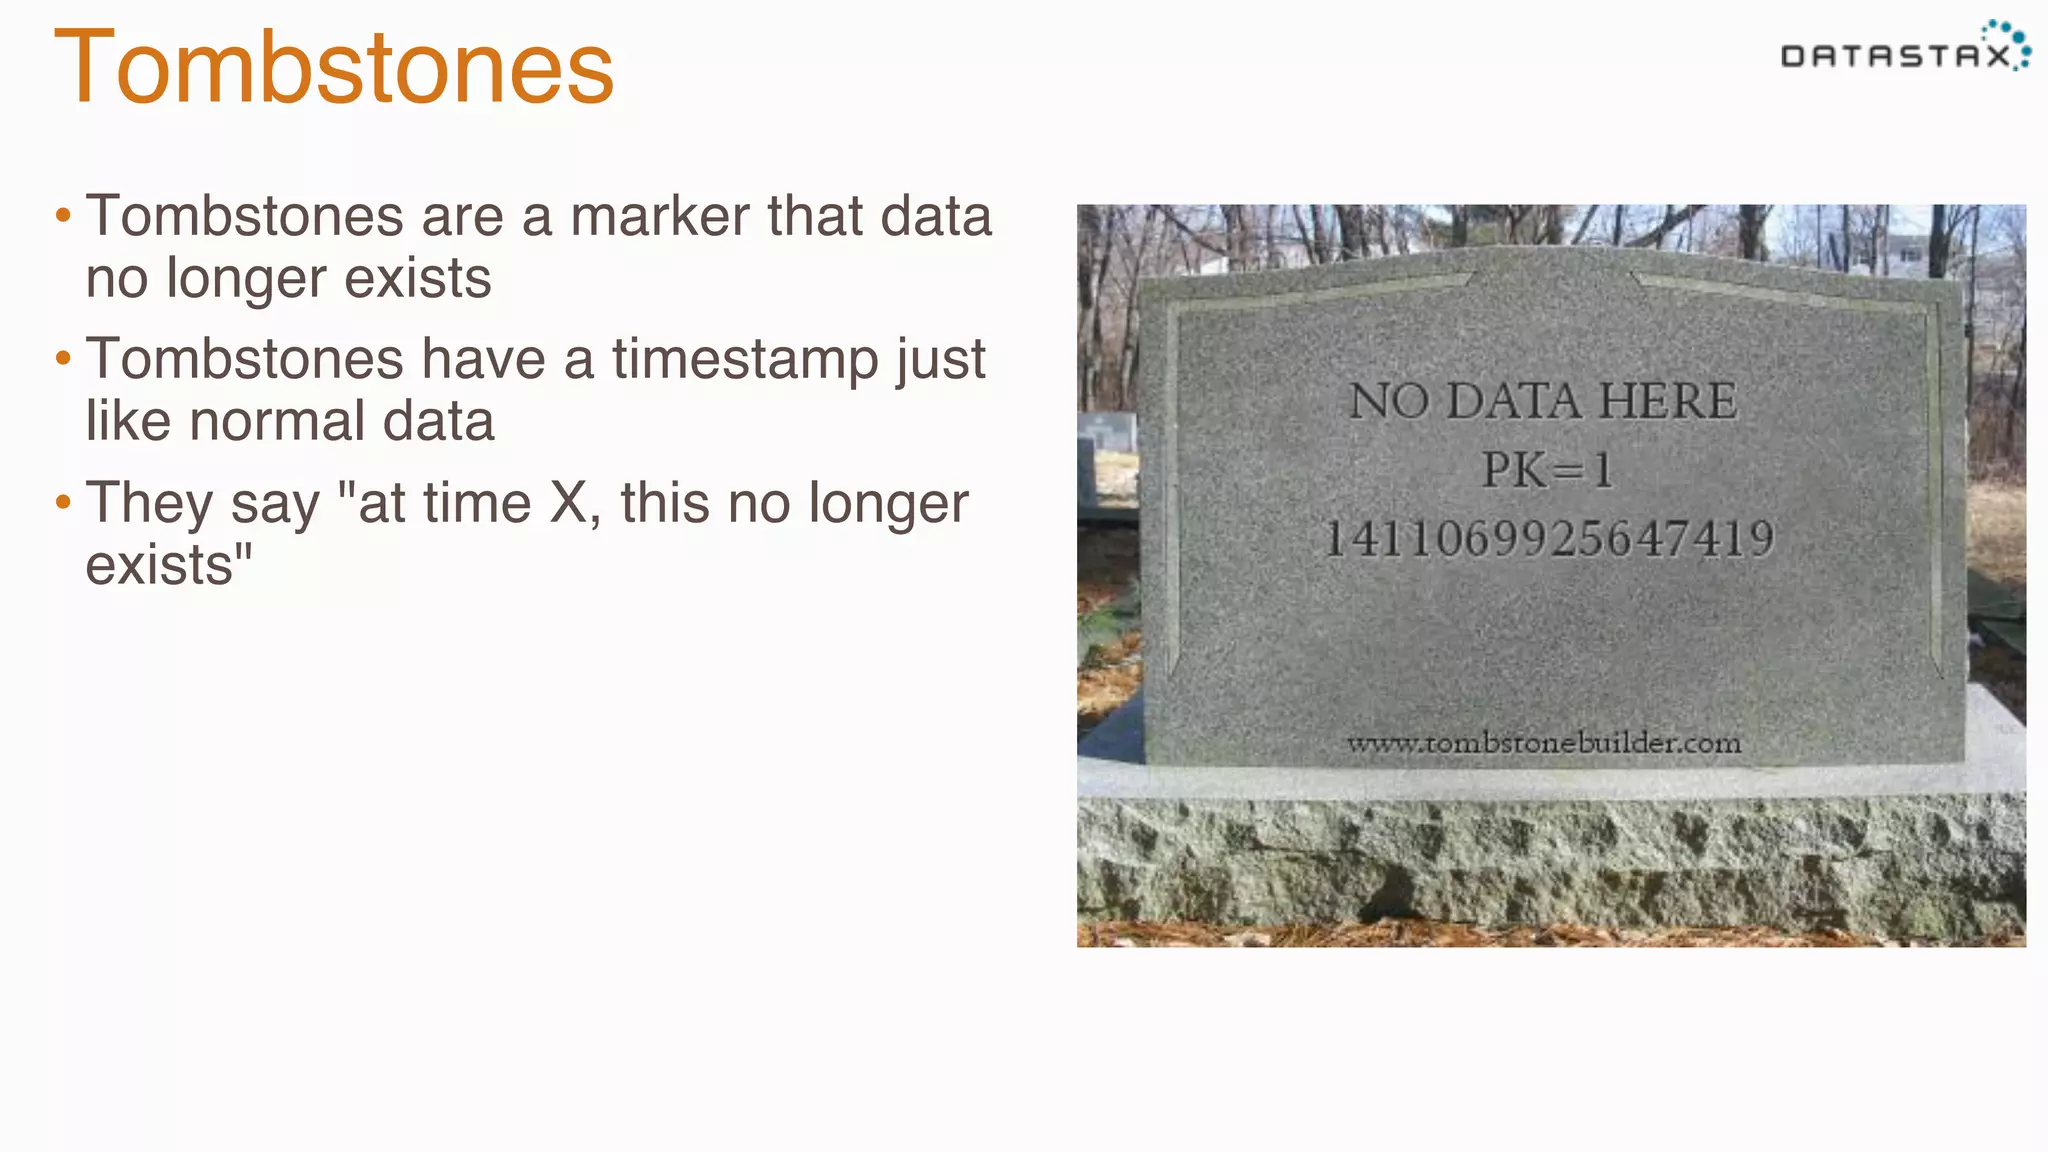
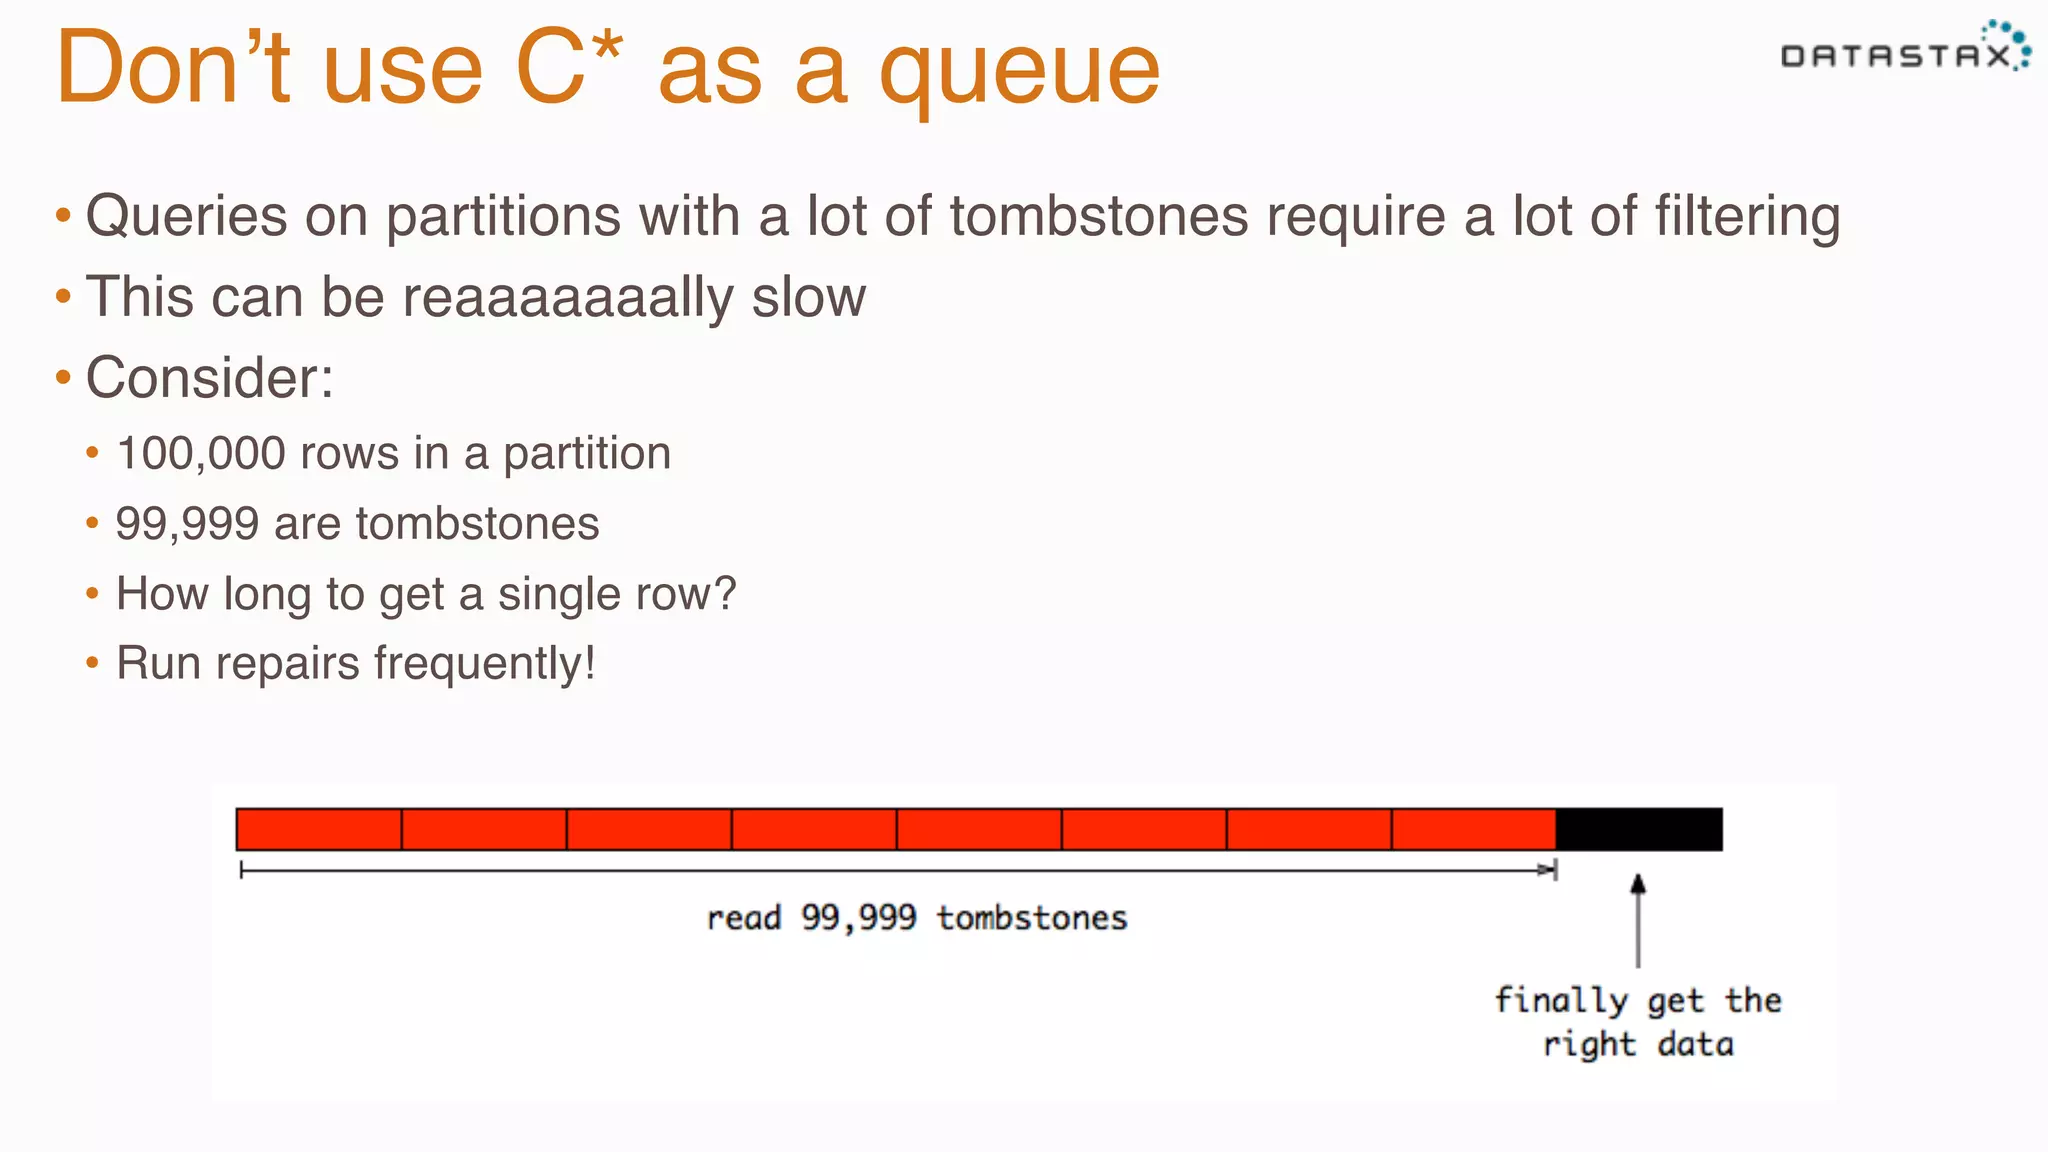
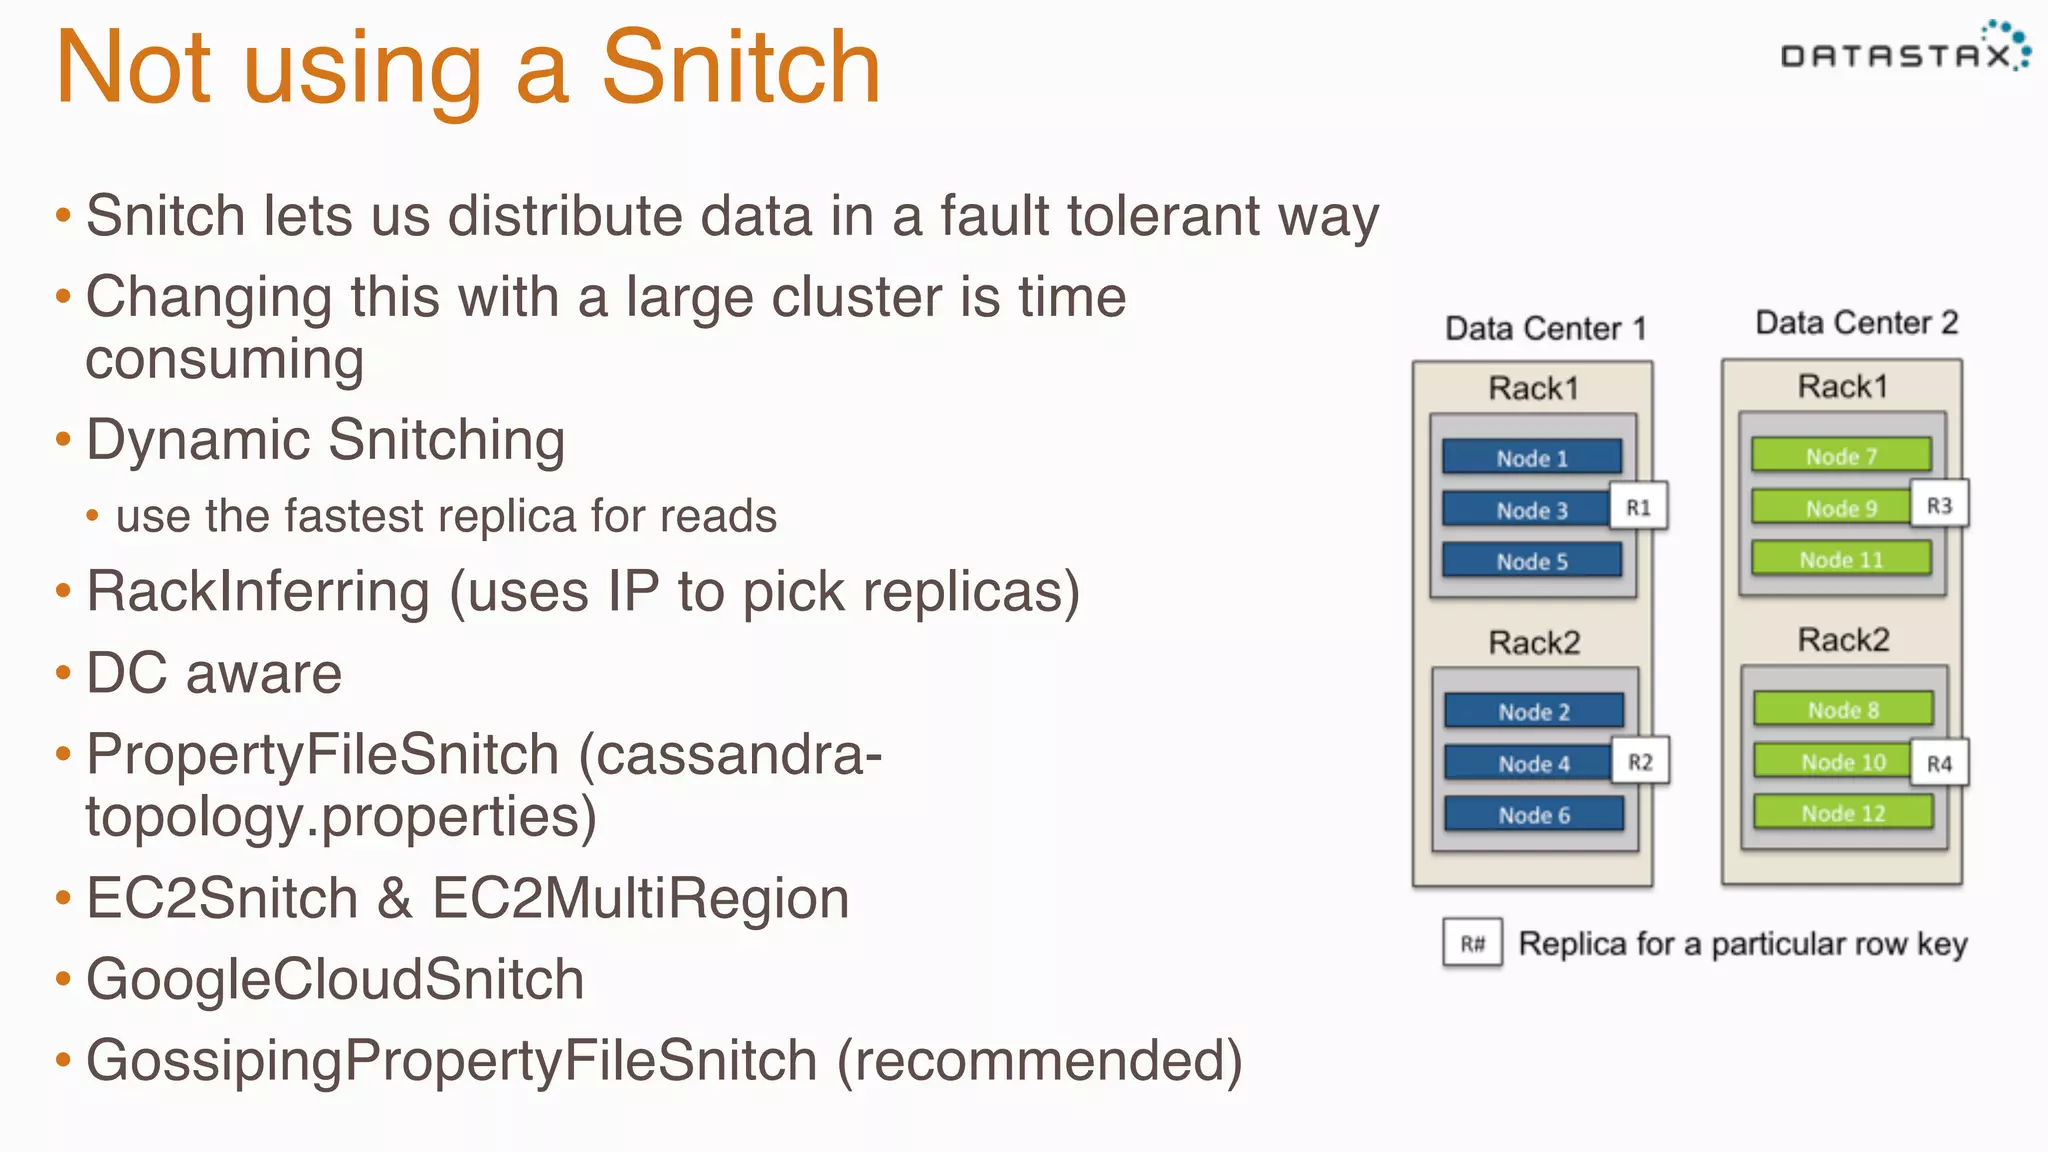
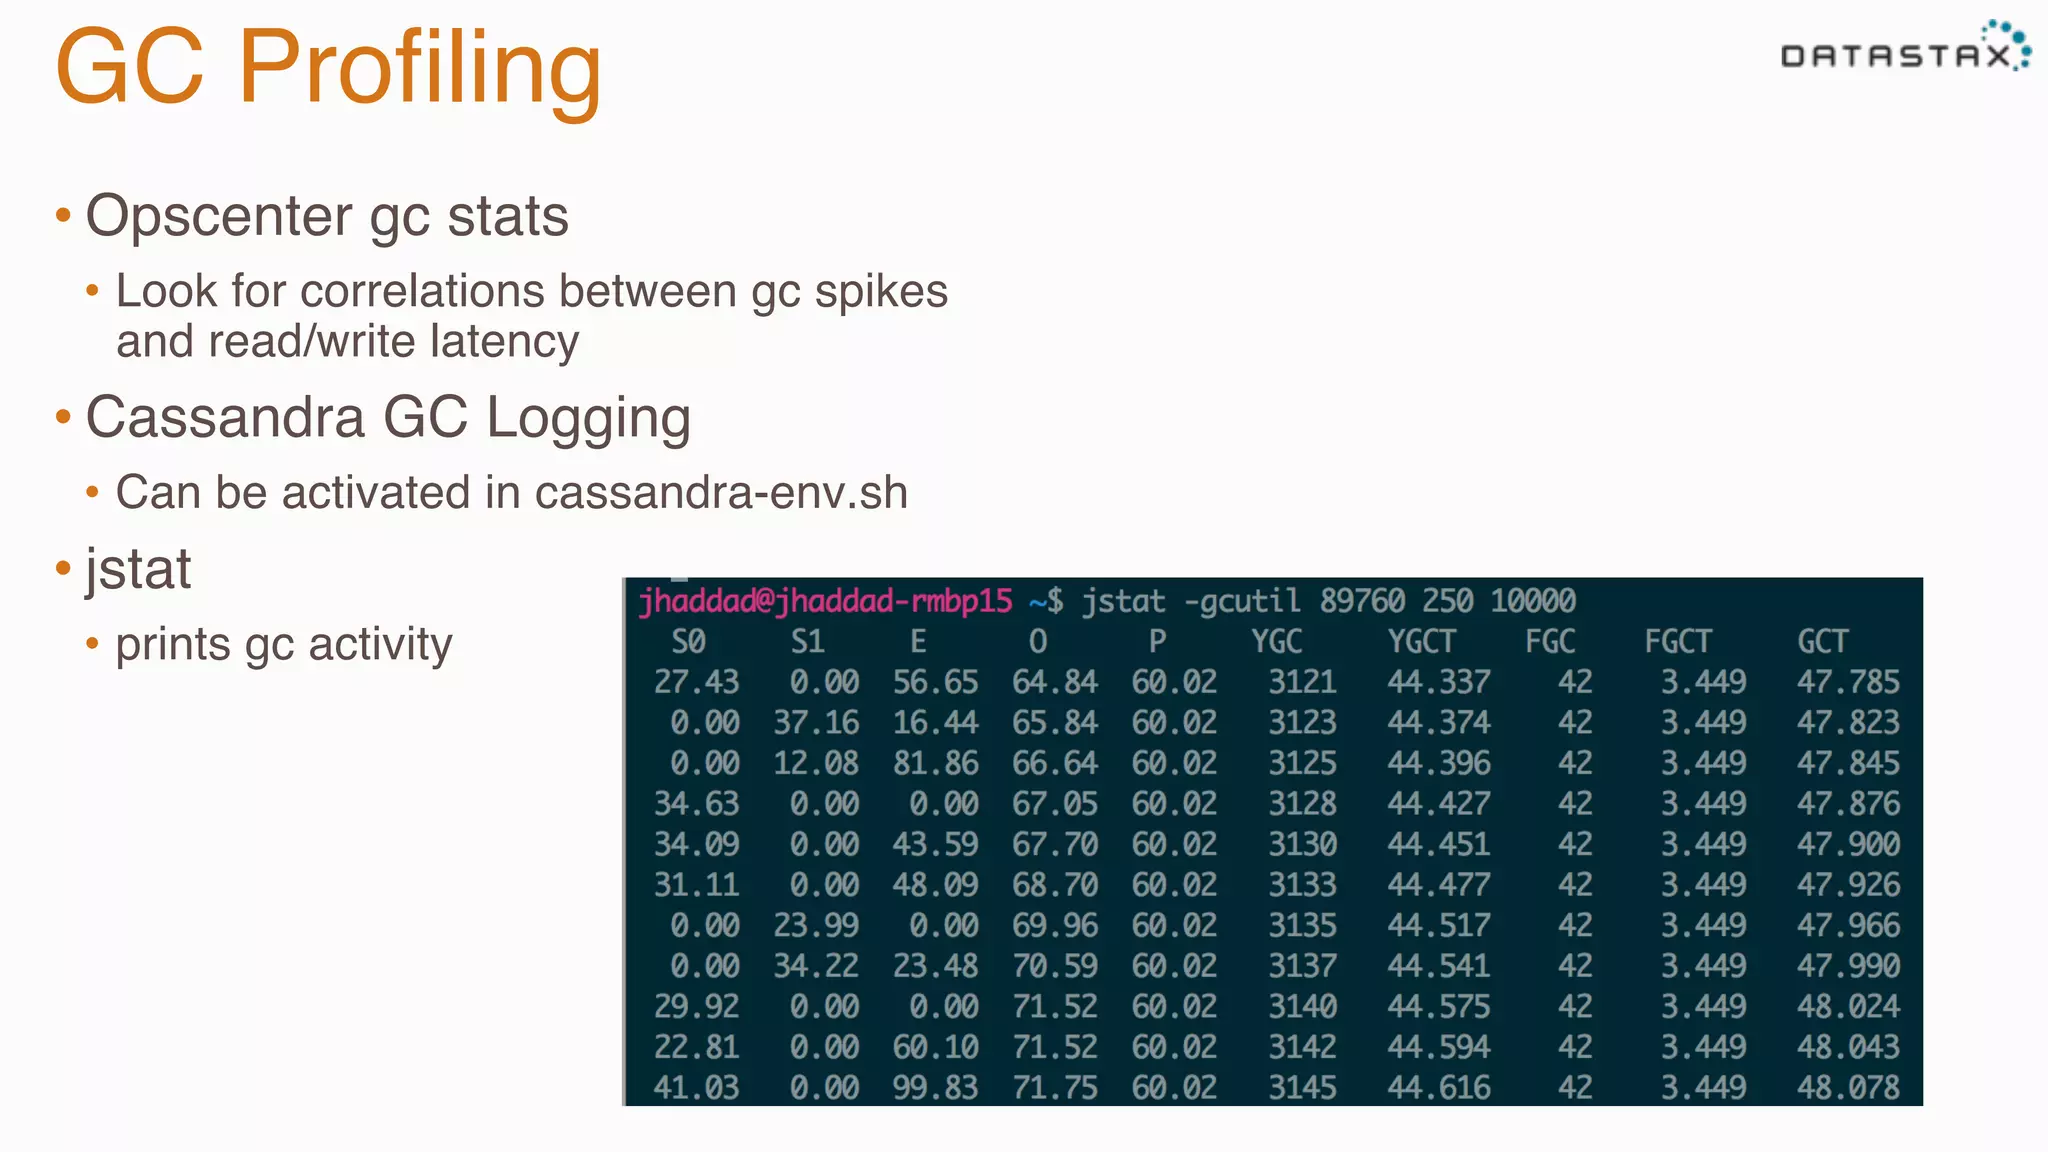
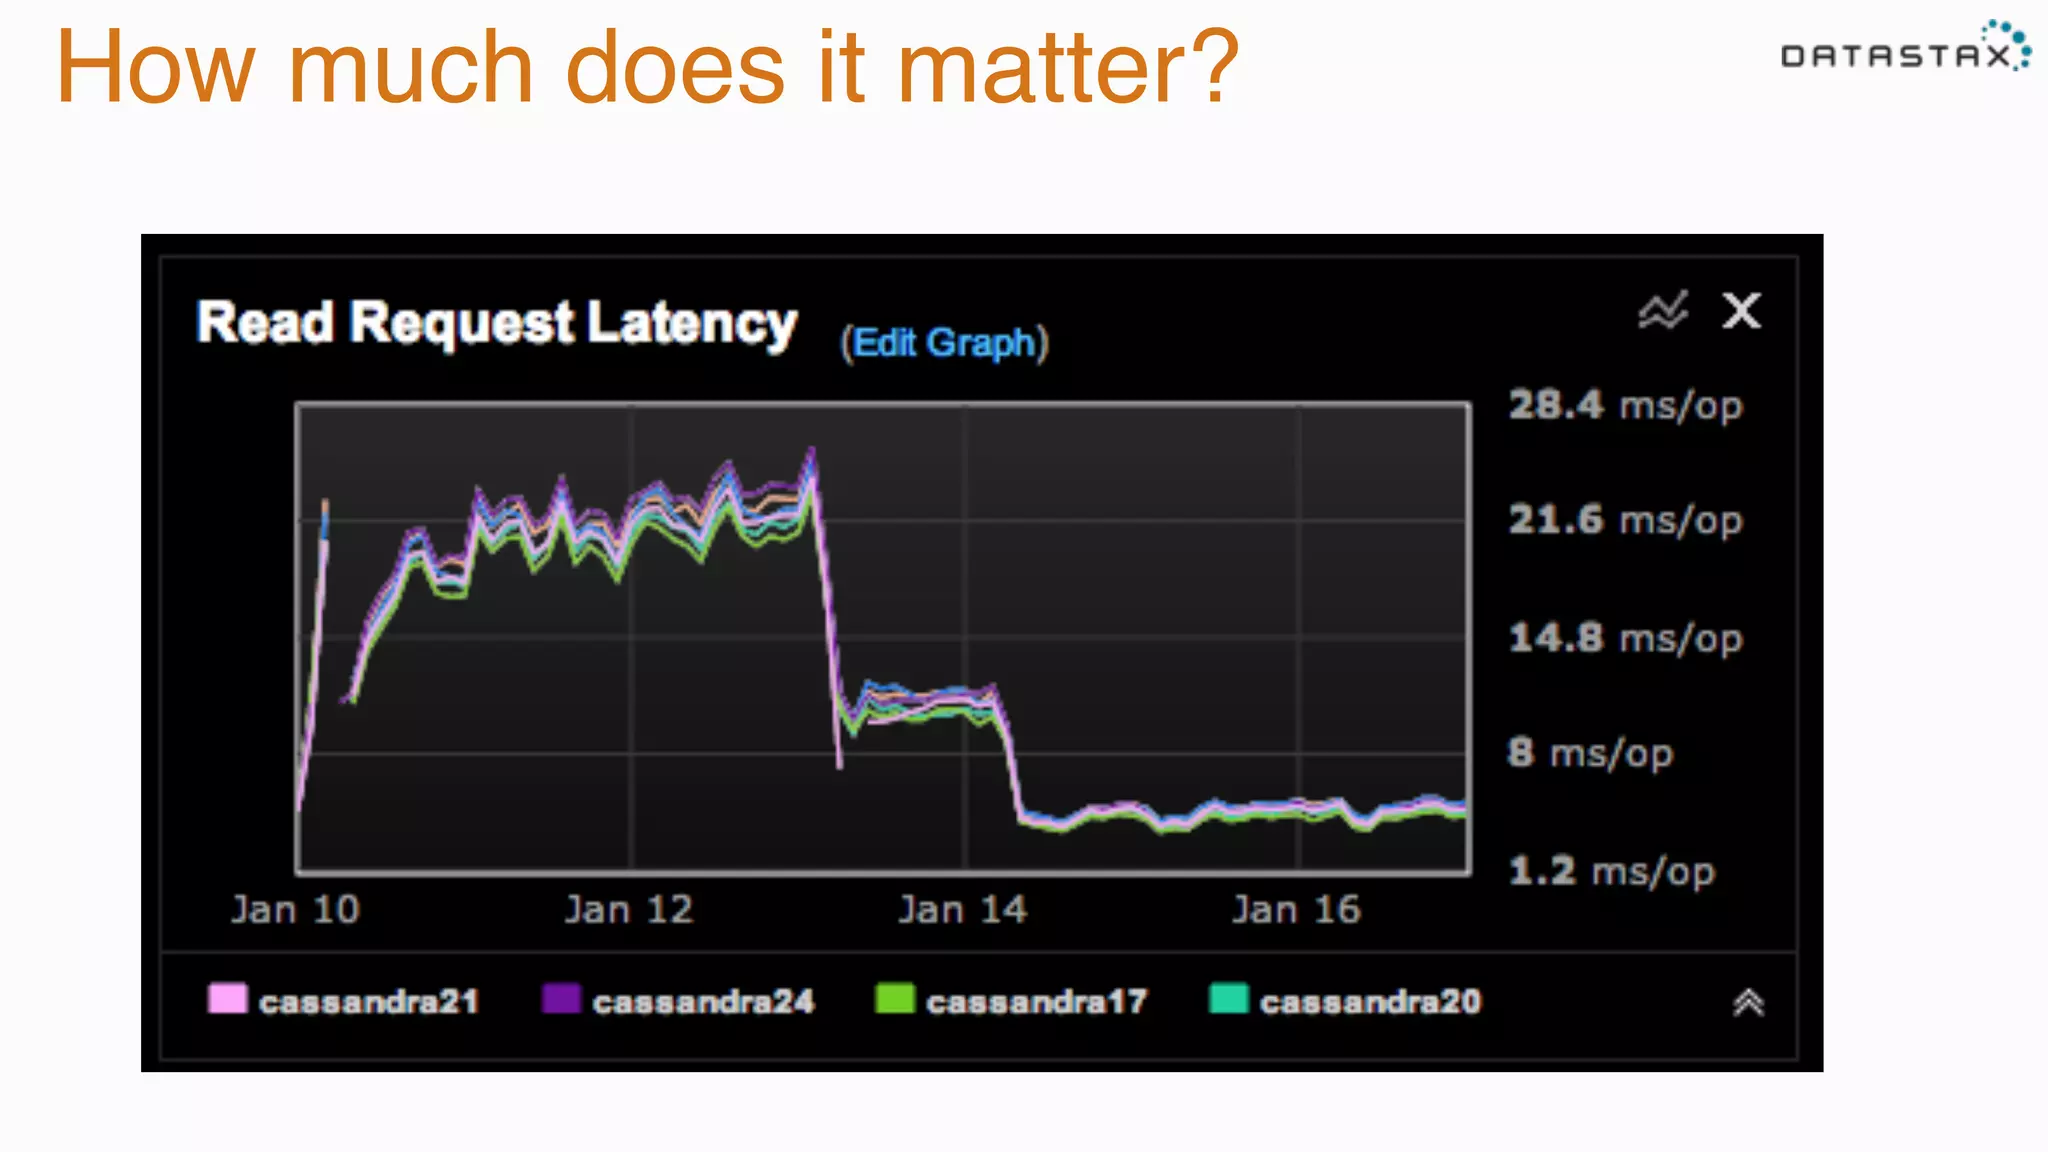
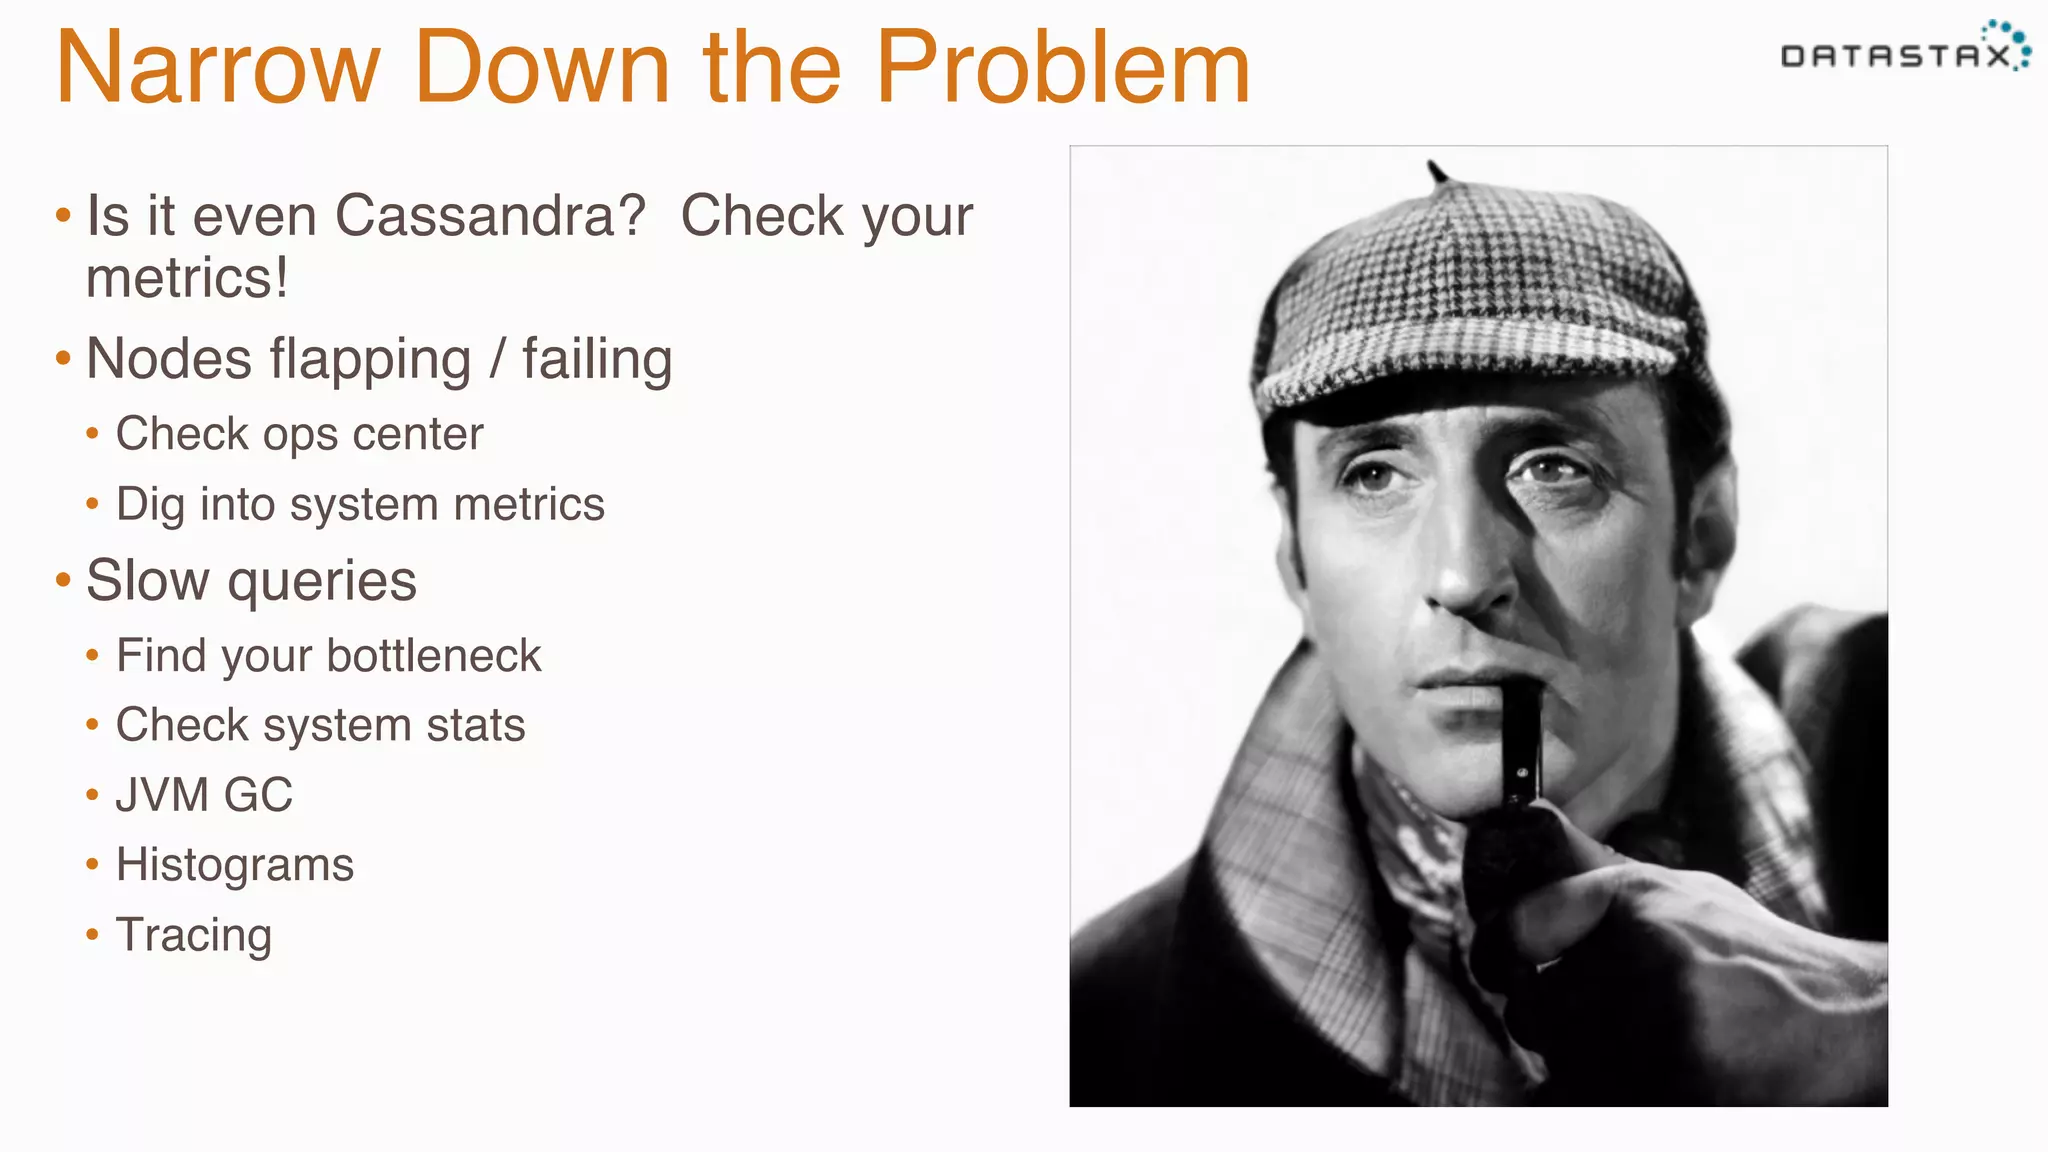
©2015 DataStax Confidential. Do not distribute without consent.
Joel Jacobson, Solutions Engineer
@joeljacobson
Diagnosing Problems in Production
1
©2014 DataStax Confidential. Do not distribute without consent.
Apache Cassandra
•  Distributed NoSQL Database
•  Google Big Table
•  Amazon Dynamo
•  Continuous Availability
•  Disaster Avoidance
•  Linear Scale Performance
•  Add nodes to scale
•  Runs on Commodity Hardware
•  Cloud or on Premise
San
Francisco
New York
Dubai
First Step: Preparation
DataStax OpsCenter
• Will help with 90% of problems you
encounter
• Should be first place you look when
there's an issue
• Community version is free
• Enterprise version has additional
features
Server Monitoring & Alerts
• Monit
•  monitor processes
•  monitor disk usage
•  send alerts
• Munin / collectd
•  system perf statistics
• Nagios / Icinga
• Various 3rd party services
• Use whatever works for
you
Application Metrics
• Statsd / Graphite
• Grafana
• Gather constant metrics from
your application
• Measure anything & everything
• Microtimers, counters
• Graph events
•  user signup
•  error rates
• Cassandra Metrics Integration
• jmxtrans
Log Aggregation
• Hosted - Splunk, Loggly
• OSS - Logstash + Kibana, Greylog
• Many more…
• For best results all logs should be
aggregated here
• Oh yeah, and log your errors.
Gotchas
Incorrect Server Times
• Everything is written with a timestamp
• Last write wins
• Usually supplied by coordinator
• Can also be supplied by client
• What if your timestamps are wrong
because your clocks are off?
• Always install ntpd!
Tombstones
• Tombstones are a marker that data
no longer exists
• Tombstones have a timestamp just
like normal data
• They say "at time X, this no longer
exists"
Don’t use C* as a queue
• Queries on partitions with a lot of tombstones require a lot of filtering
• This can be reaaaaaaally slow
• Consider:
•  100,000 rows in a partition
•  99,999 are tombstones
•  How long to get a single row?
•  Run repairs frequently!
Not using a Snitch
• Snitch lets us distribute data in a fault tolerant way
• Changing this with a large cluster is time
consuming
• Dynamic Snitching
•  use the fastest replica for reads
• RackInferring (uses IP to pick replicas)
• DC aware
• PropertyFileSnitch (cassandra-
topology.properties)
• EC2Snitch & EC2MultiRegion
• GoogleCloudSnitch
• GossipingPropertyFileSnitch (recommended)
Version Mismatch
• SSTable format changed between
versions, making streaming
incompatible
• Version mismatch can break bootstrap,
repair, and decommission
• Introducing new nodes? Stick w/ the
same version
• Upgrade nodes in place
•  One at a time
•  One rack / AZ at a time (requires proper
snitch)
Disk Space not Reclaimed
• When you add new nodes, data is
streamed from existing nodes
• … but it's not deleted from them after
• You need to run a nodetool cleanup
• Otherwise you'll run out of space just by
adding nodes
Using Shared Storage
• Single point of failure
• High latency
• Expensive
• Performance is about latency
• Can increase throughput with more
disks
• In general avoid EBS, SAN, NAS
Diagnostic Tools
iostat
• Disk stats
•  Queue size, wait times
• Ignore %util
vmstat
• virtual memory statistics
• Am I swapping?
• Reports at an interval, to an optional count
dstat
• Flexible look at network, CPU, memory, disk
strace
• What is my process doing?
• See all system calls
• Filterable with -e
• Can attach to running
processes
tcpdump
• Watch network traffic
nodetool tpstats
• What's blocked?
• MemtableFlushWriter? -
Slow disks!
•  also leads to GC issues
• Dropped mutations?
•  need repair!
Histograms
• proxyhistograms
•  High level read and write times
•  Includes network latency
• cfhistograms <keyspace> <table>
•  reports stats for single table on a single
node
•  Used to identify tables with
performance problems
Query Tracing
GC Profiling
• Opscenter gc stats
•  Look for correlations between gc spikes
and read/write latency
• Cassandra GC Logging
•  Can be activated in cassandra-env.sh
• jstat
•  prints gc activity
How much does it matter?
Narrow Down the Problem
• Is it even Cassandra? Check your
metrics!
• Nodes flapping / failing
•  Check ops center
•  Dig into system metrics
• Slow queries
•  Find your bottleneck
•  Check system stats
•  JVM GC
•  Histograms
•  Tracing
©2015 DataStax Confidential. Do not distribute without consent. 30

Joel Jacobson (Datastax) - Diagnosing Cassandra Problems in Production

  • 1.
    ©2015 DataStax Confidential.Do not distribute without consent. Joel Jacobson, Solutions Engineer @joeljacobson Diagnosing Problems in Production 1
  • 2.
    ©2014 DataStax Confidential.Do not distribute without consent. Apache Cassandra •  Distributed NoSQL Database •  Google Big Table •  Amazon Dynamo •  Continuous Availability •  Disaster Avoidance •  Linear Scale Performance •  Add nodes to scale •  Runs on Commodity Hardware •  Cloud or on Premise San Francisco New York Dubai
  • 5.
  • 6.
    DataStax OpsCenter • Will helpwith 90% of problems you encounter • Should be first place you look when there's an issue • Community version is free • Enterprise version has additional features
  • 7.
    Server Monitoring &Alerts • Monit •  monitor processes •  monitor disk usage •  send alerts • Munin / collectd •  system perf statistics • Nagios / Icinga • Various 3rd party services • Use whatever works for you
  • 8.
    Application Metrics • Statsd /Graphite • Grafana • Gather constant metrics from your application • Measure anything & everything • Microtimers, counters • Graph events •  user signup •  error rates • Cassandra Metrics Integration • jmxtrans
  • 9.
    Log Aggregation • Hosted -Splunk, Loggly • OSS - Logstash + Kibana, Greylog • Many more… • For best results all logs should be aggregated here • Oh yeah, and log your errors.
  • 10.
  • 11.
    Incorrect Server Times • Everythingis written with a timestamp • Last write wins • Usually supplied by coordinator • Can also be supplied by client • What if your timestamps are wrong because your clocks are off? • Always install ntpd!
  • 12.
    Tombstones • Tombstones are amarker that data no longer exists • Tombstones have a timestamp just like normal data • They say "at time X, this no longer exists"
  • 13.
    Don’t use C*as a queue • Queries on partitions with a lot of tombstones require a lot of filtering • This can be reaaaaaaally slow • Consider: •  100,000 rows in a partition •  99,999 are tombstones •  How long to get a single row? •  Run repairs frequently!
  • 14.
    Not using aSnitch • Snitch lets us distribute data in a fault tolerant way • Changing this with a large cluster is time consuming • Dynamic Snitching •  use the fastest replica for reads • RackInferring (uses IP to pick replicas) • DC aware • PropertyFileSnitch (cassandra- topology.properties) • EC2Snitch & EC2MultiRegion • GoogleCloudSnitch • GossipingPropertyFileSnitch (recommended)
  • 15.
    Version Mismatch • SSTable formatchanged between versions, making streaming incompatible • Version mismatch can break bootstrap, repair, and decommission • Introducing new nodes? Stick w/ the same version • Upgrade nodes in place •  One at a time •  One rack / AZ at a time (requires proper snitch)
  • 16.
    Disk Space notReclaimed • When you add new nodes, data is streamed from existing nodes • … but it's not deleted from them after • You need to run a nodetool cleanup • Otherwise you'll run out of space just by adding nodes
  • 17.
    Using Shared Storage • Singlepoint of failure • High latency • Expensive • Performance is about latency • Can increase throughput with more disks • In general avoid EBS, SAN, NAS
  • 18.
  • 19.
    iostat • Disk stats •  Queuesize, wait times • Ignore %util
  • 20.
    vmstat • virtual memory statistics • AmI swapping? • Reports at an interval, to an optional count
  • 21.
    dstat • Flexible look atnetwork, CPU, memory, disk
  • 22.
    strace • What is myprocess doing? • See all system calls • Filterable with -e • Can attach to running processes
  • 23.
  • 24.
    nodetool tpstats • What's blocked? • MemtableFlushWriter?- Slow disks! •  also leads to GC issues • Dropped mutations? •  need repair!
  • 25.
    Histograms • proxyhistograms •  High levelread and write times •  Includes network latency • cfhistograms <keyspace> <table> •  reports stats for single table on a single node •  Used to identify tables with performance problems
  • 26.
  • 27.
    GC Profiling • Opscenter gcstats •  Look for correlations between gc spikes and read/write latency • Cassandra GC Logging •  Can be activated in cassandra-env.sh • jstat •  prints gc activity
  • 28.
    How much doesit matter?
  • 29.
    Narrow Down theProblem • Is it even Cassandra? Check your metrics! • Nodes flapping / failing •  Check ops center •  Dig into system metrics • Slow queries •  Find your bottleneck •  Check system stats •  JVM GC •  Histograms •  Tracing
  • 30.
    ©2015 DataStax Confidential.Do not distribute without consent. 30