
More Related Content
What's hot
What's hot (20)
Viewers also liked
Viewers also liked (20)
Similar to Standard curve of haemoglobin
Similar to Standard curve of haemoglobin (20)
Recently uploaded
Recently uploaded (20)
Standard curve of haemoglobin
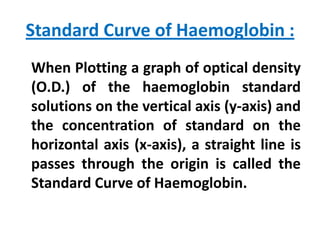
- 1. Standard Curve of Haemoglobin : When Plotting a graph of optical density (O.D.) of the haemoglobin standard solutions on the vertical axis (y-axis) and the concentration of standard on the horizontal axis (x-axis), a straight line is passes through the origin is called the Standard Curve of Haemoglobin.
- 2. A standard curve is prepared by using cyanmethemoglobin standard solutions of known hemoglobin concentrations
- 3. An unknown hemoglobin concentration may be calculated from the measured optical density (O.D.) and can be read from a standard calibration curve directly.
- 4. Reagents and Equipment: 1. Cyanmethemoglobin standard 60 mg/dl available commercially. Concentration of Haemoglobin standard in gm% = 60 mg/dl x Dilution Factor 60 5020 µl = ----- gm/dl X --------1000 20 µl
- 5. = 0.06 gm% X 251 Hb standard concentration =15.06 gm% (Since the Hb Cyanmethaemoglobin procedure uses 20 µl of whole blood + 5ml Drabkin's solution)
- 6. 2. Test tubes 3. Micropipette, 20 μl (0.020 ml) 4. Micropipette tips 5. Volumetric pipettes: 1 ml, 2 ml, 3 ml, 4 ml, 5 ml 6. Colorimeter 7. Graph paper/pencil/scale etc.
- 7. Preparation of a Standard Haemoglobin Curve: 1. Prepare dilutions of the cyanmethemoglobin standard representing 3 gm%, 6 gm%, 9 gm%, 12gm%, and 15 gm%. 2. Take 6 clean, dry test tubes. Label test tubes.
- 8. 3. Using the appropriate volumetric pipettes pipette the solutions as described below:
- 9. Tube Cyanmethae Drabkin’s moglobin Standard solution Concentration standard of 1. 0 ml 5 ml Blank 2. 1 ml 4 ml 1/5 x 15 gm%= 3 gm% 3. 2 ml 3 ml 2/5 x 15 gm% = 6 gm% 4. 3 ml 2 ml 3/5 x 15 gm%= 9 gm% 5. 4 ml 1 ml 4/5x15 gm% = 12 gm% 6. 5 ml 0 ml 5/5 x 15gm%= 15 gm%
- 10. 4. Mix and stand for 5 minutes. 5. Read the dilutions in the colorimeter: 6. Place the appropriate filter in the colorimeter or set to 540nm. 7. Zero the colorimeter using tube 1, of Drabkin’s solution.
- 11. 8. Read optical density (O.D.) of the contents of tubes 2-6 relatively. 9. Plot a graph of optical density (O.D.) of the haemoglobin standard on the vertical axis (y-axis) and the concentration of standard with gm% on the horizontal axis (x-axis) .
- 12. Below is an example of a calibration curve: TUBE Concentration of standard ABSORBANCE (O.D.) suppose 1. 0 gm% .00 2. 3 gm% .07 3. 6 gm% .14 4. 9 gm% .21 5. 12 gm% .28 6. 15 gm% .35
- 13. 0.4 0.35 0.3 O.D. of standard 0.25 0.2 0.15 0.1 0.05 0 0 2 4 6 8 Concentration of standard 10 12 14 16
- 14. A new calibration graph must be prepared whenever the colorimeter, cuvette type or the test method is changed. • Always allow the colorimeter to warm up before measuring the test samples.
- 15. • Ensure that the correct filter (540nm wavelength—yellow/green filter) is in place. • To test for accuracy use a control sample of known value.
- 16. • A new stock of Drabkin’s solution must be checked against the old solution with samples of known value before it is used for patients • Drabkin’s solution should be clear and pale yellow in colour. If it is turbid or loses its colour it must be discarded.
- 17. • Handle Drabkin’s solution with care. It is very poisonous. Do not mouth pipette. • Leave the blood mixed with Drabkin’s solution for 10 minutes before reading the optical density so that the haemoglobin can convert to Cyanmethaemoglobin.
- 18. • Be careful to avoid air bubbles in the cuvette.
- 19. Thank you