Infrared sensors on satellites like the Advanced Very High Resolution Radiometer (AVHRR) are used to measure sea surface temperature. Infrared radiation emitted from the surface is detected by satellite sensors and used to calculate brightness temperature, from which sea surface skin temperature can be estimated after atmospheric corrections. Diurnal warming, the thin thermal skin layer, and surface films can cause differences between skin and bulk temperatures measured by buoys. AVHRR provided continuous global SST data starting in 1978, revolutionizing oceanography.
LIDAR is an acronym for LIght Detection And Ranging. It is an optical remote sensing technology that can measure the distance to or other properties of a target by illuminating the target with light pulse to form an image.
The study of physical oceanography helps in understanding all these aspects in detail. Let us see most of these factors and processes in our future modules. Mathematical models of all these processes are also developed using these phenomena and mechanisms. The individual aspects of all the elements of physical oceanography are to be studied in detail.
A remote sensing system uses a detector to sense the reflected or emitted energy from the earth's surface, perhaps modified by the intervening atmosphere. The sensor can be on a satellite, aircraft, or drone. The sensor turns the energy into a voltage, which an analog to digital converter turns into a single integer value (called the Digital Number, or DN) for the energy. Alternatively a digital detector can store the DN directly. We can then display this value with an appropriate color to build up an image of the region sensed by the system. The DN represents the energy sensed by the sensor in a particular part of the electromagnetic spectrum, emitted or reflected from a particular region. The principles can also be applied to sonar imagery, especially useful in water where sound penetrates readily whereas electromagnetic energy attenuates rapidly.
Definitions,
Remote sensing systems can be active or passive: active systems put out their own source of energy (a large "flash bulb") whereas passive systems use solar energy reflected from the surface or thermal energy emitted by the surface. Active systems can achieve higher resolution.
Satellite resolution considers four things: spatial, spectral, radiometric, and temporal resolution.
Electromagnetic radiation and the atmosphere control many aspects of a remote sensing system.
Satellite orbits determine many characteristics of the imagery, what the satellite sees, and how often it revisits an area.
The signal to noise ratio is important for the design of remote sensing systems.
Satellite band tradeoffs.
Interpreting satellite reflectance patterns and images uses various statistical measures to assess surface properties in the image.
The colors used on the display are gray shading for single bands, and RGB for multi-band composites. We can also perform image merge and sharpening to combine the advantages of both panchromatic (higher spatial resolution) and color imagery (better differentiation of surface materials).
Keys for image analysis
Hyperspectral imagery
Spectral reflectance library--different materials reflect radiation differently
Passive remote sensing is a class of Remote Sensing that make use of Passive Remote Sensors. The sensors are used to detect natural radiations that are emitted by the object or by its surrounding areas. The most common source of energy that is measured by Passive Remote Sensors is “Reflected Sunlight”.
Basic Concepts, Explanation, and Application. Fundamental Remote Sensing; Advantage/ disadvantages, Imaging/non Imaging sensors, RAR and SAR, SAR Geometry, Resolutions in the microwave, Geometric Distortions in SAR, Polarization in SAR, Target Interaction, SAR Interferometry
hyperspectral remote sensing and its geological applicationsabhijeet_banerjee
this is an introductory presentation on hyperspectral remote sensing, which essential deals with the distinguishing features, imaging spectrometers and its types, and some of the geological applications of hyperspectral remote sensing.
This presentation consist of remote sensing, types of remote sensing and also about the radiometers systems. I have also discussed about the types of radiometers system and how it work. I have also discussed about the principle on which it works. Also I have discussed about the applications .
What is Remote Sensing?
Process of Remote Sensing
Electromagnetic Radiations
Electromagnetic Spectrum
Interaction with Atmosphere
Radiations-Target Interactions
Passive Vs Active Sensing
Presentation of GreenYourMove's hybrid approach in 3rd International Conferen...GreenYourMove
Presentation of the Journey planning problem and GreenYourMove's hybrid approach.
Dr. Georgios Saharidis, Fragogios Antonis, Rizopoulos Dimitris, Chrysostomos Chatzigeorgiou
Learn about IBM System x3650 M4. The x3650 M4 is an outstanding 2U two-socket business-critical server, offering improved performance and pay-as-you grow flexibility along with new features that improve server management capability. For more information on System x, visit http://ibm.co/Q7m3iQ.
http://www.scribd.com/doc/210741926/IBM-System-x3650-M4
Denver IT Support Company presents What is Cloud Computing? Answering Questio...North Star. Inc.
What is Cloud Computing? Answering Questions About Cloud Power for Small Business by your Denver IT Support Specialists at North Star, Inc.
Visit http://www.nssit.com
Presentation designed by Social Media Virtual Assistant: Andrea Kalli at www.virtualassist.net
07 April Giovanni Nico: Application seminar: high resolution weather maps
An applicative seminar on augmenting meteorological analysis with remote sensing observations
Geothermal exploration using remote sensing techniquesSepideh Abadpour
On these slides, I have spoken about applications of remote sensing in geothermal exploration. Unfortunately I've done it when I was pursuing my bachelors, so the citations are not correct but it will give you some ideas.
Any feedback is welcome
Weather & environmental changes affect RF signal severely. Ducting is one of the environmental phenomena that heavily deteriorate the radio performance. This document will give some ideas on root cause, impact & solutions of ducting on Radio Performance.
earth is being cover with the blanket of gases called atmosphere which is further divided into 4 layers troposphere, stratosphere, mesosphere and thermospere
each layer is made up of some chemical constituents which could be water molecule traces of gases etc, Japan has done research and send a satellite in space to observe it as describe in this presentation
Instruments for solar radiation measurement
Empirical equation for prediction of availability of solar radiation
Radiation on tilted surface
Types of solar collectors
kushsshah.blogspot.com
The French Revolution, which began in 1789, was a period of radical social and political upheaval in France. It marked the decline of absolute monarchies, the rise of secular and democratic republics, and the eventual rise of Napoleon Bonaparte. This revolutionary period is crucial in understanding the transition from feudalism to modernity in Europe.
For more information, visit-www.vavaclasses.com
We all have good and bad thoughts from time to time and situation to situation. We are bombarded daily with spiraling thoughts(both negative and positive) creating all-consuming feel , making us difficult to manage with associated suffering. Good thoughts are like our Mob Signal (Positive thought) amidst noise(negative thought) in the atmosphere. Negative thoughts like noise outweigh positive thoughts. These thoughts often create unwanted confusion, trouble, stress and frustration in our mind as well as chaos in our physical world. Negative thoughts are also known as “distorted thinking”.
Palestine last event orientationfvgnh .pptxRaedMohamed3
An EFL lesson about the current events in Palestine. It is intended to be for intermediate students who wish to increase their listening skills through a short lesson in power point.
Read| The latest issue of The Challenger is here! We are thrilled to announce that our school paper has qualified for the NATIONAL SCHOOLS PRESS CONFERENCE (NSPC) 2024. Thank you for your unwavering support and trust. Dive into the stories that made us stand out!
Instructions for Submissions thorugh G- Classroom.pptxJheel Barad
This presentation provides a briefing on how to upload submissions and documents in Google Classroom. It was prepared as part of an orientation for new Sainik School in-service teacher trainees. As a training officer, my goal is to ensure that you are comfortable and proficient with this essential tool for managing assignments and fostering student engagement.
Unit 8 - Information and Communication Technology (Paper I).pdfThiyagu K
This slides describes the basic concepts of ICT, basics of Email, Emerging Technology and Digital Initiatives in Education. This presentations aligns with the UGC Paper I syllabus.
This is a presentation by Dada Robert in a Your Skill Boost masterclass organised by the Excellence Foundation for South Sudan (EFSS) on Saturday, the 25th and Sunday, the 26th of May 2024.
He discussed the concept of quality improvement, emphasizing its applicability to various aspects of life, including personal, project, and program improvements. He defined quality as doing the right thing at the right time in the right way to achieve the best possible results and discussed the concept of the "gap" between what we know and what we do, and how this gap represents the areas we need to improve. He explained the scientific approach to quality improvement, which involves systematic performance analysis, testing and learning, and implementing change ideas. He also highlighted the importance of client focus and a team approach to quality improvement.
1. IoE 184 - The Basics of Satellite Oceanography. 4. Oceanographic Applications: Infrared Sensors
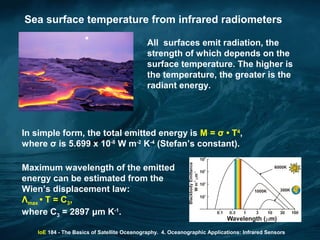
Sea surface temperature from infrared radiometers
All surfaces emit radiation, the
strength of which depends on the
surface temperature. The higher is
the temperature, the greater is the
radiant energy.
In simple form, the total emitted energy is M = σ • T4
,
where σ is 5.699 x 10⁻⁸
W m-2
K-4
(Stefan’s constant).
Maximum wavelength of the emitted
energy can be estimated from the
Wien’s displacement law:
Λmax • T = C3,
where C3 = 2897 μm K-1
.
2. IoE 184 - The Basics of Satellite Oceanography. 4. Oceanographic Applications: Infrared Sensors
Sea surface temperature from infrared radiometers
In practice, the measured brightness
temperature differs from the actual
temperature of the observed surface
because of non-unit emissivity and
the effect of the intervening
atmosphere.
For infrared (IR) radiation the
emissivity (i.e., the ratio between
real exitance and a perfect emitter at
this temperature) of sea surface is
between 0.98 and 0.99.
The brightness temperature of the radiation is defined as the tempe-
rature of the black body which would emit the measured radiance.
The brightness temperature: a descriptive measure of radiation in
terms of the temperature of a hypothetical blackbody emitting an
identical amount of radiation at the same wavelength.
3. IoE 184 - The Basics of Satellite Oceanography. 4. Oceanographic Applications: Infrared Sensors
Sea surface temperature from infrared radiometers
At 10 μm, solar emittance is about 300 times the
sea emittance. However, as a result of the
distance between the sun and the earth, the solar
irradiance reaching the top of the atmosphere is
about 10-5
of its value near the solar surface, that
is about 1/300 of the sea surface emittance.
The atmosphere is
most transparent to
infrared at 3.5-4.1 μm
and 10.0-12.5 μm.
At 3.7 μm, the incoming solar irradiance is the same order as the
surface emittance. As a result, this wavelength can be used during
nighttime only.
4. Sea surface temperature from infrared radiometers
IoE 184 - The Basics of Satellite Oceanography. 4. Oceanographic Applications: Infrared Sensors
For IR sensor calibration, a target of known temperature is used.
This temperature is measured and transmitted to ground receiving
station along with the signal measured by the IR sensor.
Atmospheric correction is based on multispectral approach, when
the differences between brightness temperatures measured at
different wavelengths are used to estimate the contribution of the
atmosphere to the signal (more detail later, in AVHRR section).
For cloud detection, the thermal and near-infrared waveband
thresholds are used, as well as different spatial coherency tests.
5. IoE 184 - The Basics of Satellite Oceanography. 4. Oceanographic Applications: Infrared Sensors
Sea surface temperature from infrared radiometers
Interpretation of Sea Surface Temperature
The actual thickens of the layer whose temperature is remotely
sensed varies between 3 and 14 µm. It is called skin SST and
written Tskin or sometimes SSST.
At the same time, the measured in situ SST (called also bulk SST)
corresponds to at least few centimeters or more, depending on
waves. The SST measurements on buoys may be anything
between 0.5 and 3 m deep.
Three physical effects may increase the difference between skin and
bulk SSTs:
1) Diurnal thermocline;
2) Thermal skin layer effect;
3) The presence of surface film.
6. IoE 184 - The Basics of Satellite Oceanography. 4. Oceanographic Applications: Infrared Sensors
Sea surface temperature from infrared radiometers
Interpretation of Sea Surface Temperature
Diurnal thermocline
As a result of insolation, daytime
temperature in the upper layer of up to
50 cm can differ from deeper layers as
much as 4°C.
Since open skies are part of the requirement of diurnal warming,
there is a higher probability of daytime satellite observations
encountering diurnal warming events.
To control this effect, we should analyze the differences between
day and night satellite SST observations.
The bulk SST (i.e., the parameter we are measuring) is invariant
over the diurnal cycle.
7. IoE 184 - The Basics of Satellite Oceanography. 4. Oceanographic Applications: Infrared Sensors
Sea surface temperature from infrared radiometers
Interpretation of Sea Surface Temperature
Diurnal thermocline
Wind plays an important role in the erosion of diurnal thermocline,
transporting heat to the deep layers.
After Yokoyama et al., 1995)
8. IoE 184 - The Basics of Satellite Oceanography. 4. Oceanographic Applications: Infrared Sensors
Sea surface temperature from infrared radiometers
Interpretation of Sea Surface Temperature
The thermal skin layer of the ocean surface
Heat flux from ocean surface to the atmosphere results in decrease of
the skin temperature.
This effect is observed during both day and night.
The difference between the skin and the sub-skin temperature is
typically –0.17ºC at wind speed >5 m s-1
. At lower wind speeds, the
picture is more complex, resulting from heat flux, which is different
during day and night, humidity, swell, etc.
The skin layer is very robust. Experiments show that if the surface is
completely broken and the skin is destroyed, for example by breaking
wave, the skin layer reforms again in a few seconds.
9. IoE 184 - The Basics of Satellite Oceanography. 4. Oceanographic Applications: Infrared Sensors
Sea surface temperature from infrared radiometers
Interpretation of Sea Surface Temperature
Effect of surface film
Surface film may be a naturally produced organic material or oil from
shipping.
When the slick is thicker than a single layer of molecules, the emitted
radiance and the resulting brightness temperature are lower.
A surface slick affects the thermal structure of the near-surface,
inhibiting wind mixing and increasing diurnal thermocline. The slick
also reduces evaporation. Moreover, a thick oil slick absorbs solar
radiation effectively and becomes warmer than the underlying sea
water.
With such a variety of opposing effects, it is not possible to predict
whether the observed radiation temperature will be reduced or
increased by a slick.
15. 16wavelength
Sensitivity of brightness to
change in blackbody
temperature
brightness of
300K blackbody
Brightness
temperature difference
due to atmosphere
3.5 μm 10 μm 12 μm
16. 17
Night time and strong winds
(day or night) case
Day time weak winds case
See also Fig 7.4 in Martin
17. IoE 184 - The Basics of Satellite Oceanography. 4. Oceanographic Applications: Infrared Sensors
Sea surface temperature from infrared radiometers
The monitoring of sea
surface temperature
(SST) from earth-orbiting
infrared radiometers had
the widest impact on
oceanographic science.
First of all, this impact resulted from regular and continuous supply
of information by AVHRR (Advanced Very High Resolution
Radiometer) on NOAA satellites since 1978.
Advanced Very High Resolution Radiometers (AVHRR)
18. IoE 184 - The Basics of Satellite Oceanography. 4. Oceanographic Applications: Infrared Sensors
Sea surface temperature from infrared radiometers
VHRR (Very High Resolution Radiometer) used before had just one
visible and one infrared channel.
AVHRR (Advanced Very High Resolution Radiometer) was first
mounted on TIROS-N (Television Infrared Observation Satellite) in
1978.
NOAA-11
The satellites of NOAA
series are near-polar
sun-synchronous
satellites.
19. IoE 184 - The Basics of Satellite Oceanography. 4. Oceanographic Applications: Infrared Sensors
Sea surface temperature from infrared radiometers
Temporal coverage of NOAA satellites with AVHRR
Satellite
Number
Launch
Date
Ascending
Node
Descending
Node
Service Dates
TIROS-N 10/13/78 1500 0300 10/19/78
01/30/80
NOAA-6 06/27/79 1930 0730 06/27/79
11/16/86
NOAA-7 06/23/81 1430 0230 08/24/81
06/07/86
NOAA-8 03/28/83 1930 0730 05/03/83
10/31/85
NOAA-9 12/12/84 1420 0220 02/25/85
05/11/94
NOAA-10 09/17/86 1930 0730 11/17/86
Present
NOAA-11 09/24/91 1340 0140 09/24/91
09/13/94
22. IoE 184 - The Basics of Satellite Oceanography. 4. Oceanographic Applications: Infrared Sensors
Sea surface temperature from infrared radiometers
Sensor characteristics
The scanner has an IFOV of approximately 1.3 mrads and a cross-
track scan of ±55.4º. With a nominal height of 833 km the ground
FOV in nadir is 1.1 km and the swath width about 2500 km.
The orbit period is about 102 min and 14 orbits are completed per
day.
The swath of adjacent orbits overlap, ensuring that the whole Earth
surface is viewed at least twice a day, once from the ascending
(daylight) passes and once from the descending (night)
overpasses.
23. IoE 184 - The Basics of Satellite Oceanography. 4. Oceanographic Applications: Infrared Sensors
Sea surface temperature from infrared radiometers
The ratio between near-infrared and infrared wavebands, called
Normalized Digital Vegetation Index (NDVI) is a wide-used method
of the analysis of land vegetation.
24. IoE 184 - The Basics of Satellite Oceanography. 4. Oceanographic Applications: Infrared Sensors
Sea surface temperature from infrared radiometers
AVHRR observations
of sea surface
temperature (SST) are
very important for
oceanographers,
because they enable
the analysis of spatial
and temporal
variations of ocean
currents.
At this image you see
the Gulf Stream
Current in North
Atlantic.
25. IoE 184 - The Basics of Satellite Oceanography. 4. Oceanographic Applications: Infrared Sensors
Sea surface temperature from infrared radiometers
AVHRR data are acquired in three formats:
High Resolution Picture Transmission (HRPT)
HRPT data are full resolution image data transmitted to a ground
station as they are collected.
Local Area Coverage (LAC)
LAC are also full resolution data, but recorded with an on-board
tape recorder for subsequent transmission during a station
overpass.
Global Area Coverage (GAC)
GAC data provide daily subsampled global coverage recorded on the
tape recorders and then transmitted to a ground station.
26. IoE 184 - The Basics of Satellite Oceanography. 4. Oceanographic Applications: Infrared Sensors
Sea surface temperature from infrared radiometers
The data are collected in several scientific centers:
EROS - Earth Resources Observation Systems data
center;
EDC - Earth Resources Observation Systems Data
Center;
NOAA/NESDIS - National Environmental Satellite, Data and
Information Service of National Oceanic and
Atmospheric Administration;
And some others.
27. IoE 184 - The Basics of Satellite Oceanography. 4. Oceanographic Applications: Infrared Sensors
Sea surface temperature from infrared radiometers
Processing steps:
Georegistration:
The position of the satellite
is determined by an orbital
model updated by
ephemeris data (a table of
predicted satellite orbital
locations for specific time
intervals) received daily
from NAVY Space
Surveillance.
A refinement to the sensor model accounts for the displacement in
longitude due to the rotation of the Earth under the satellite.
The positional accuracy of a systematic georegistration is
approximately 5000 m.
28. IoE 184 - The Basics of Satellite Oceanography. 4. Oceanographic Applications: Infrared Sensors
Sea surface temperature from infrared radiometers
Processing steps - Georegistration :
To avoid georegistration errors like shown above, more precise
georegistration methods are applied, which can achieve a positional
accuracy of 1000 m (I.e., 1 IFOV).
The method includes correlation of image features with accurately
registered cartographic or image-based maps, extracting easily
identifiable features such as coastlines, water bodies, and rivers and
correlating them with the matching raw image locations using
various techniques.
29. IoE 184 - The Basics of Satellite Oceanography. 4. Oceanographic Applications: Infrared Sensors
Sea surface temperature from infrared radiometers
Processing steps - Georegistration :
30. IoE 184 - The Basics of Satellite Oceanography. 4. Oceanographic Applications: Infrared Sensors
Sea surface temperature from infrared radiometers
Processing steps – Calculating SST on the example of MCSST
algorithm
The idea of the first step of atmospheric correction in Multi-Channel
Sea Surface Temperature (MCSST) algorithm is that the contribution
of the atmosphere water vapor to the signal is different at different
channels.
We assume that the temperature deficit in one channel, which
results from atmospheric absorption by water vapor, is a linear
function of the brightness temperature difference of the two different
channels.
SST = A + B * (T1 – T2) + T1
.
31. IoE 184 - The Basics of Satellite Oceanography. 4. Oceanographic Applications: Infrared Sensors
Sea surface temperature from infrared radiometers
Processing steps – Calculating SST on the example of MCSST
algorithm
During daytime observations the channels 11 and 12 µm are used:
SST = 1.0346 * T11
+ 2.5779 * (T11
-T12
) - 283.21;
During nighttime we can also use the channel 3.7 µm, which during
daytime is contaminated with sunlight:
SST1
= 1.5018 * T3.7
- 0.4930 * T11
- 273.34;
SST2
= 3.6139 * T11
- 2.5789 * T12
- 283.18;
SST3
= 1.0170 * T11
+ 0.9694 * (T3.7
- T12
) - 276.58;
(SST in degrees Celsius, T in degrees Kelvin).
32. IoE 184 - The Basics of Satellite Oceanography. 4. Oceanographic Applications: Infrared Sensors
Sea surface temperature from infrared radiometers
Processing steps – Calculating SST on the example of MCSST
algorithm
Atmospheric correction:
1. Visible or IR reflectance
test (during daytime only):
The reflectance of the cloud-
free ocean as measured at a
satellite is generally less
than 10%, whereas the
reflectance of the most
clouds is greater than 50%.
33. IoE 184 - The Basics of Satellite Oceanography. 4. Oceanographic Applications: Infrared Sensors
Sea surface temperature from infrared radiometers
Processing steps – Calculating SST on the example of MCSST
algorithm
Atmospheric correction:
2. Uniformity test
Threshold of the variation of
measurement values from
adjacent cloud-free field of
view is set to be slightly in
excess of instrumental
noise. With partially cloud-
filled fields of view, the
variations are generally
larger.
34. IoE 184 - The Basics of Satellite Oceanography. 4. Oceanographic Applications: Infrared Sensors
Sea surface temperature from infrared radiometers
Processing steps – Calculating SST on the example of MCSST
algorithm
Atmospheric correction:
3. Channel intercomparison test.
At night three independent measures of SST can be obtained from
different channels:
SST1
= 1.5018 * T3.7
- 0.4930 * T11
- 273.34;
SST2
= 3.6139 * T11
- 2.5789 * T12
- 283.18;
SST3
= 1.0170 * T11
+ 0.9694 * (T3.7
- T12
) - 276.58;
When the contribution of the atmosphere is too strong, the
difference between SST1, SST2 and SST3 exceeds the assumed
threshold and the resulting SST is marked as invalid.
35. IoE 184 - The Basics of Satellite Oceanography. 4. Oceanographic Applications: Infrared Sensors
Sea surface temperature from infrared radiometers
Processing steps – Calculating SST on the example of MCSST
algorithm
Atmospheric correction:
4. The retrieved SSTs are compared with climatology and with SSTs
retrieved using alternative algorithms.
First, the SST is subject to “unreasonableness” test, i.e., SST must
be within the range from 2ºC to +35ºC.
Second, the retrieved SST must pass a climatology test, meaning
that it must agree with monthly climatology at its location within
10ºC.
As a result, 80–90% of AVHRR pixels are considered cloudy.
36. IoE 184 - The Basics of Satellite Oceanography. 4. Oceanographic Applications: Infrared Sensors
Sea surface temperature from infrared radiometers
The AVHRR data obtained during one week contain many areas
where no data was collected due to cloud cover.
37. IoE 184 - The Basics of Satellite Oceanography. 4. Oceanographic Applications: Infrared Sensors
Sea surface temperature from infrared radiometers
The zones where the observations are absent can be filled with
interpolated data, but the validity of these data is doubtful.
38. IoE 184 - The Basics of Satellite Oceanography. 4. Oceanographic Applications: Infrared Sensors
Sea surface temperature from infrared radiometers
During recent years AVHRR data are step-by-step reanalyzed within
“Pathfinder” Project at NASA Jet Propulsion Laboratory (JPL) using
sophisticated algorithm bases on numerous contact measurements
of sea surface temperature.
39. IoE 184 - The Basics of Satellite Oceanography. 4. Oceanographic Applications: Infrared Sensors
Sea surface temperature from infrared radiometers
Sea Surface Temperatures obtained during daytime and nighttime
are essentially different and should not be compared at the series of
images. This difference results from not only the daytime
thermocline, but from different algorithms also.
40. IoE 184 - The Basics of Satellite Oceanography. 4. Oceanographic Applications: Infrared Sensors
Sea surface temperature from infrared radiometers
Sea Surface Temperatures have been derived from the series of
NOAA's Geostationary Operational Environmental Satellites
(GOES).
The data set includes data from two satellites: GOES East
(GOES-10) and GOES West (GOES-12).
Gridded Level 3 SSTs with a nominal spatial resolution of 6 km
are available between 180W to 30W and 45S to 60N.
41. IoE 184 - The Basics of Satellite Oceanography. 4. Oceanographic Applications: Infrared Sensors
Sea surface temperature from infrared radiometers
Each satellite is equipped with GOES Imager radiometer which
collects information on 5 channels (1 visible and 4 infrared).
The scans are every hour, IFOV is 4 km.
Brightness temperatures
from the 5-channel
instrument are regressed
against buoy data to derive a
set of coefficients. These
coefficients are then used to
convert the brightness
temperatures to an SST
measurement. The theory
itself is very similar to the
non-linear algorithm used to
process AVHRR-derived
SSTs.
42. IoE 184 - The Basics of Satellite Oceanography. 4. Oceanographic Applications: Infrared Sensors
Sea surface temperature from infrared radiometers
43. IoE 184 - The Basics of Satellite Oceanography. 4. Oceanographic Applications: Infrared Sensors
Sea surface temperature from infrared radiometers
CoastWatch sea surface temperature data source and software
http://coastwatch.pfel.noaa.gov/
The CoastWatch
Internet site is an
example of satellite
data source.
This site provides AVHRR SST data along the West Coast of USA
during few recent months.
44. 45
MODIS sea surface temperature (SST)
Band
Number
Wavelength
(nm)
Band
Width
(nm)
Spatial
Resolution
(m)
NEdT
22 3959 60 1000 0.07
23 4050 60 1000 0.07
31 11000 60 1000 0.05
32 12000 60 1000 0.05
• longwave SST (11-12 µm), day and night
• shortwave SST (3.9 - 4.0 µm), night only
• SST quality level (0-4)
• brightness temperatures (all thermal λ)
thermal band
suite:
related ocean
products:
45. 46
Level-2 SST processing
(1) convert observed radiances to brightness temperatures (BTs)
(2) apply empirical algorithm to relate brightness temperature in 2 wavelengths
to SST
sst = a0 + a1*BT1 + a2*(BT2-BT1) + a3*(1.0/µ-1.0)
(3) assess quality (0=best, 4=not computed)
* e.g., cloud or residual water vapor contamination
* no specific “cloud mask”
51. 52
Shortwave SST
sst4 = a0 + a1*BT39 + a2*dBT + a3*(1.0/µ-1.0)
where:
BT39 = brightness temperature at 3.959 um, in deg-C
BT40 = brightness temperature at 4.050 um, in deg-C
µ = cosine of sensor zenith angle
dBT = BT39 - BT40
a0, a1, a2, a3 - fit coefficients derived
derived by regression of MODIS BTs with in situ buoys
vary seasonally (probably due to residual water-vapor effects)
determined by science team PI (Peter Minnett and Univ. Miami
staff)
52. 53
Longwave SST
dBT <= 0.5
sst = a00 + a01*BT11 + a02*dBT*bsst + a03*dBT*(1.0/µ-1.0)
dBT >= 0.9
sst = a10 + a11*BT11 + a12*dBT*bsst + a13*dBT*(1.0/µ-1.0)
0.5 < dBt < 0.9
sstlo = a00 + a01*BT11 + a02*dBT*bsst + a03*dBT*(1.0/µ-1.0)
ssthi = a10 + a11*BT11 + a12*dBT*bsst + a13*dBT*(1.0/µ-1.0)
sst = sstlo + (dBT-0.5)/(0.9-0.5)*(ssthi-sstlo)
where:
BT11 = brightness temperature at 11 um, in deg-C
BT12 = brightness temperature at 12 um, in deg-C
bsst = baseline SST, which is either sst4 (if valid) or sstref (from oisst)
dBT = BT11 - BT12
µ = cosine of sensor zenith angle
Editor's Notes
T-bar atmos characteristic temperature
Tb buoy bulk temperature 0.3 to 1 m deep
Ts skin temperature