Downloaded 59 times


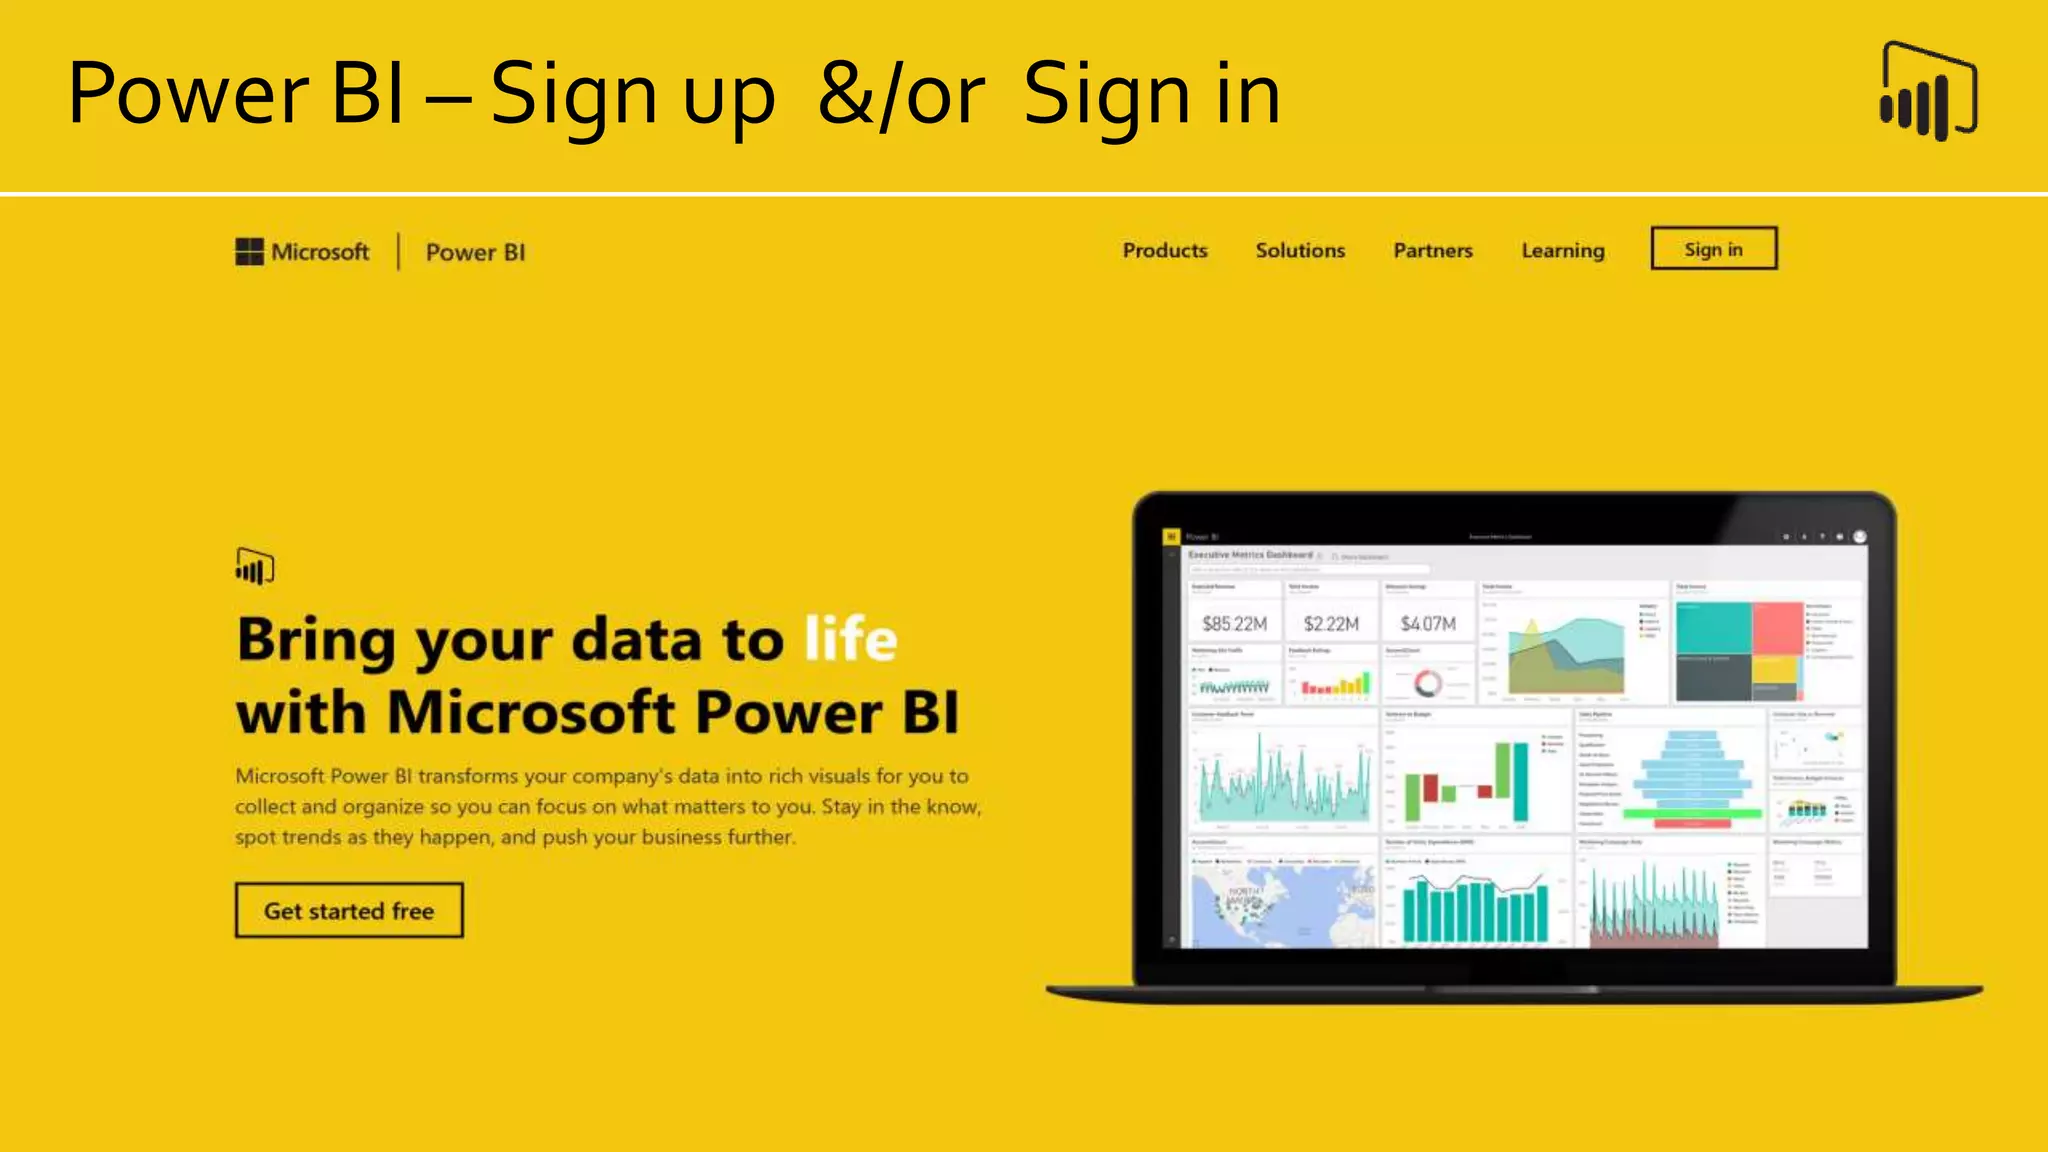
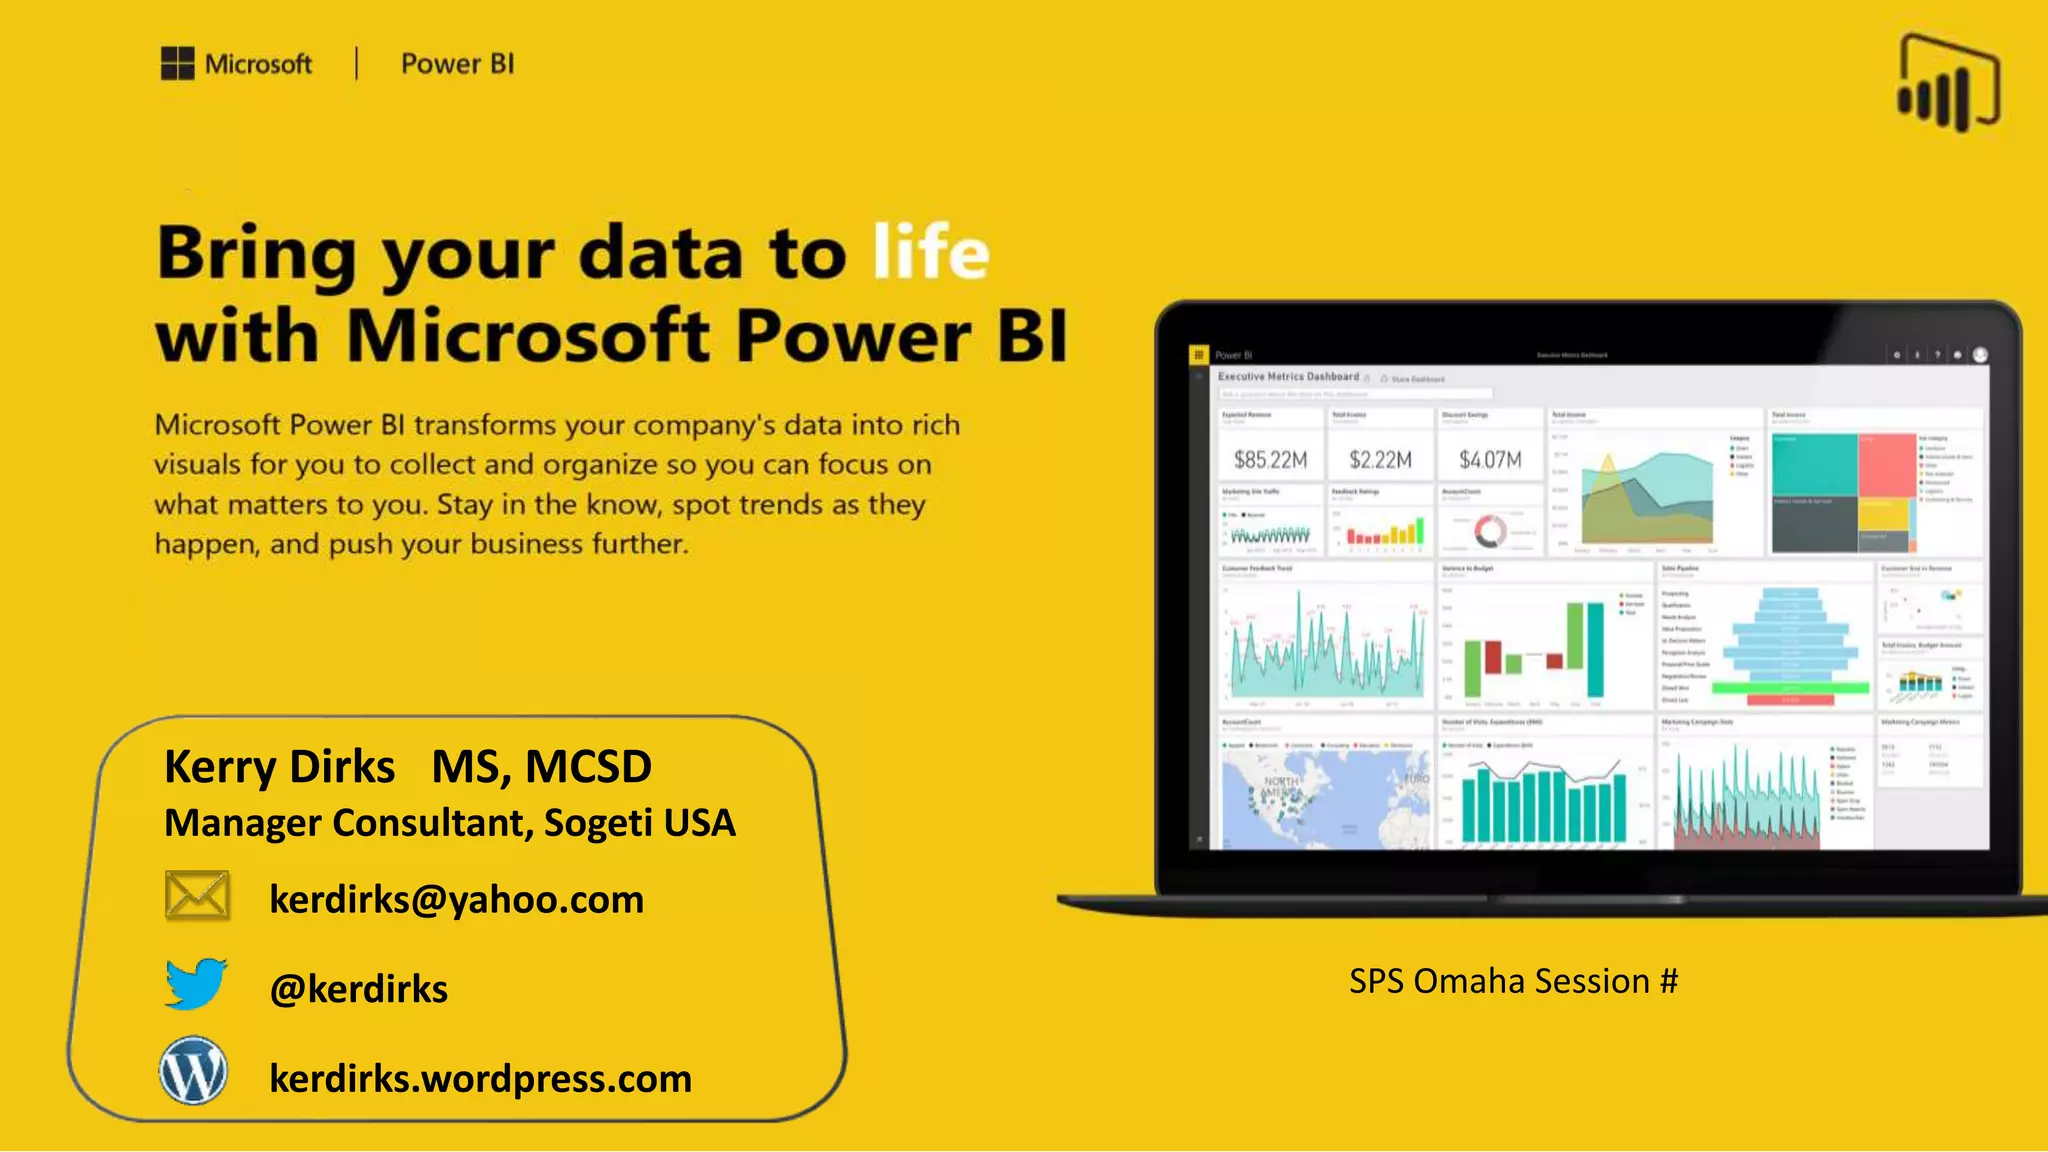
![PBI transforms your company's data into rich visuals
[for you to collect and organize] so you can …
Power BI (PBI)
Focus on
what matters
[to you]
By clearing
the clutter
Stay in
the know
With real-
time data
Spot trends
as they
happen
With
insights
Push your
business
further
Competitive
advantage](https://image.slidesharecdn.com/fd54e542-d4ed-4993-a5ff-f52788c09832-160416114142/75/SPS-Power-BI-Introduction-7-2048.jpg)
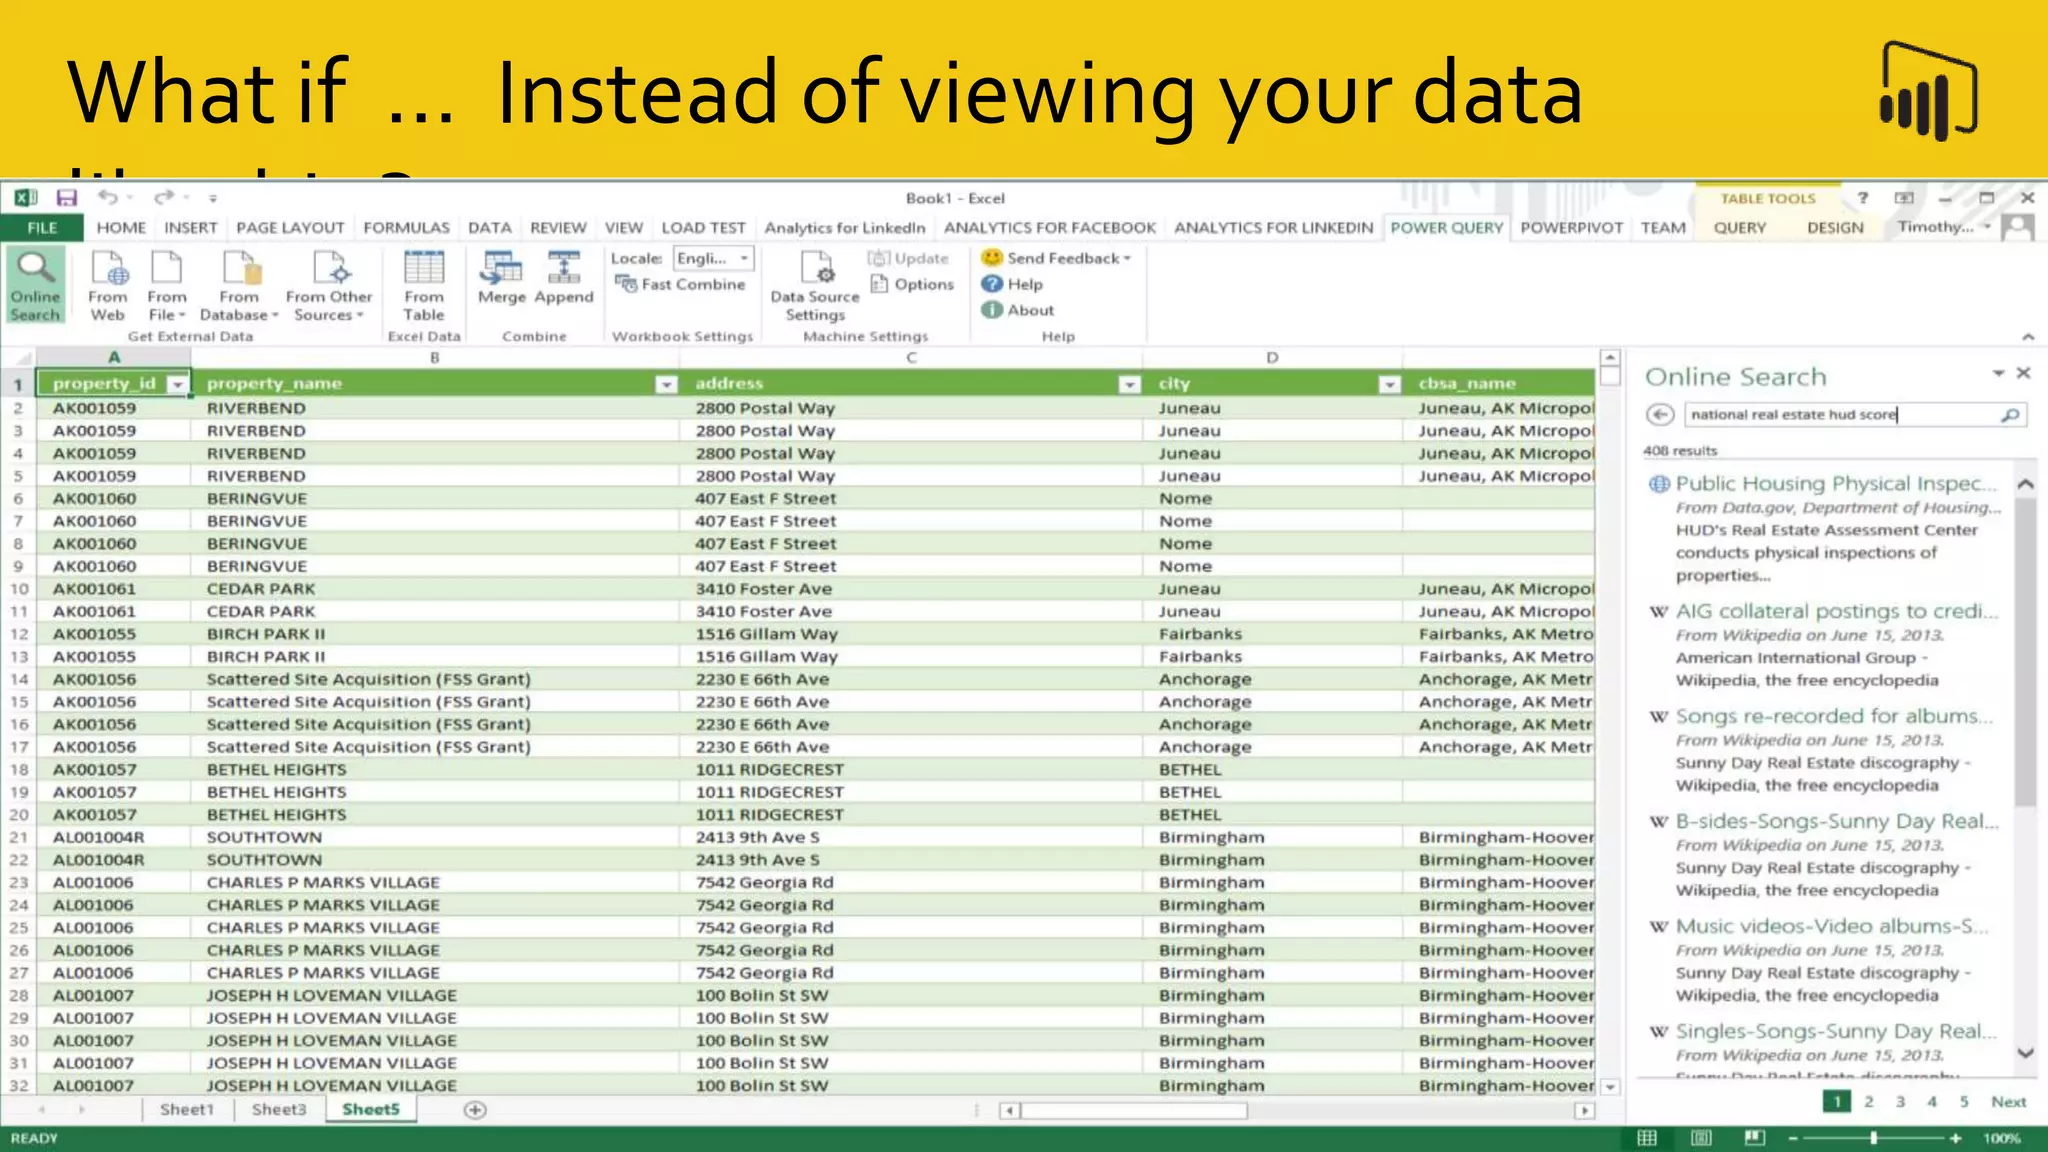
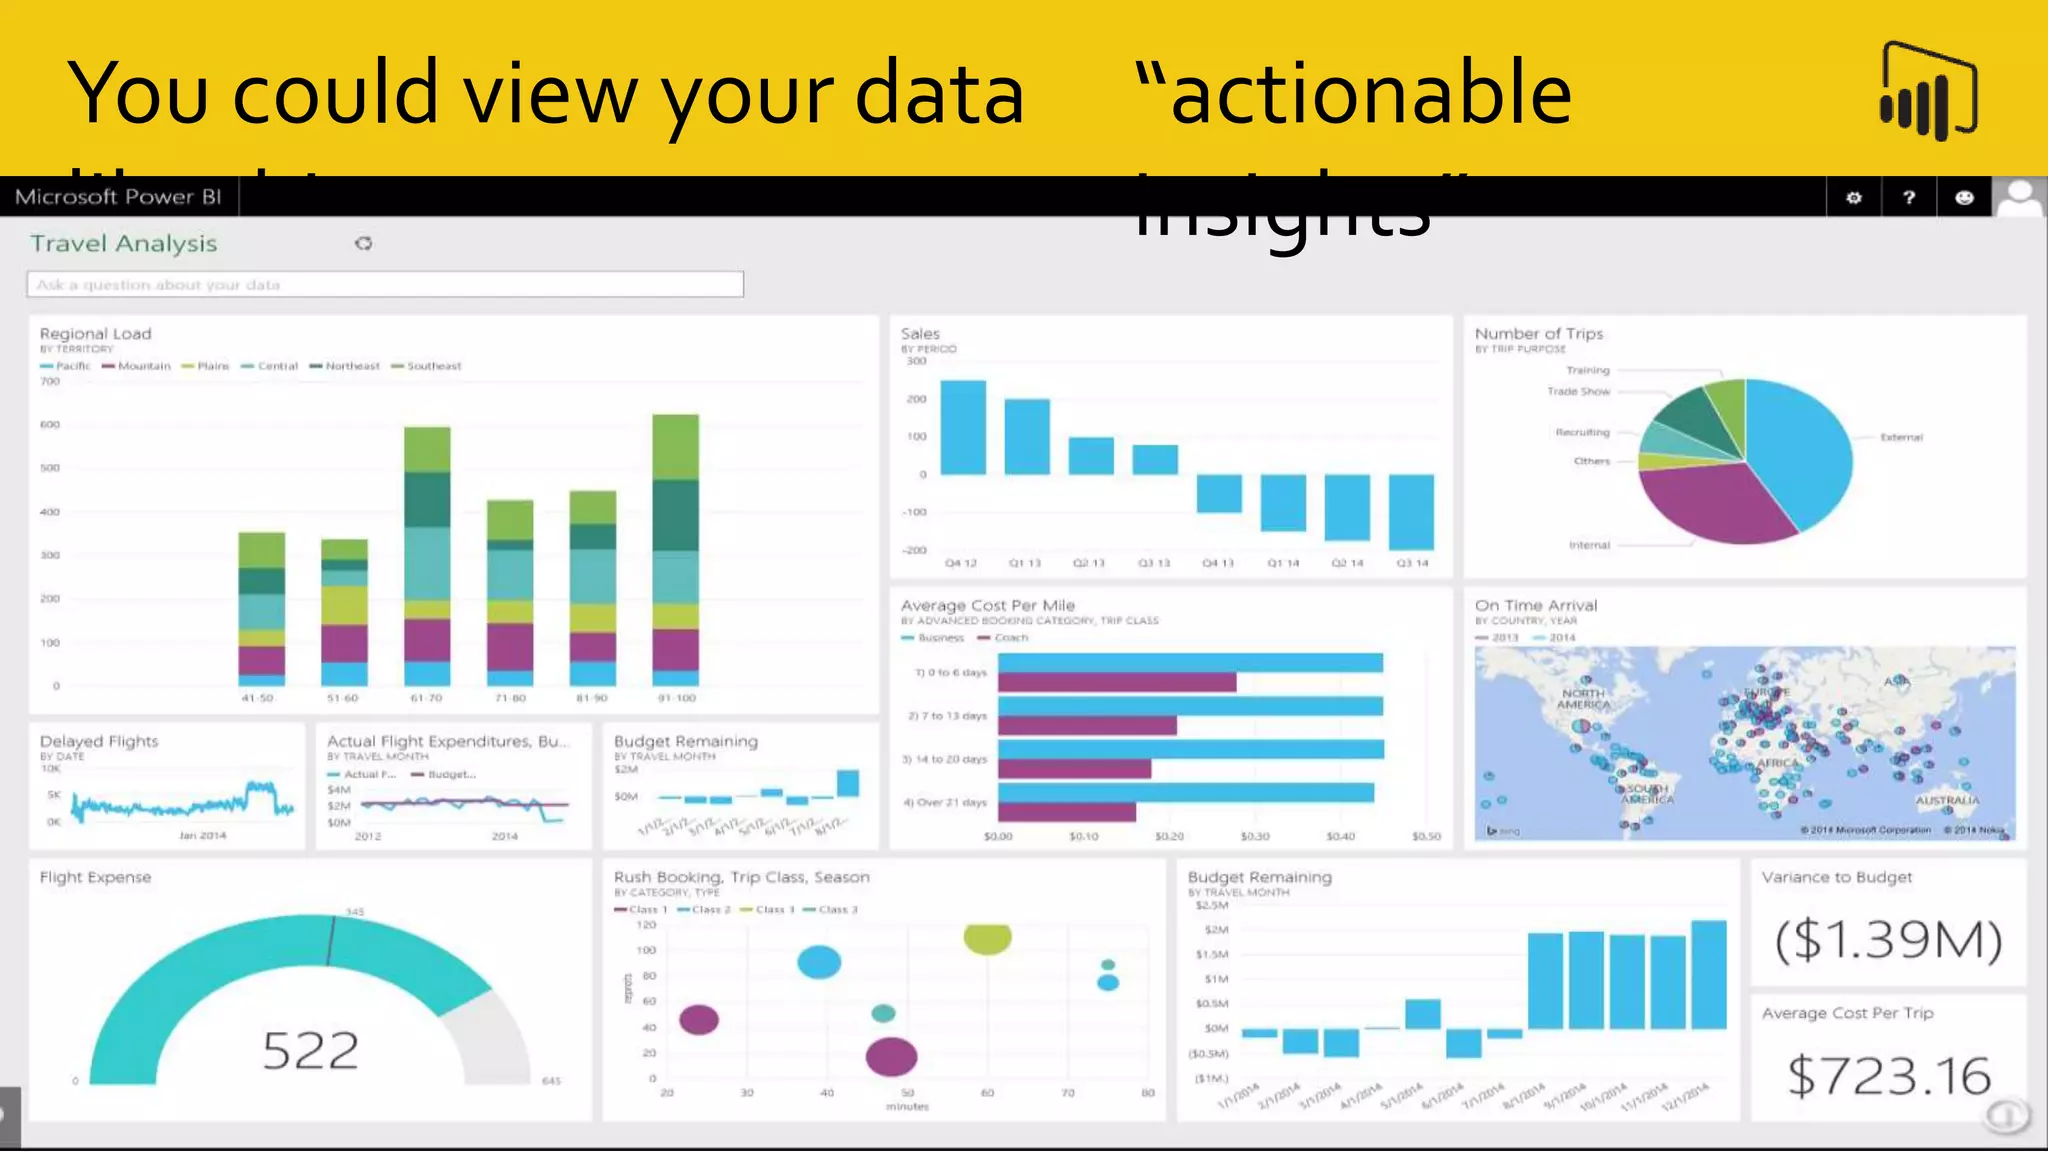
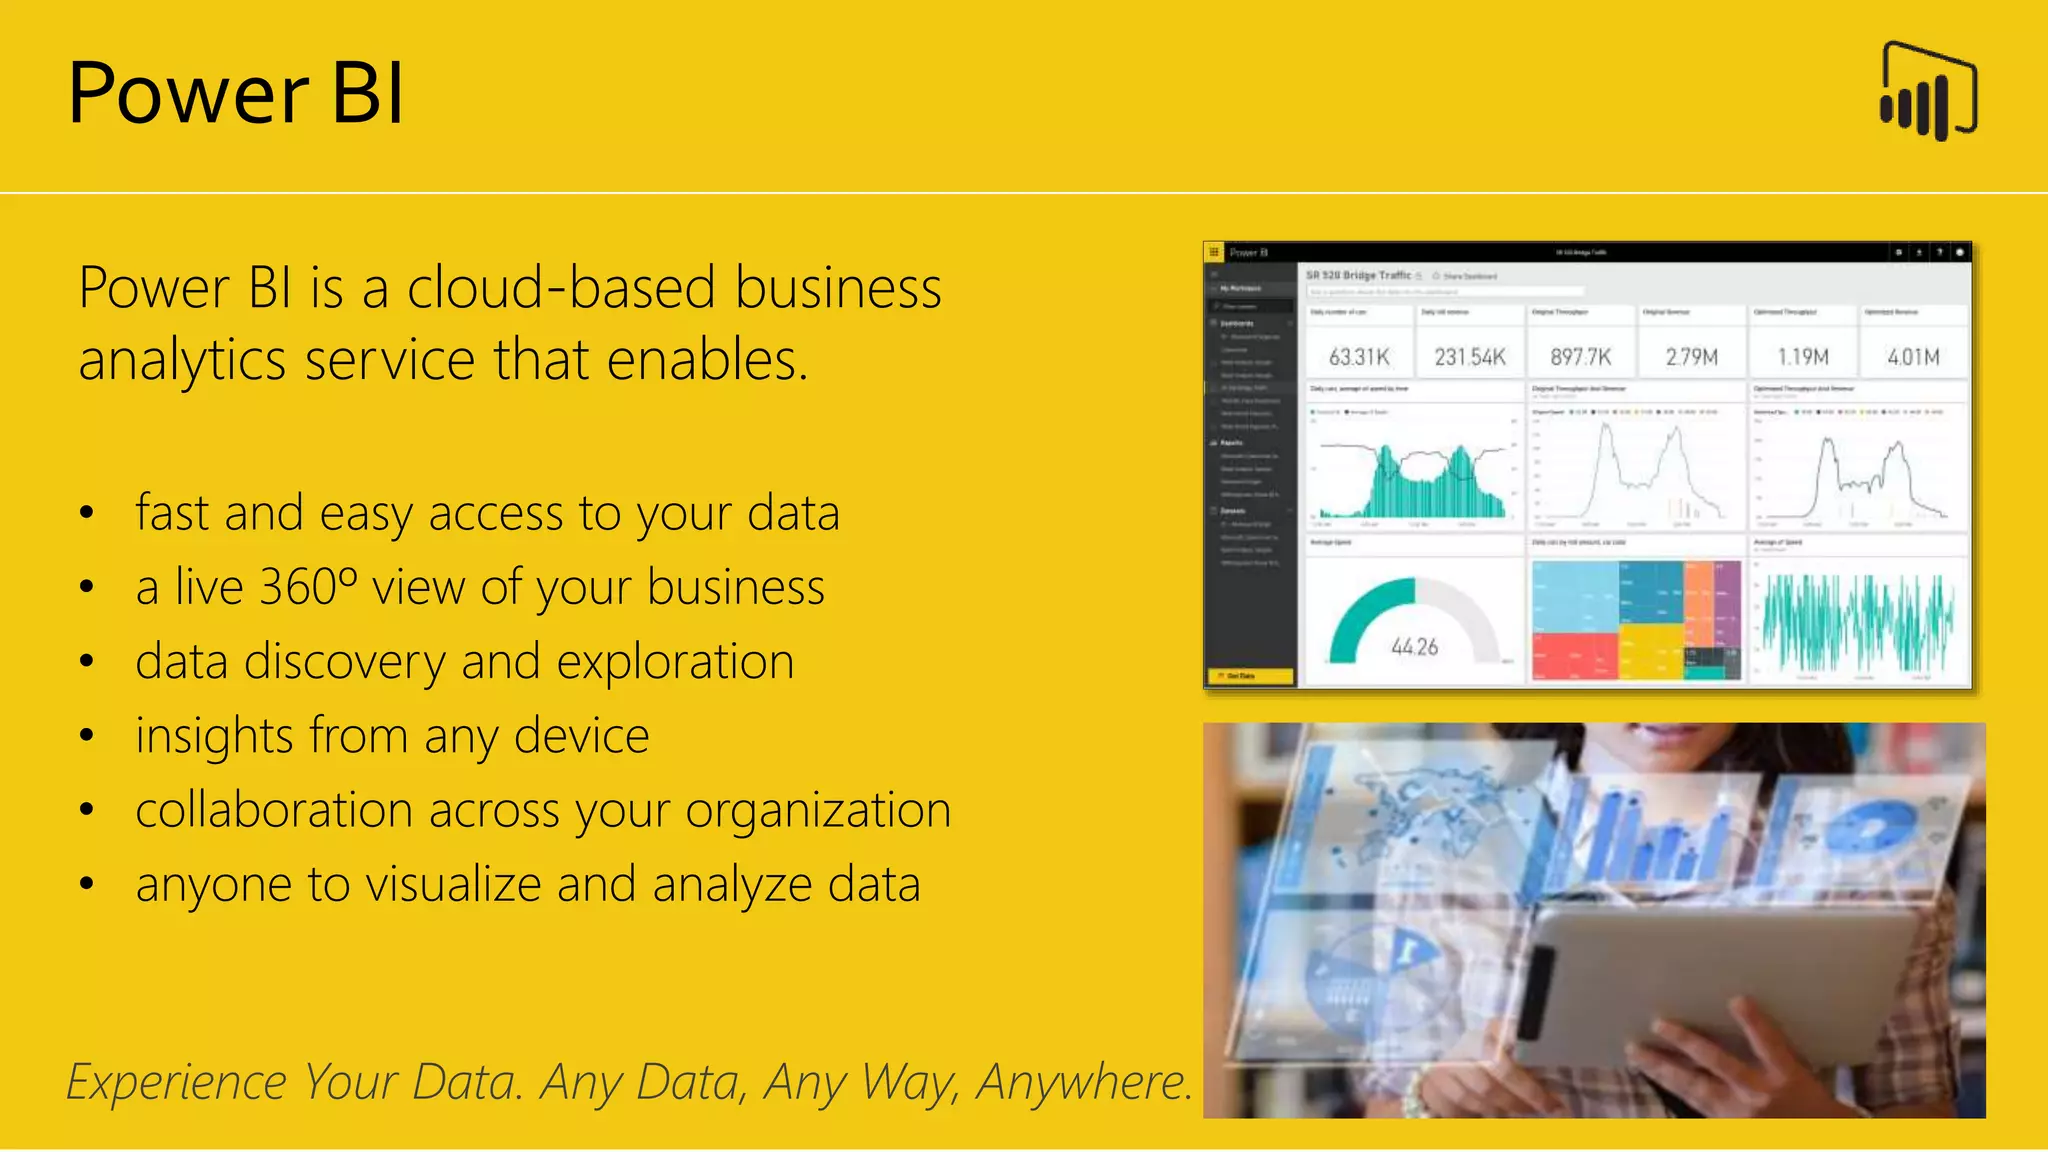
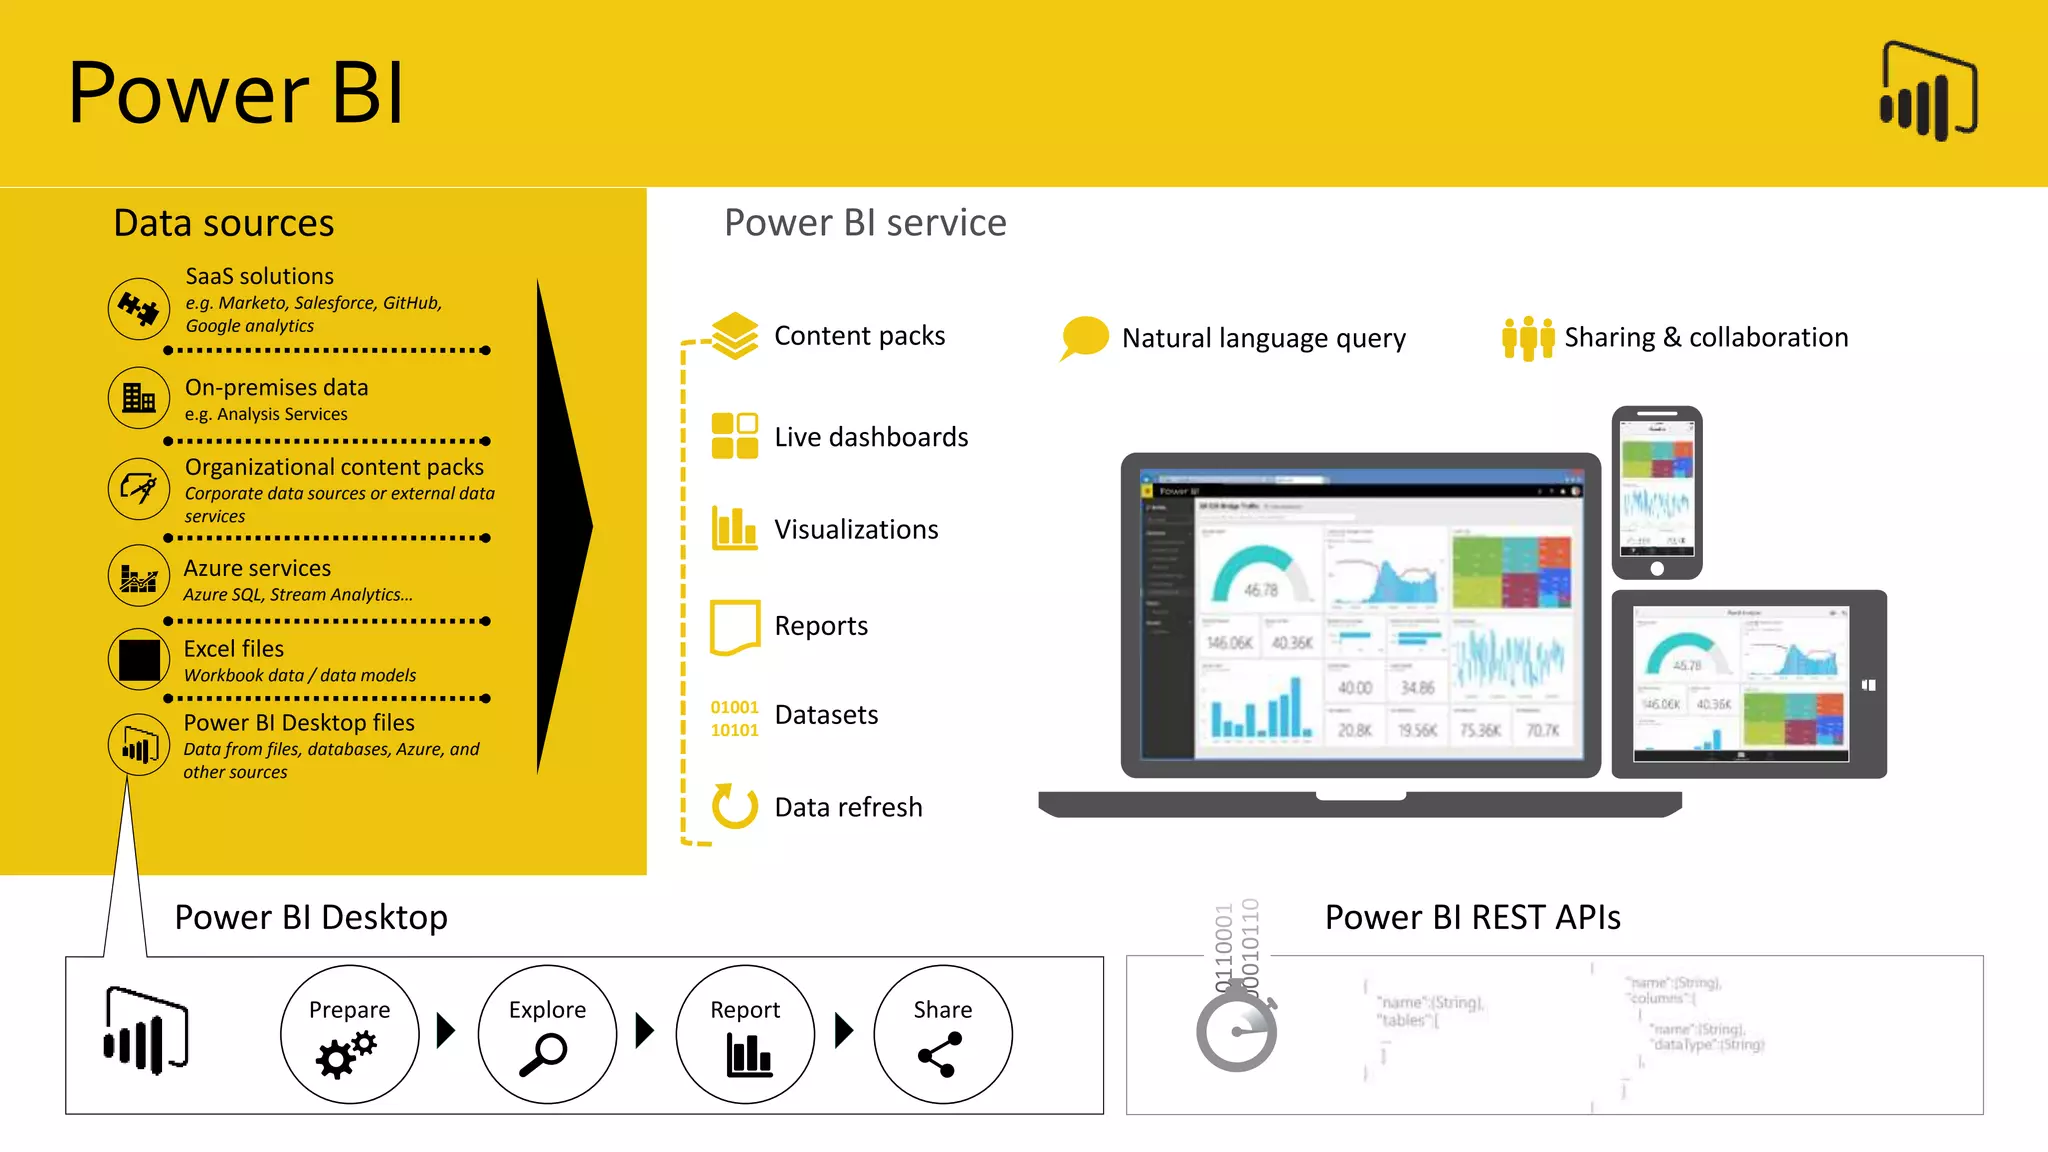
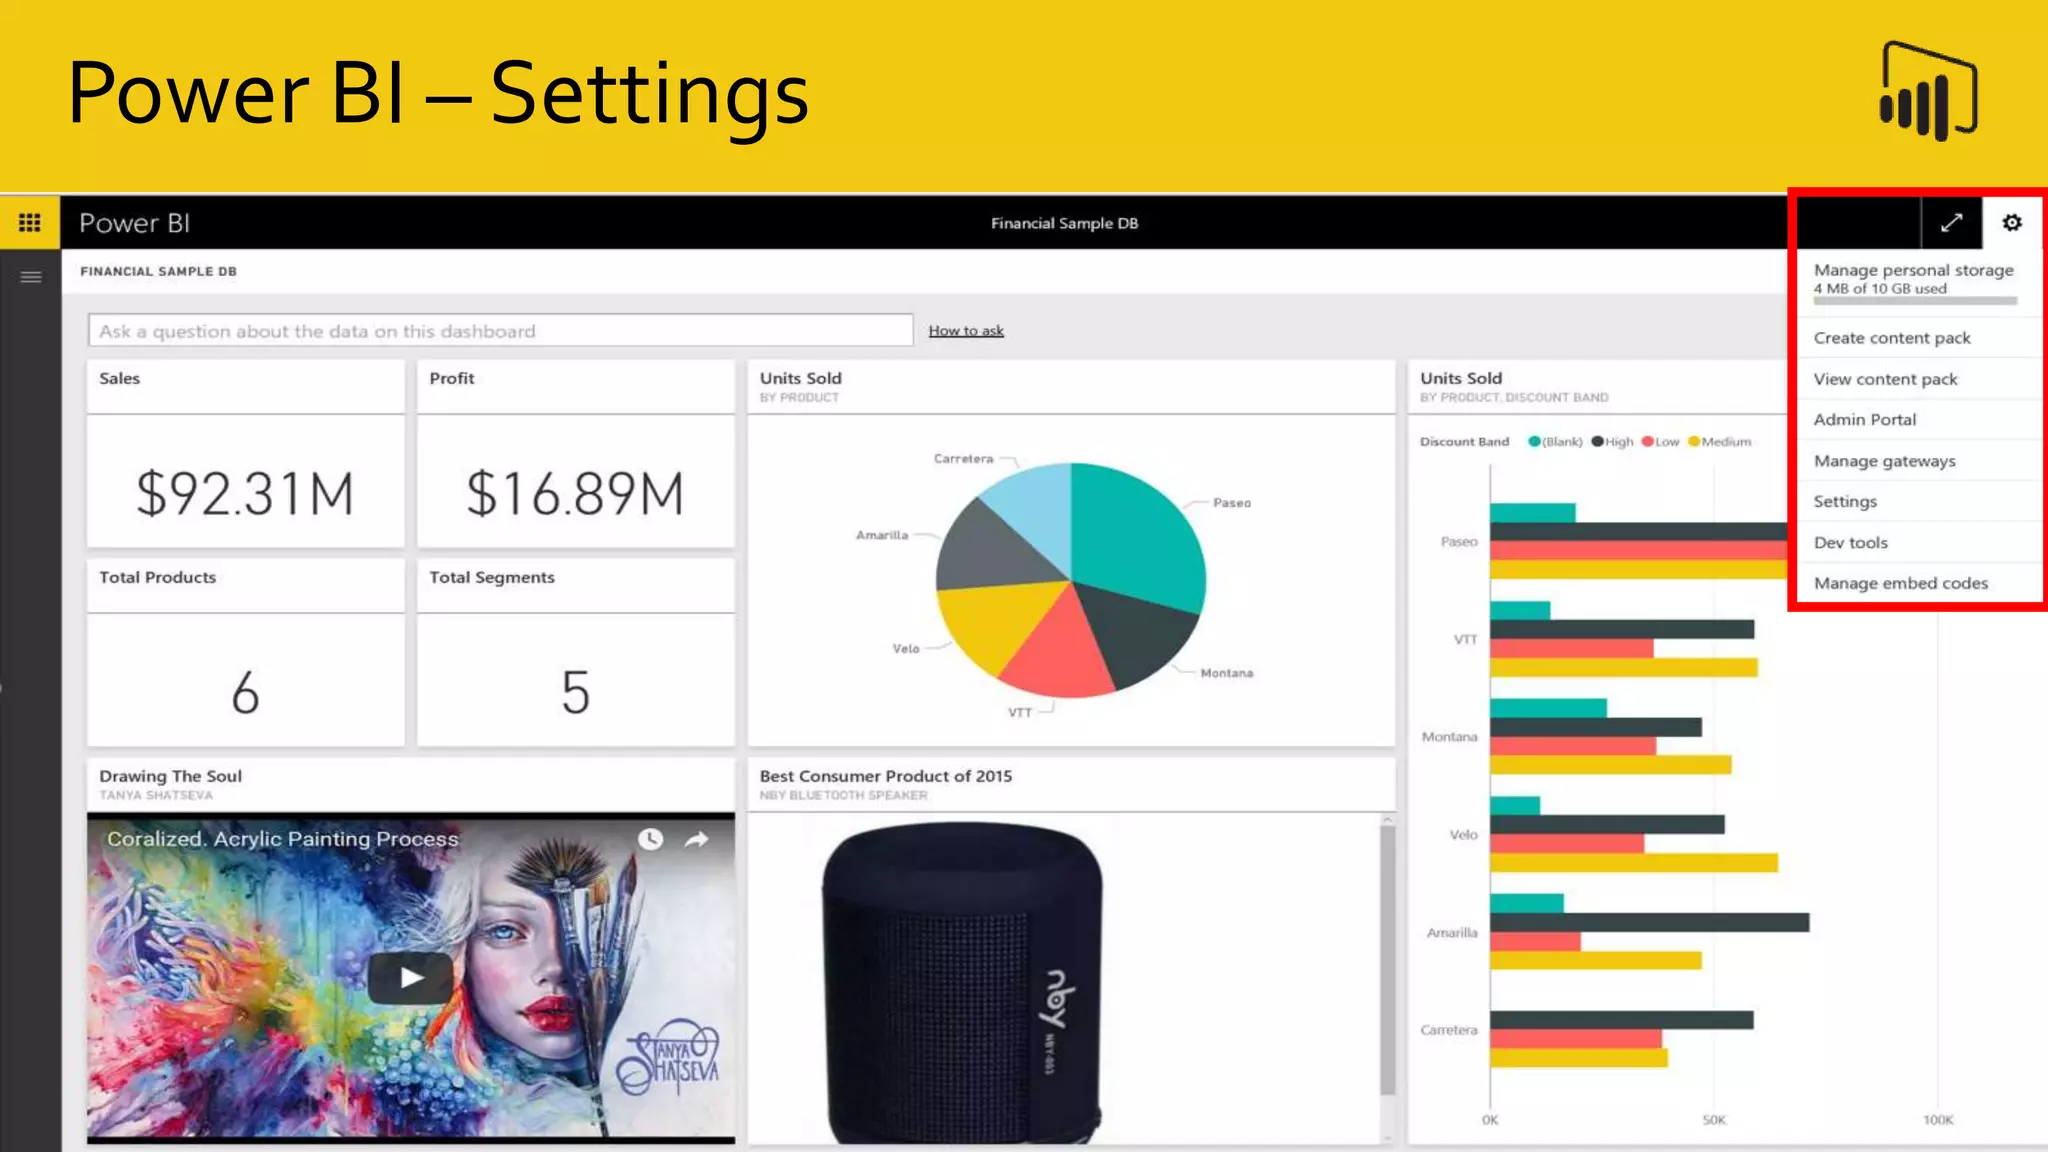


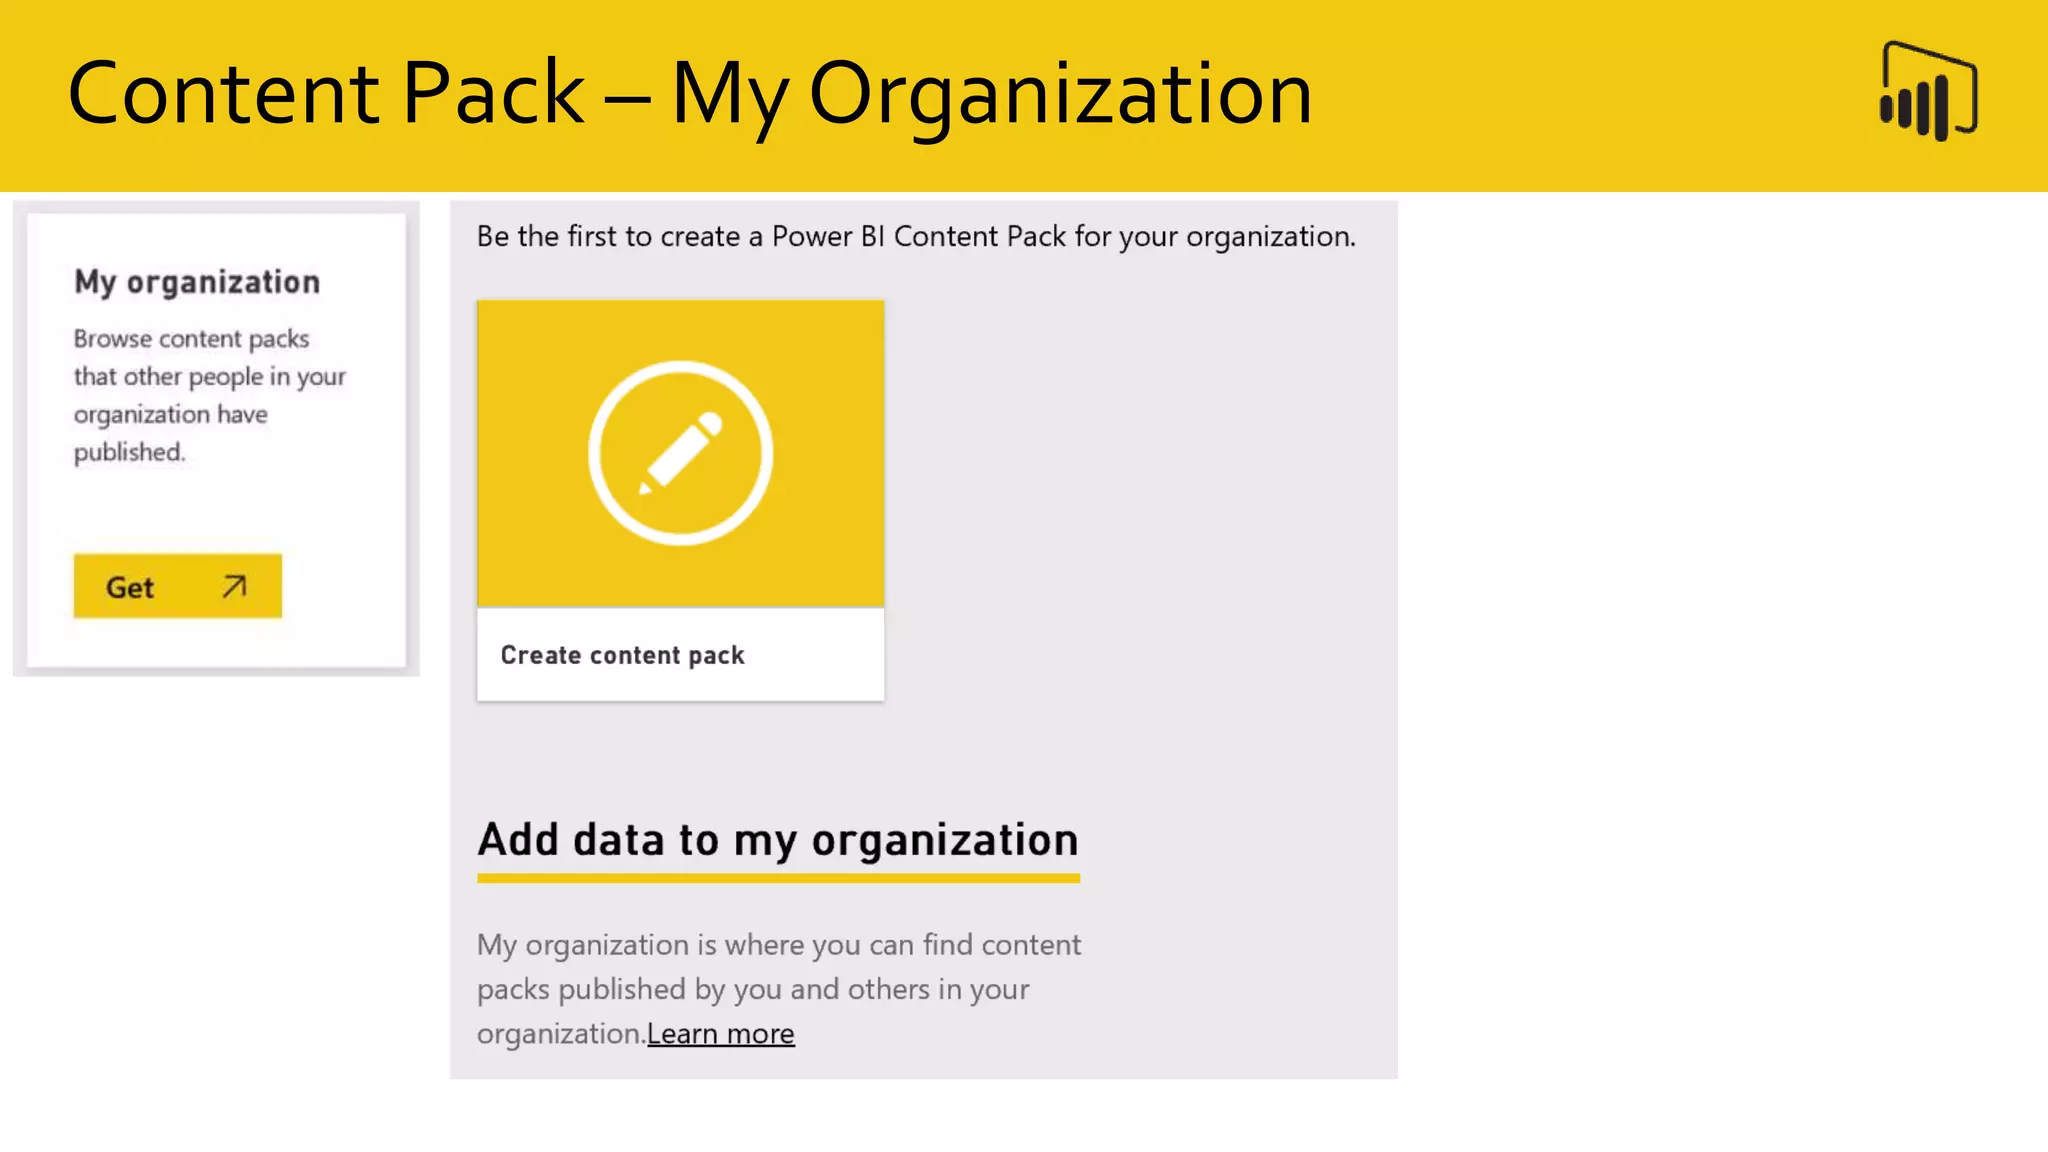
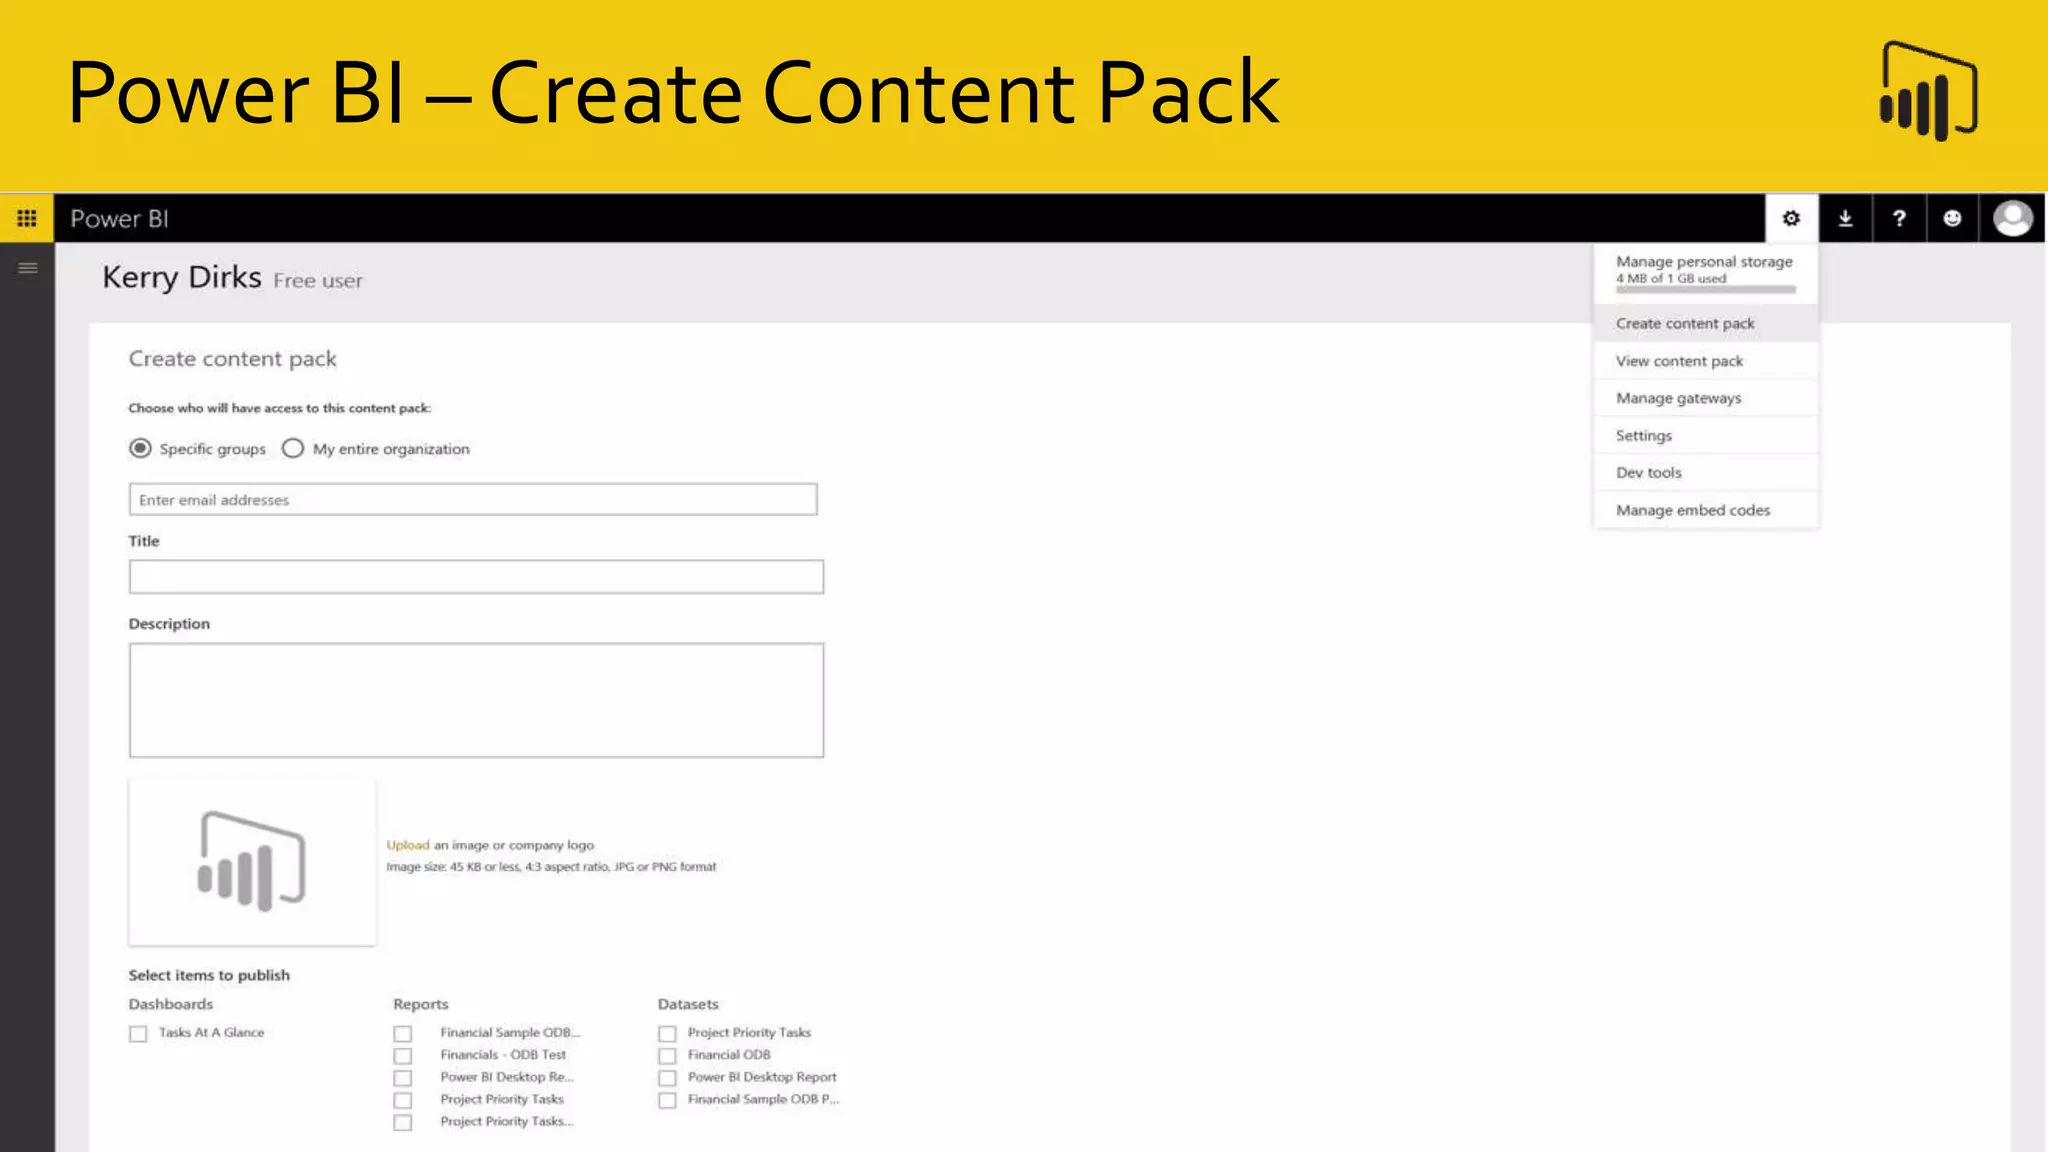
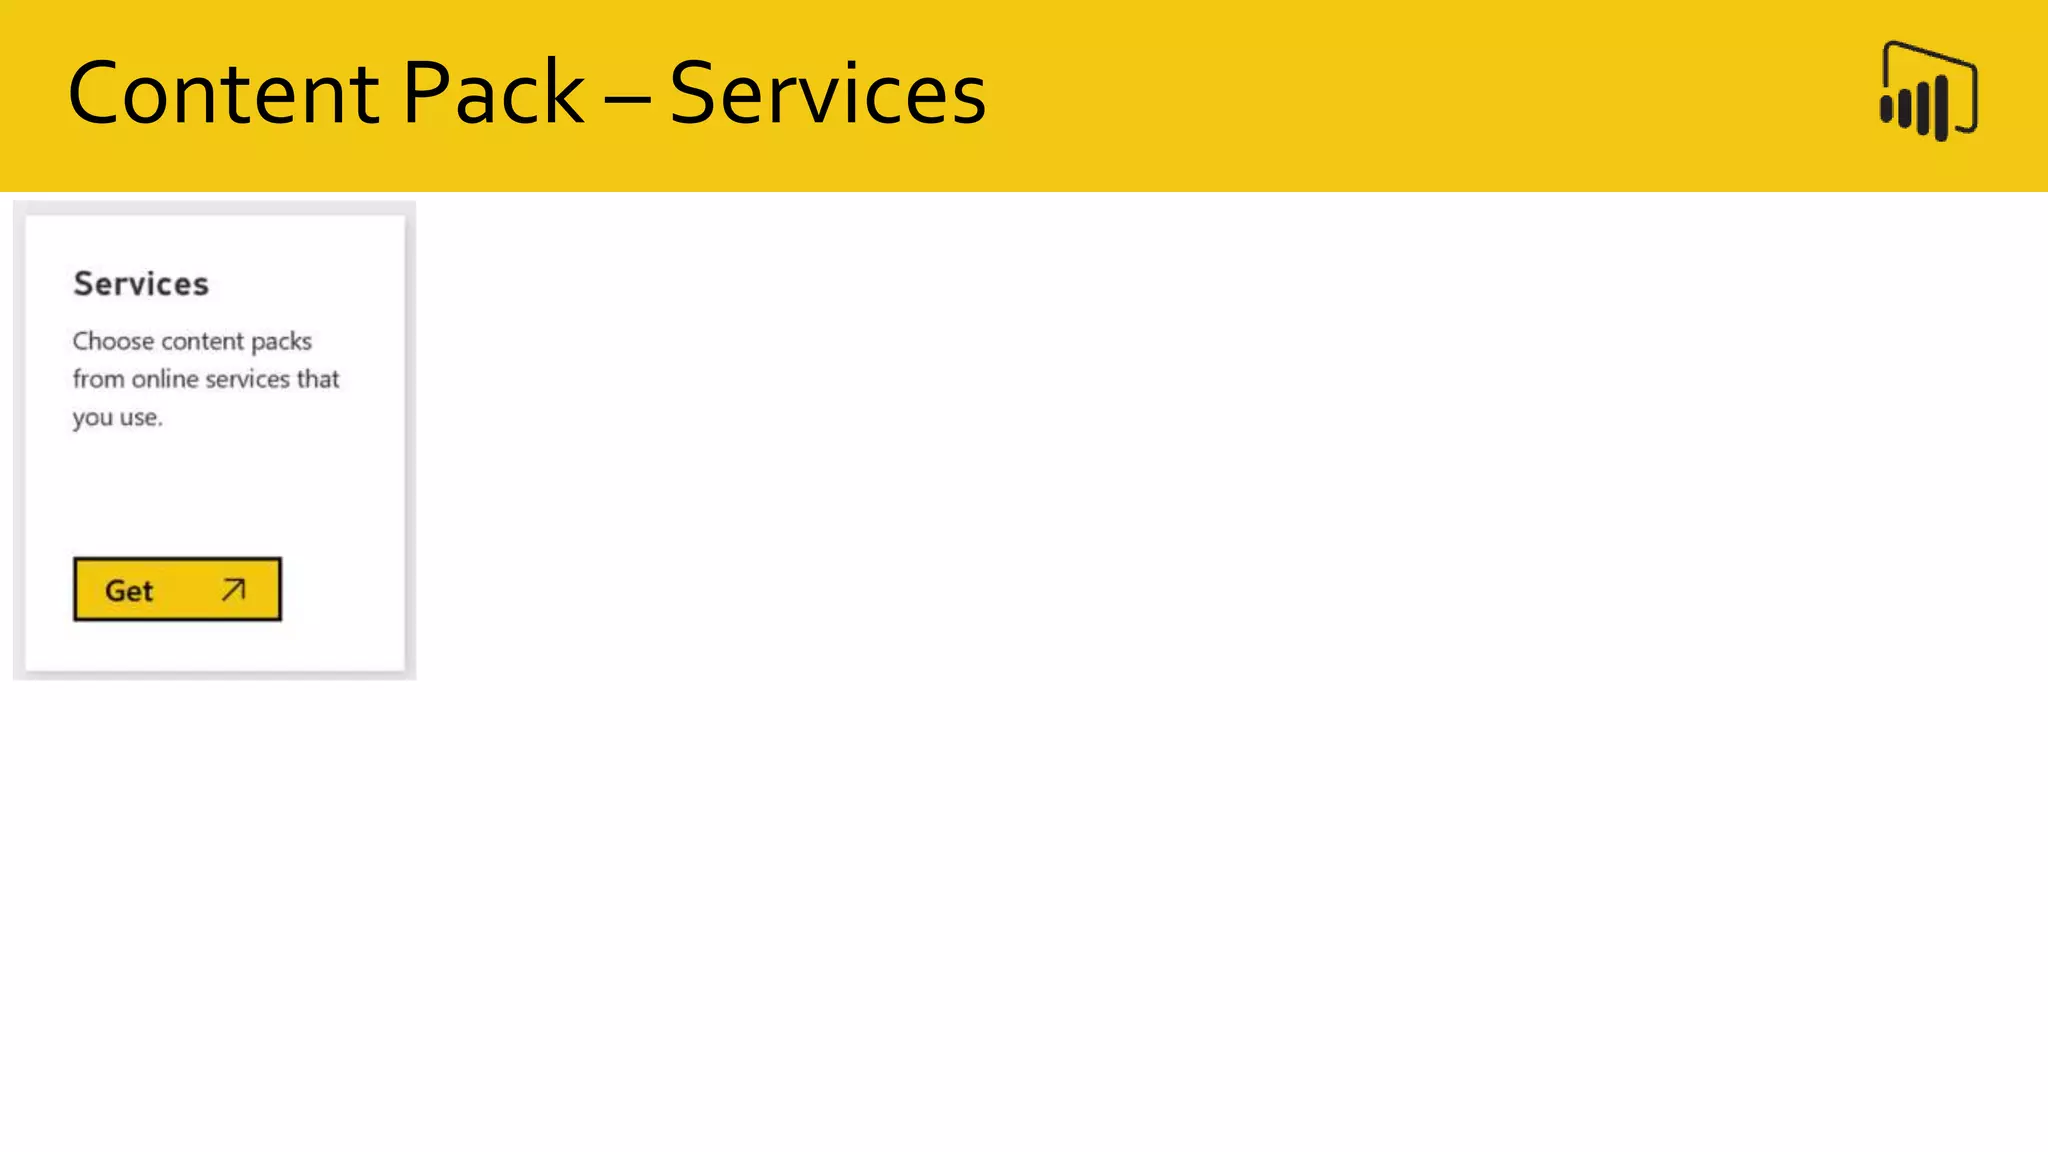
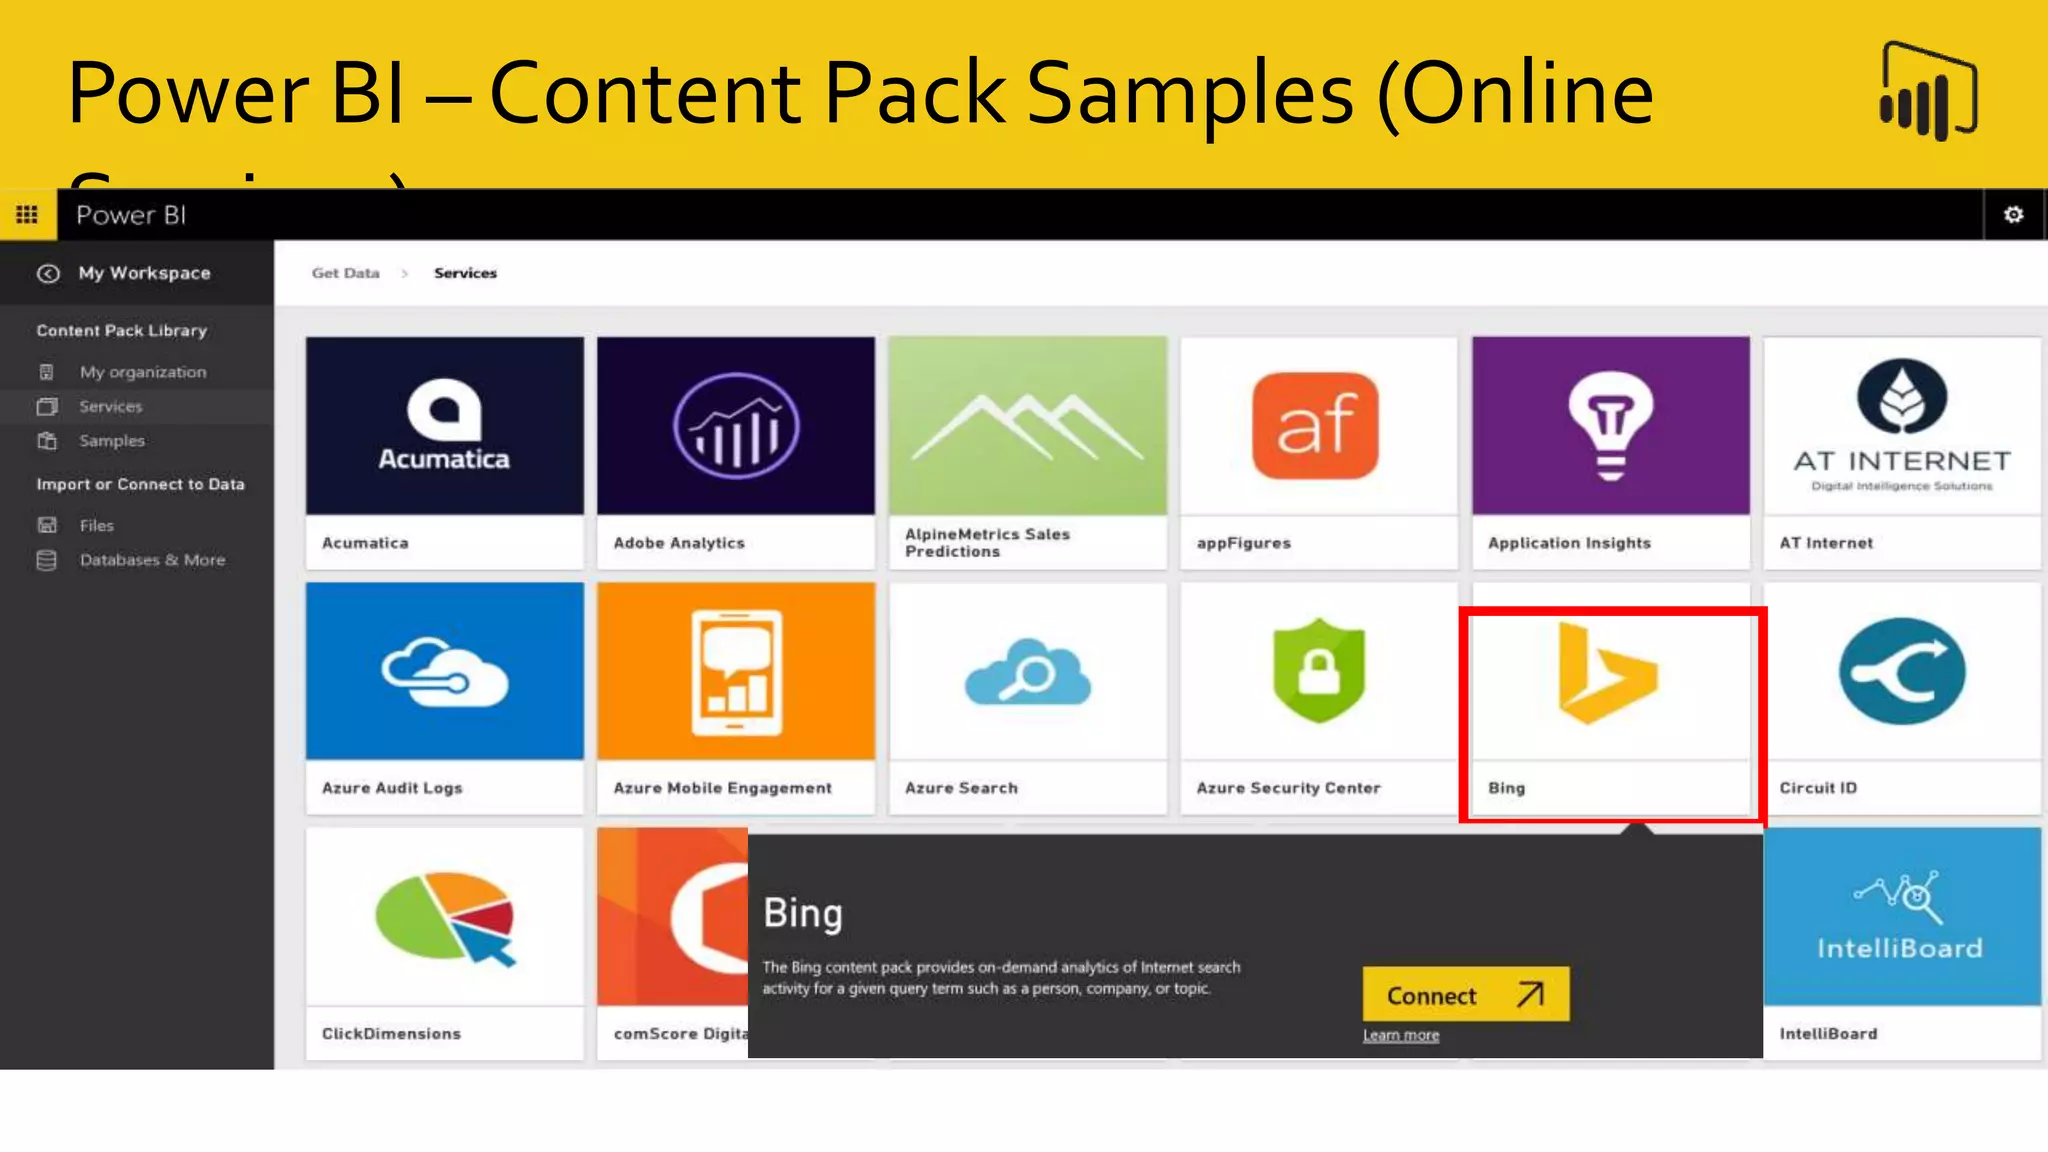
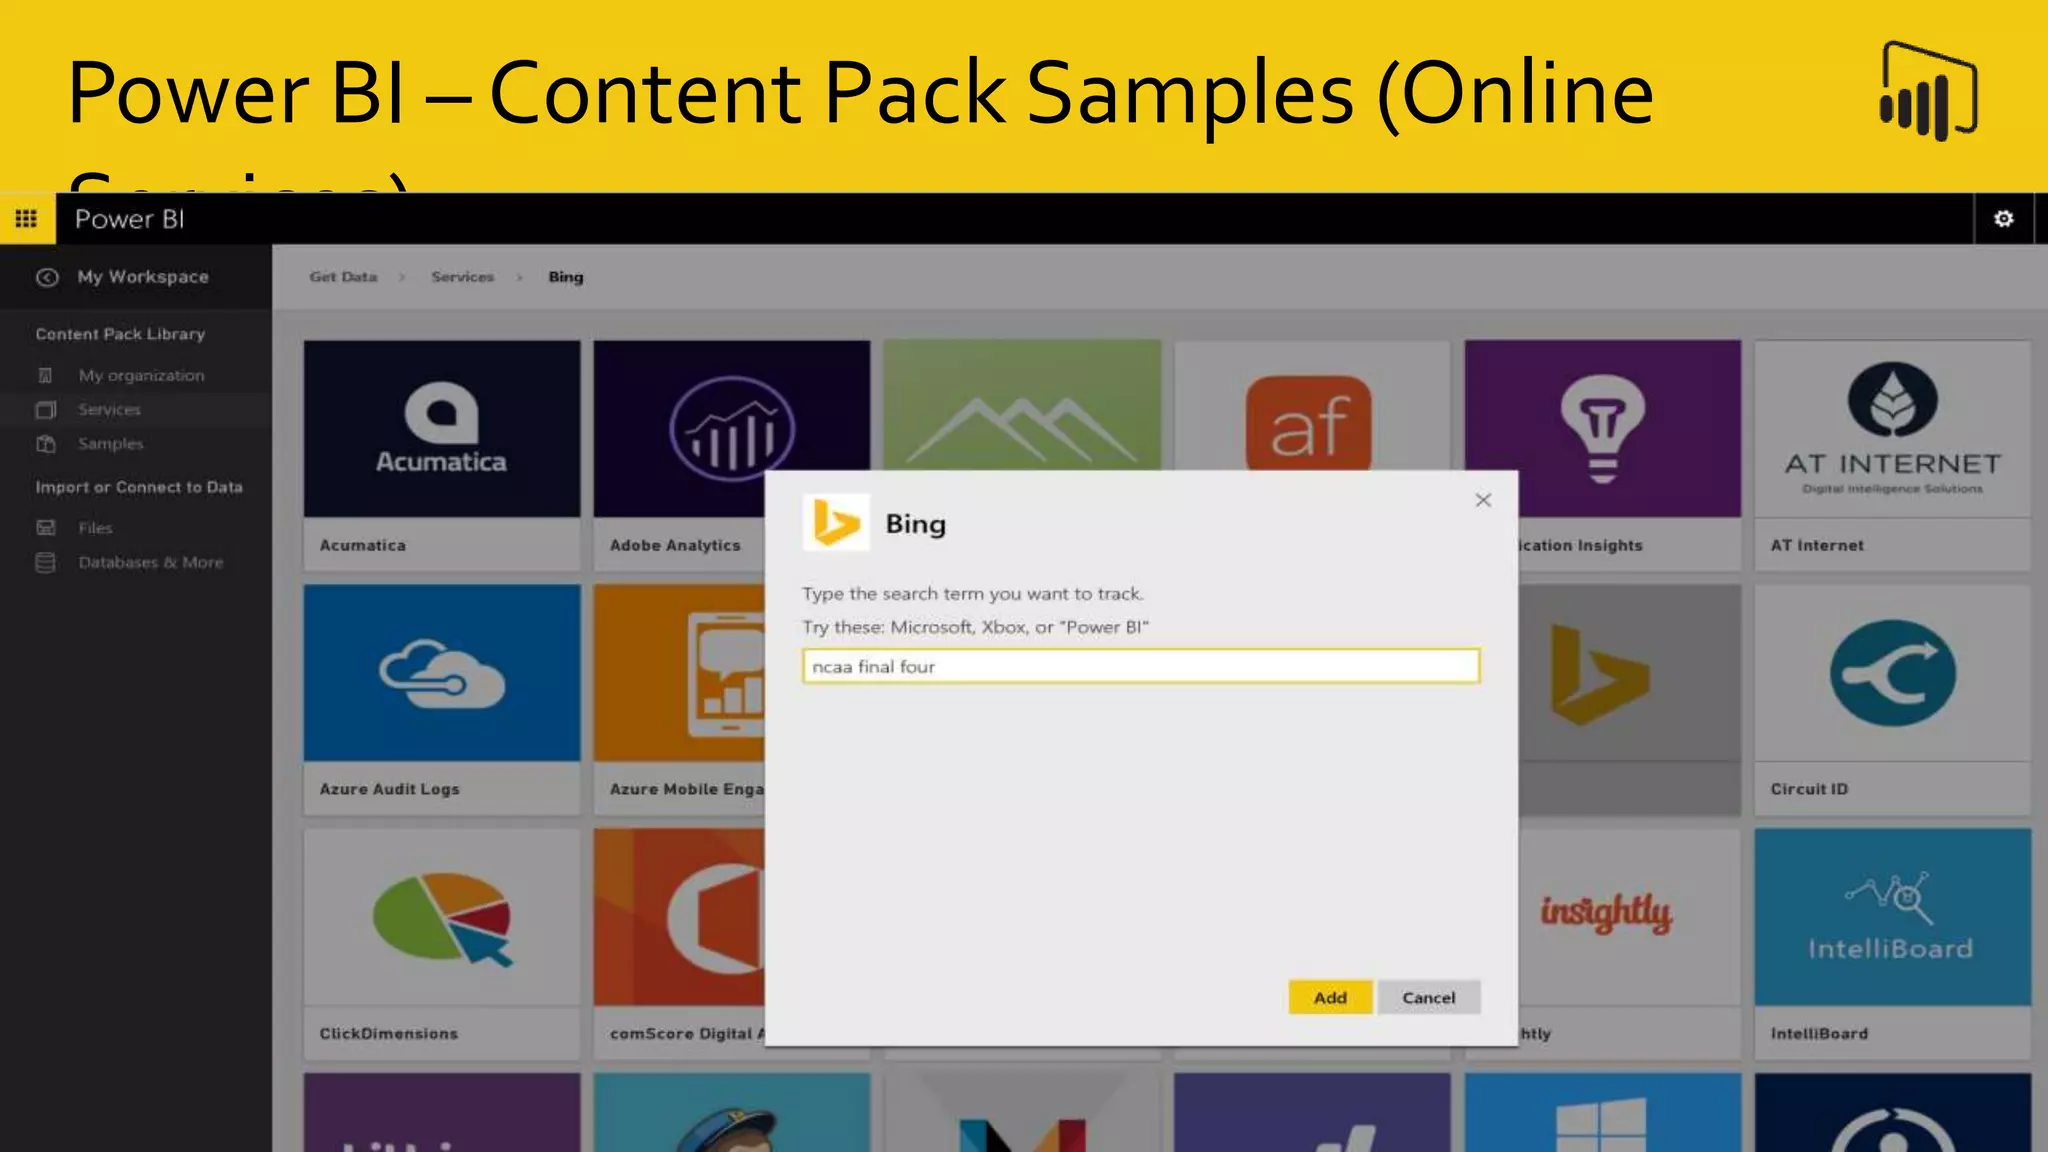
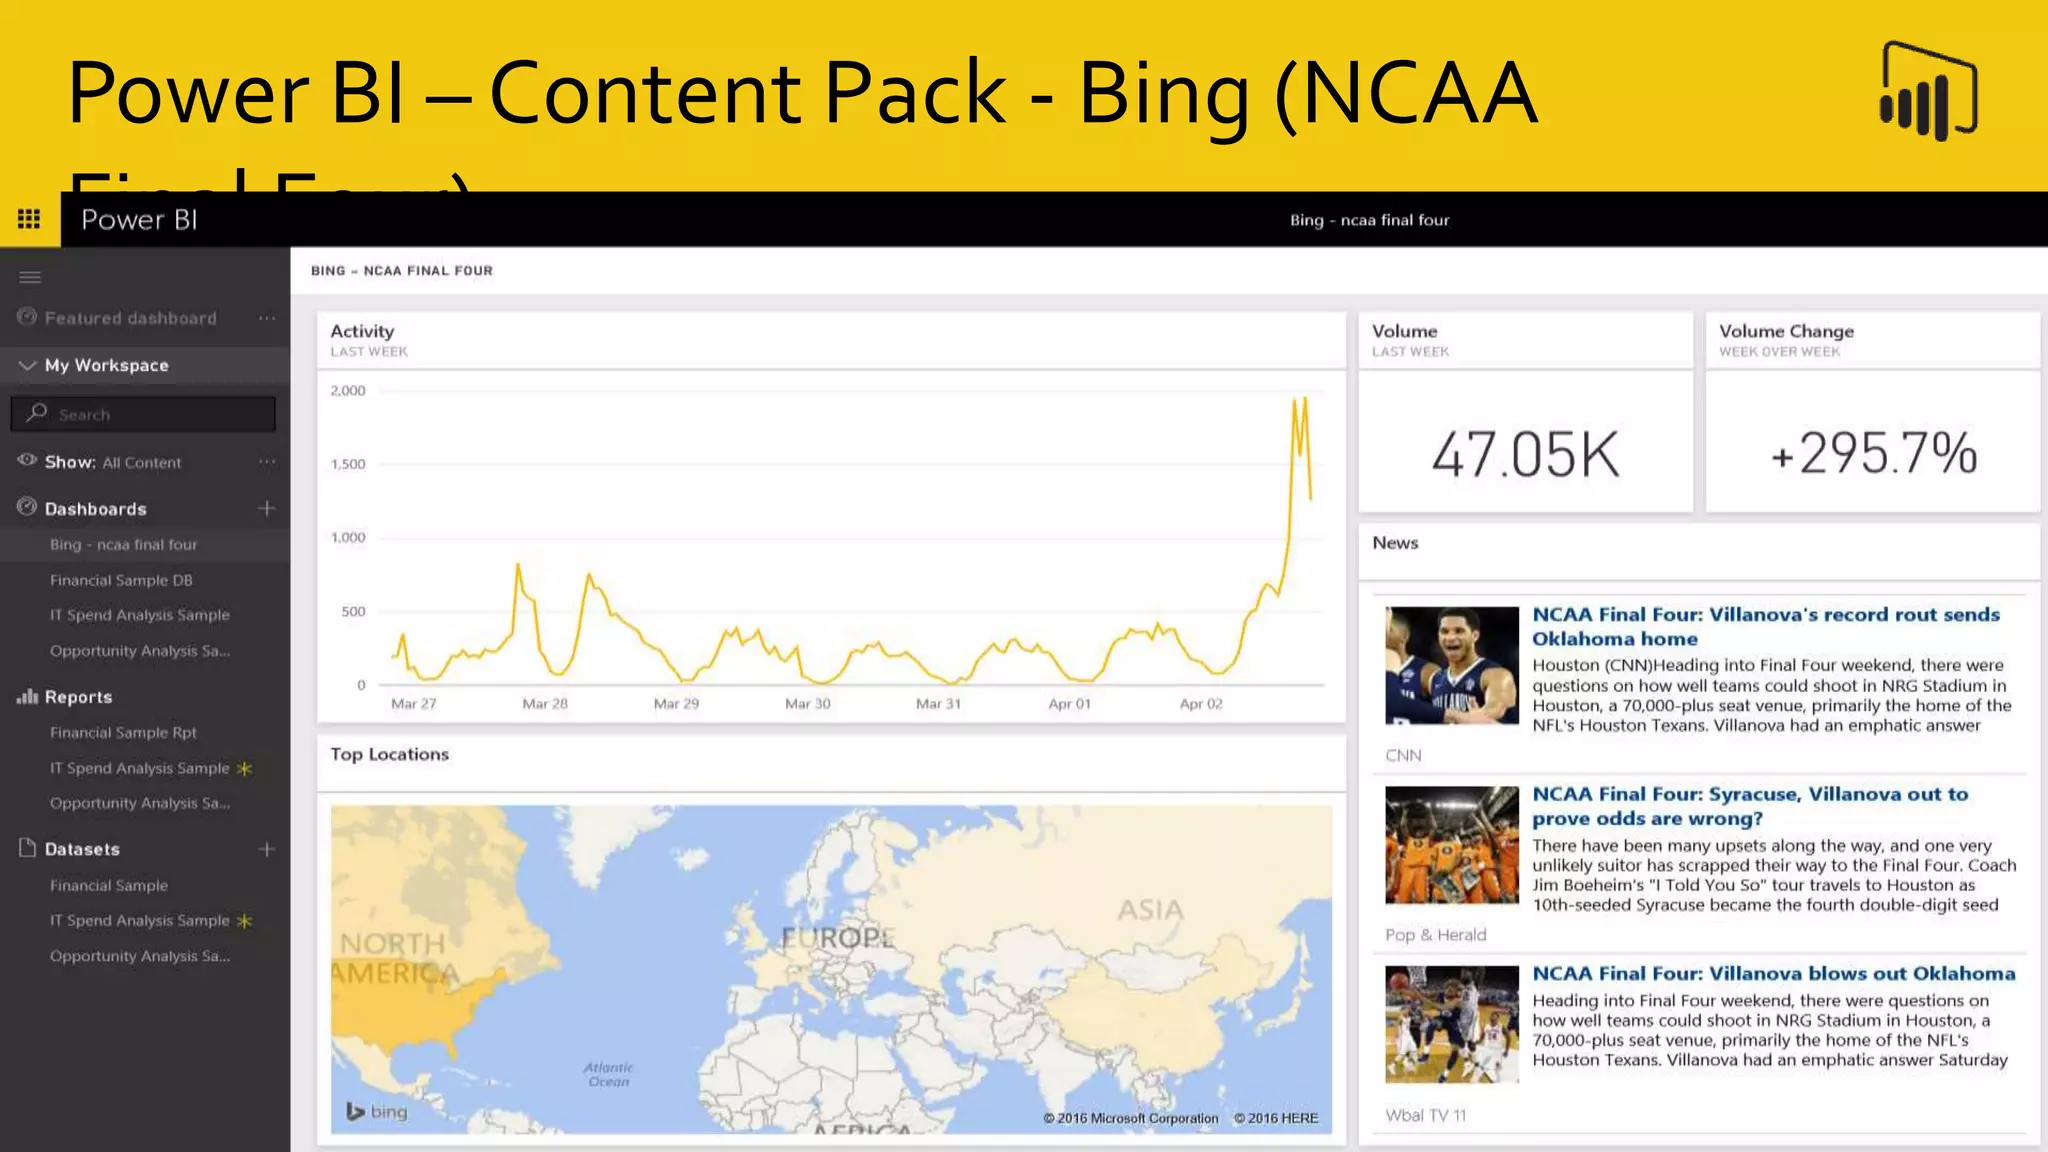
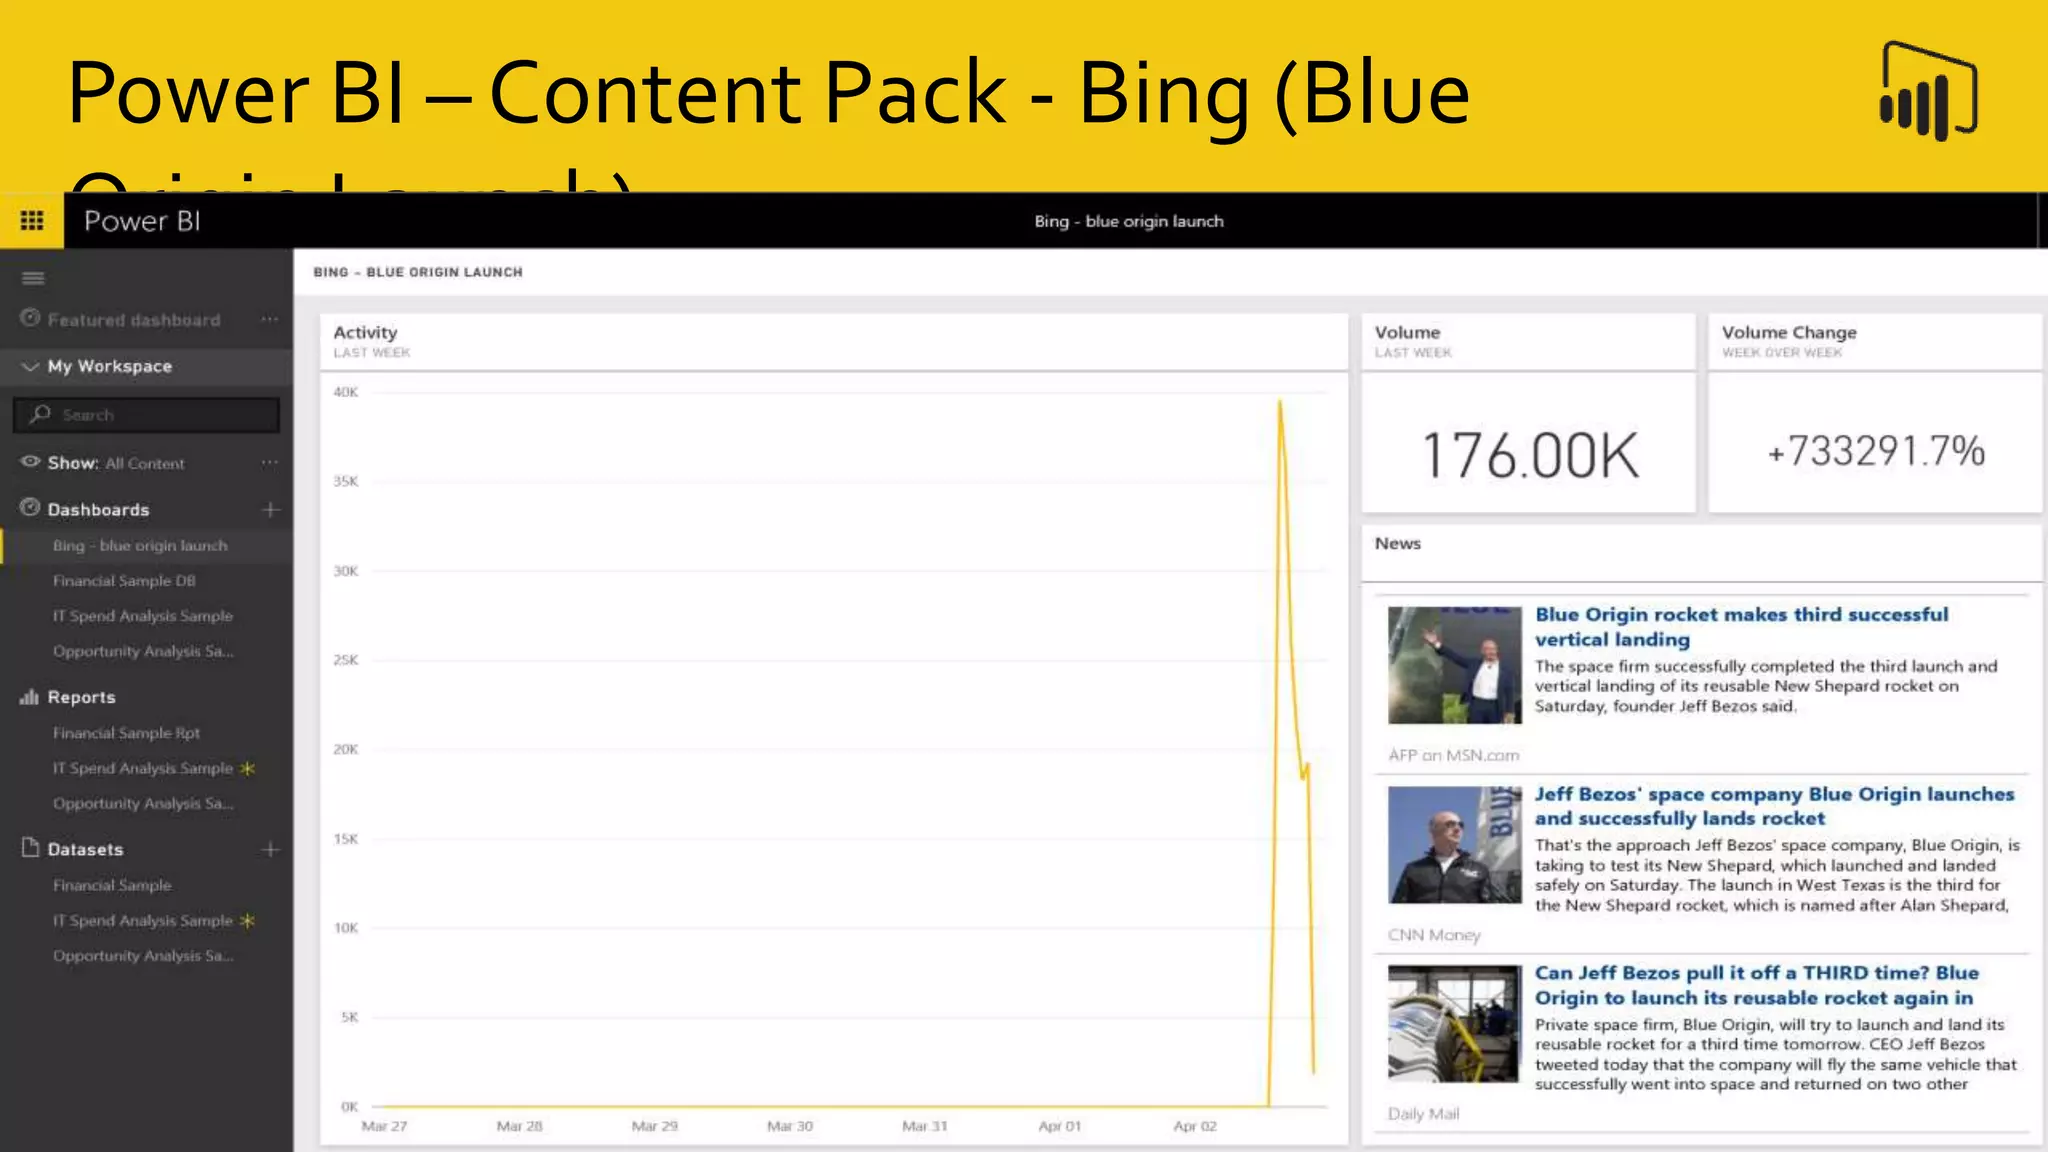
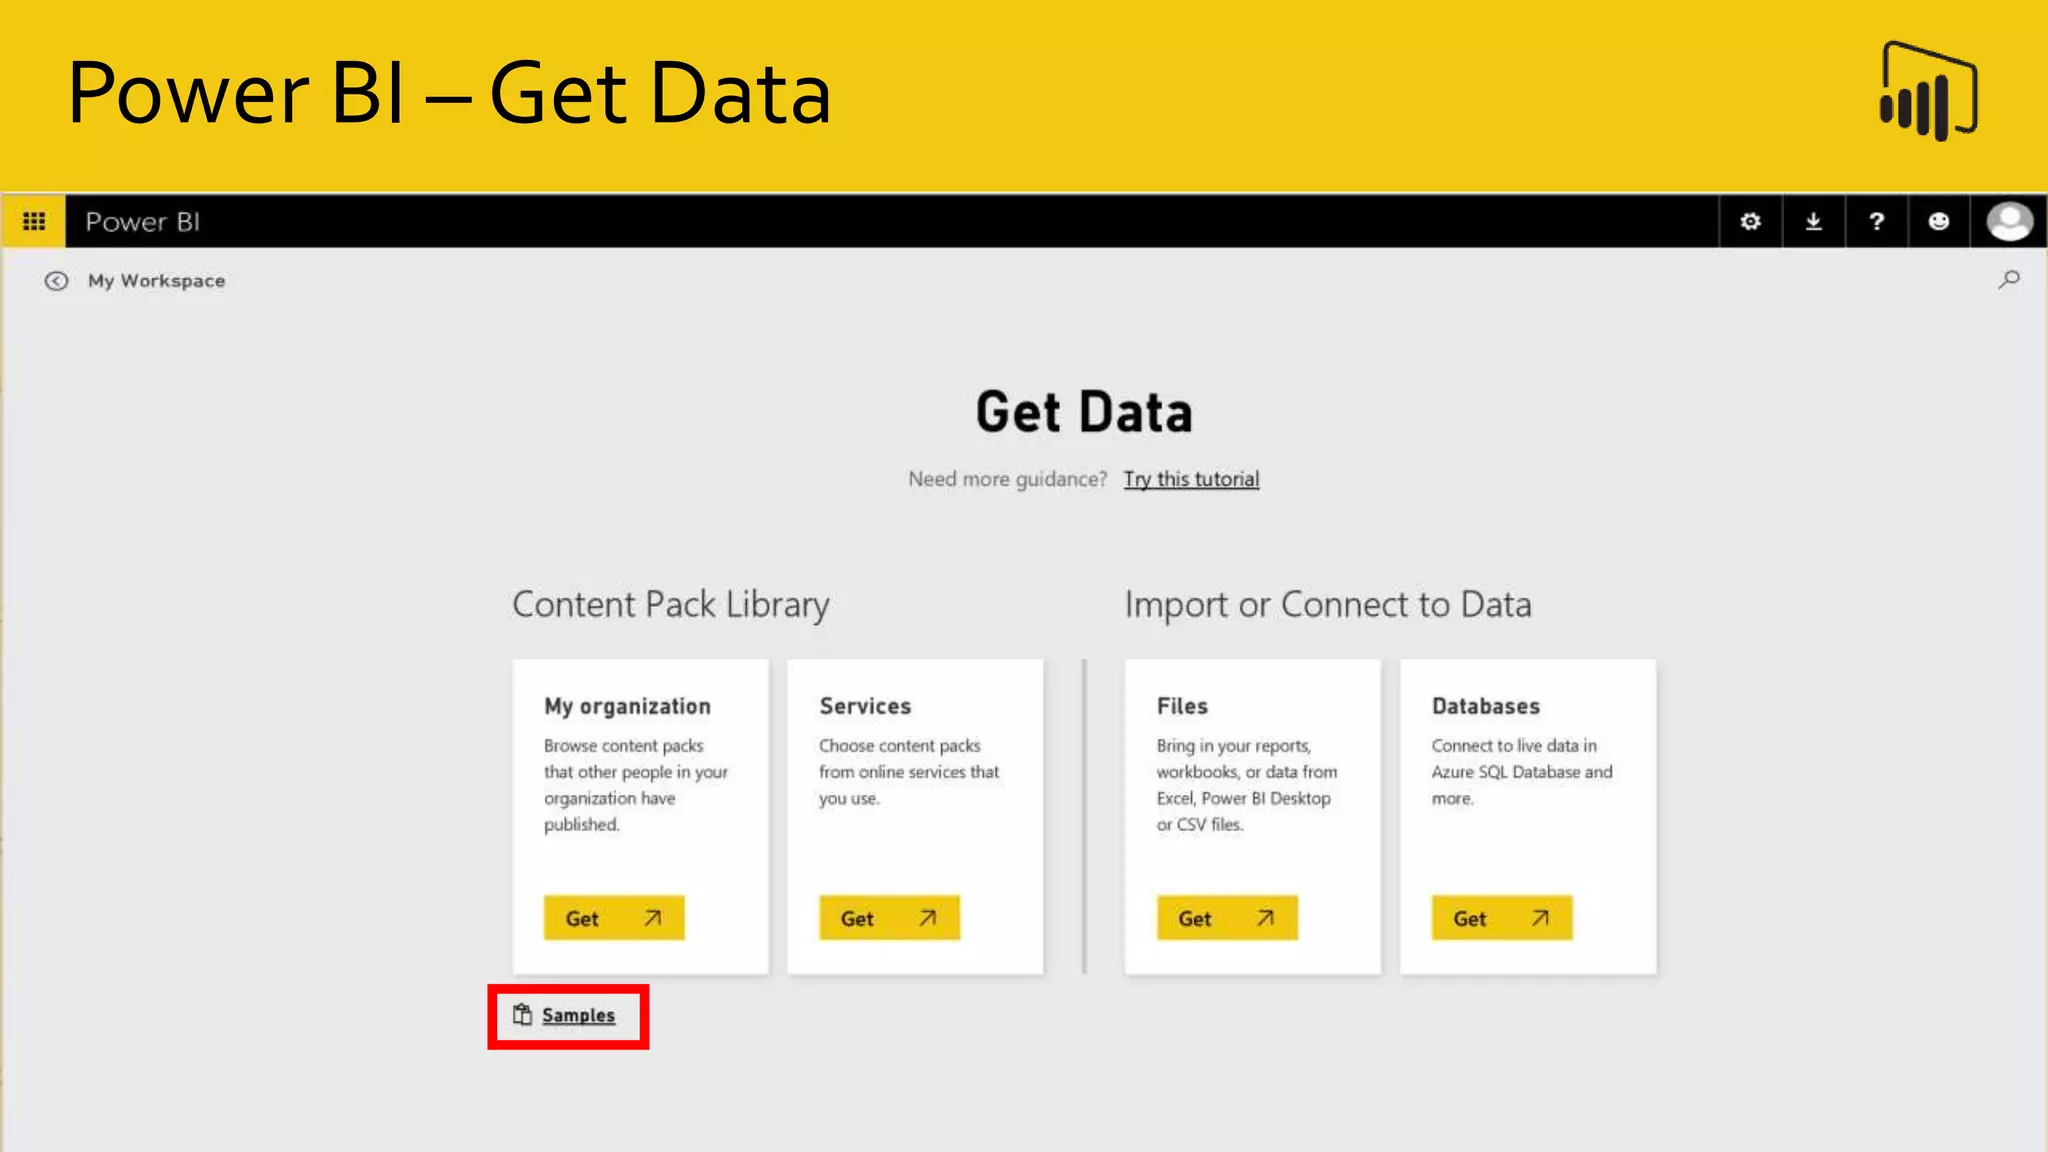
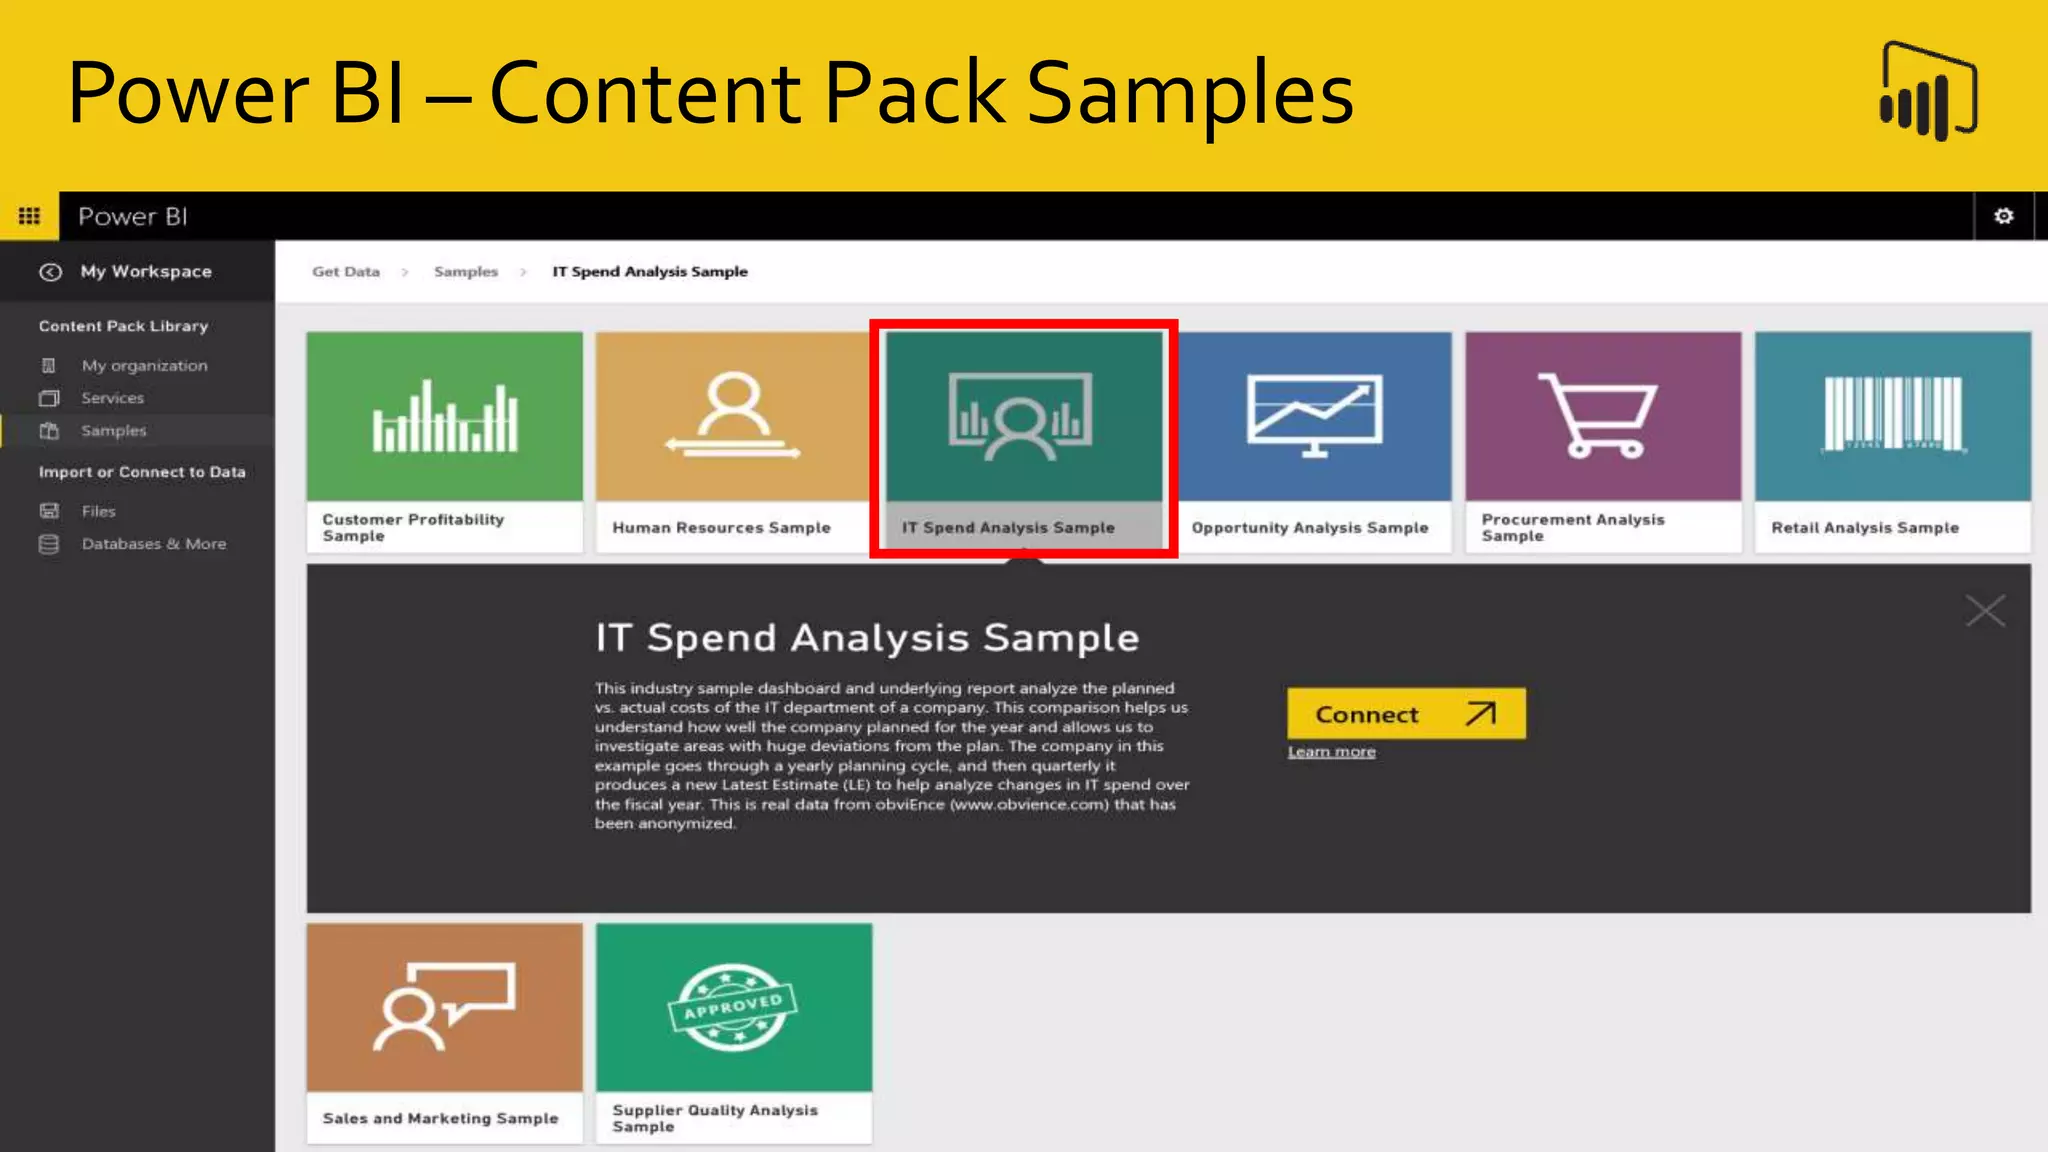
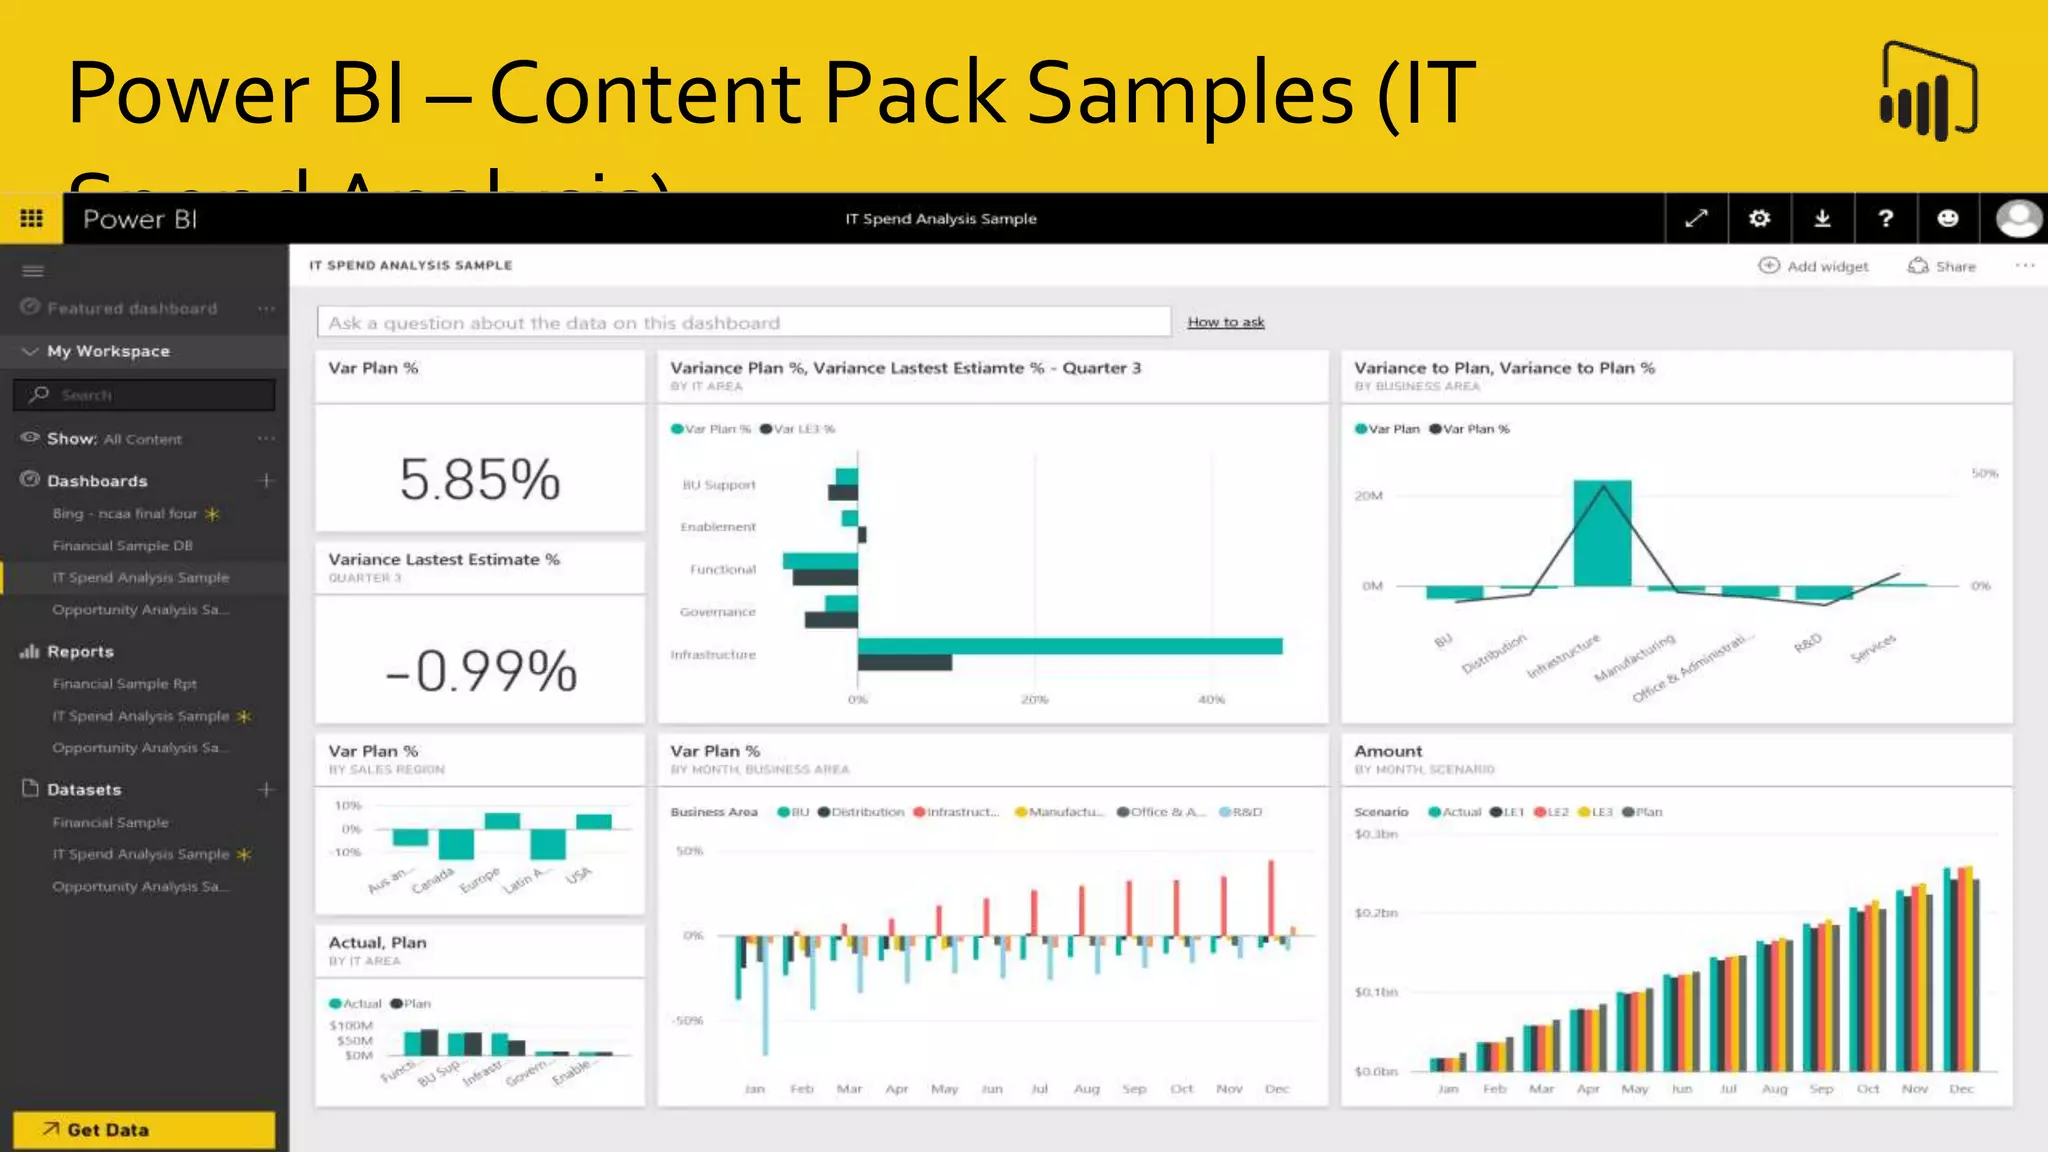

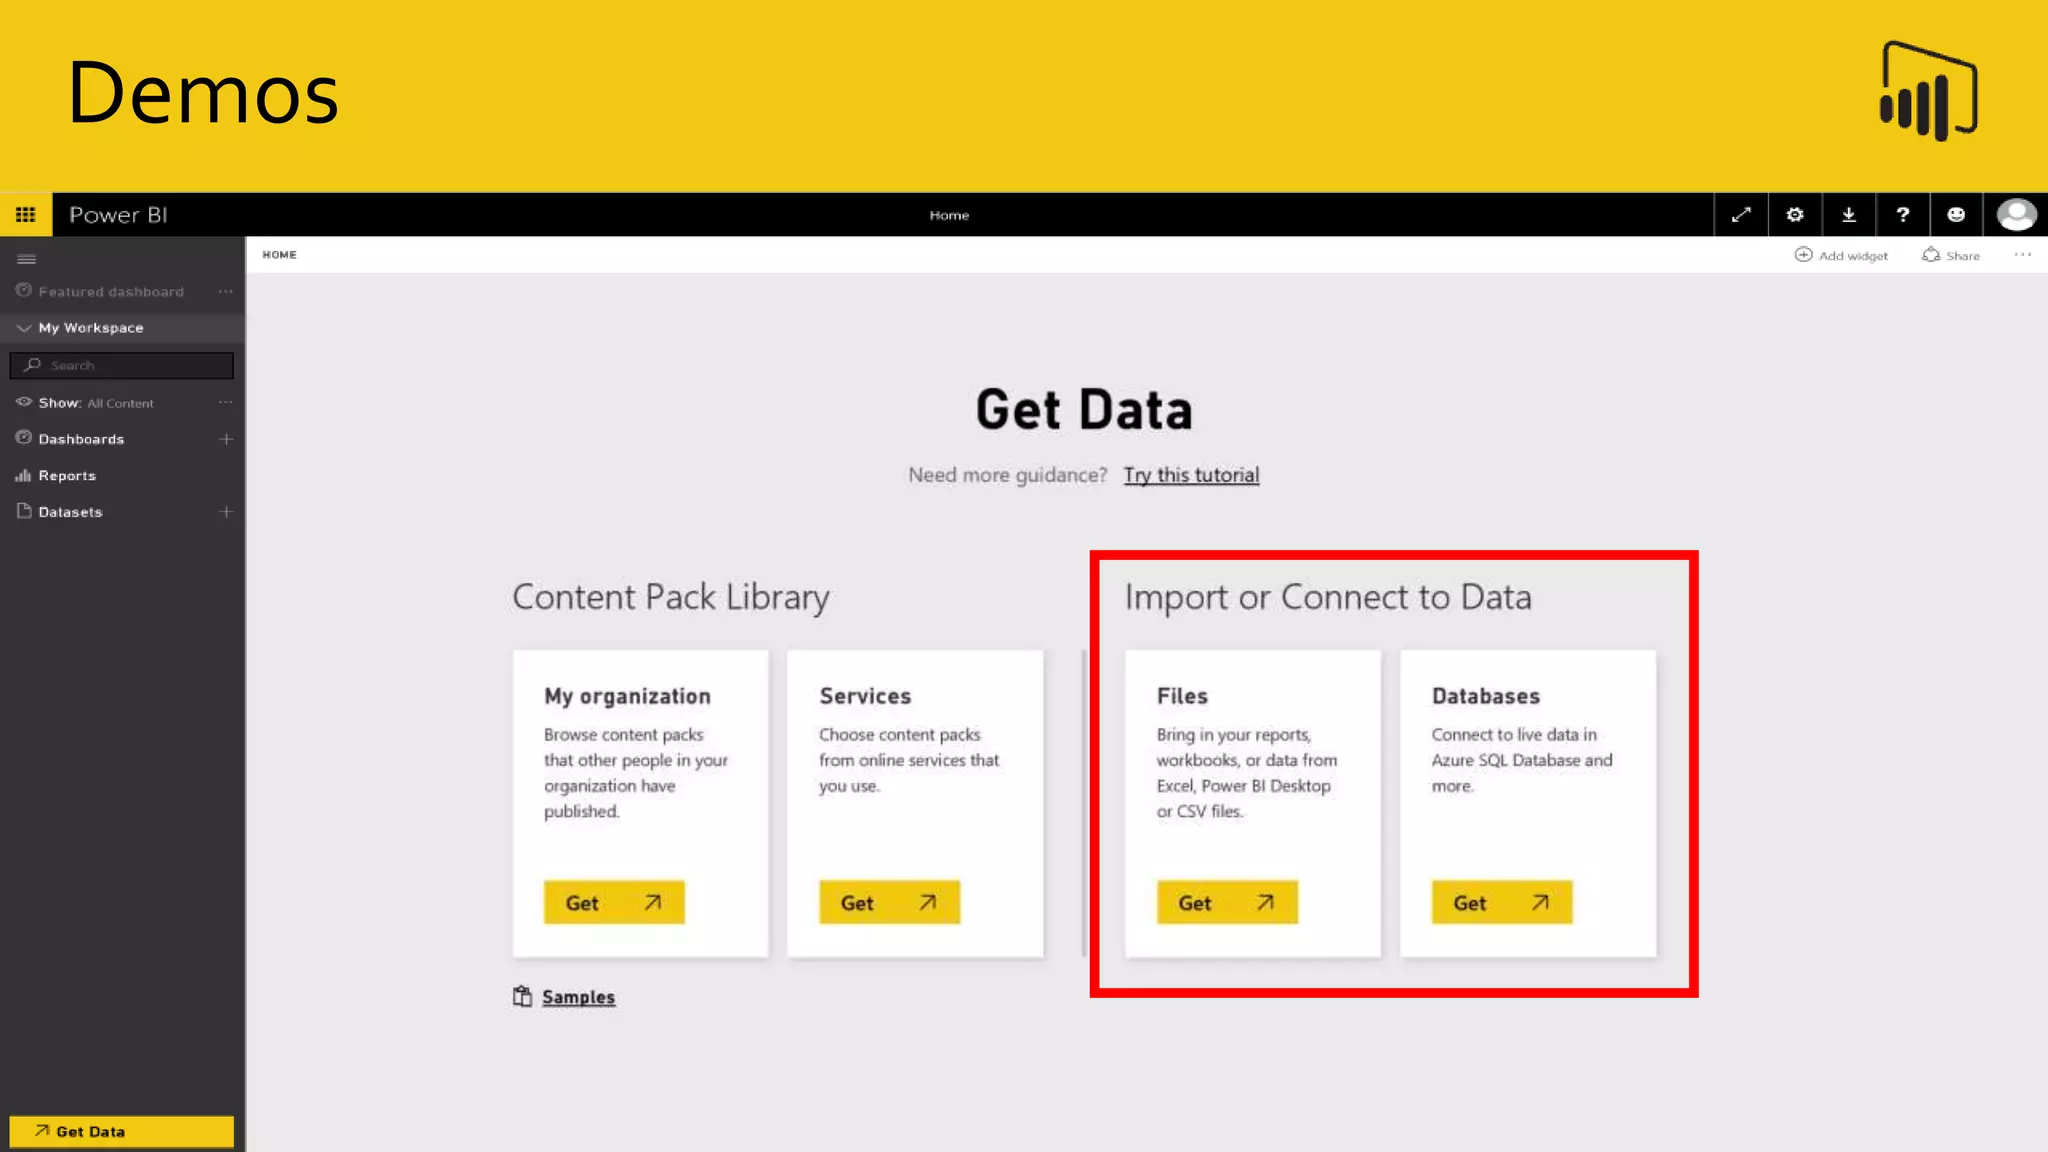
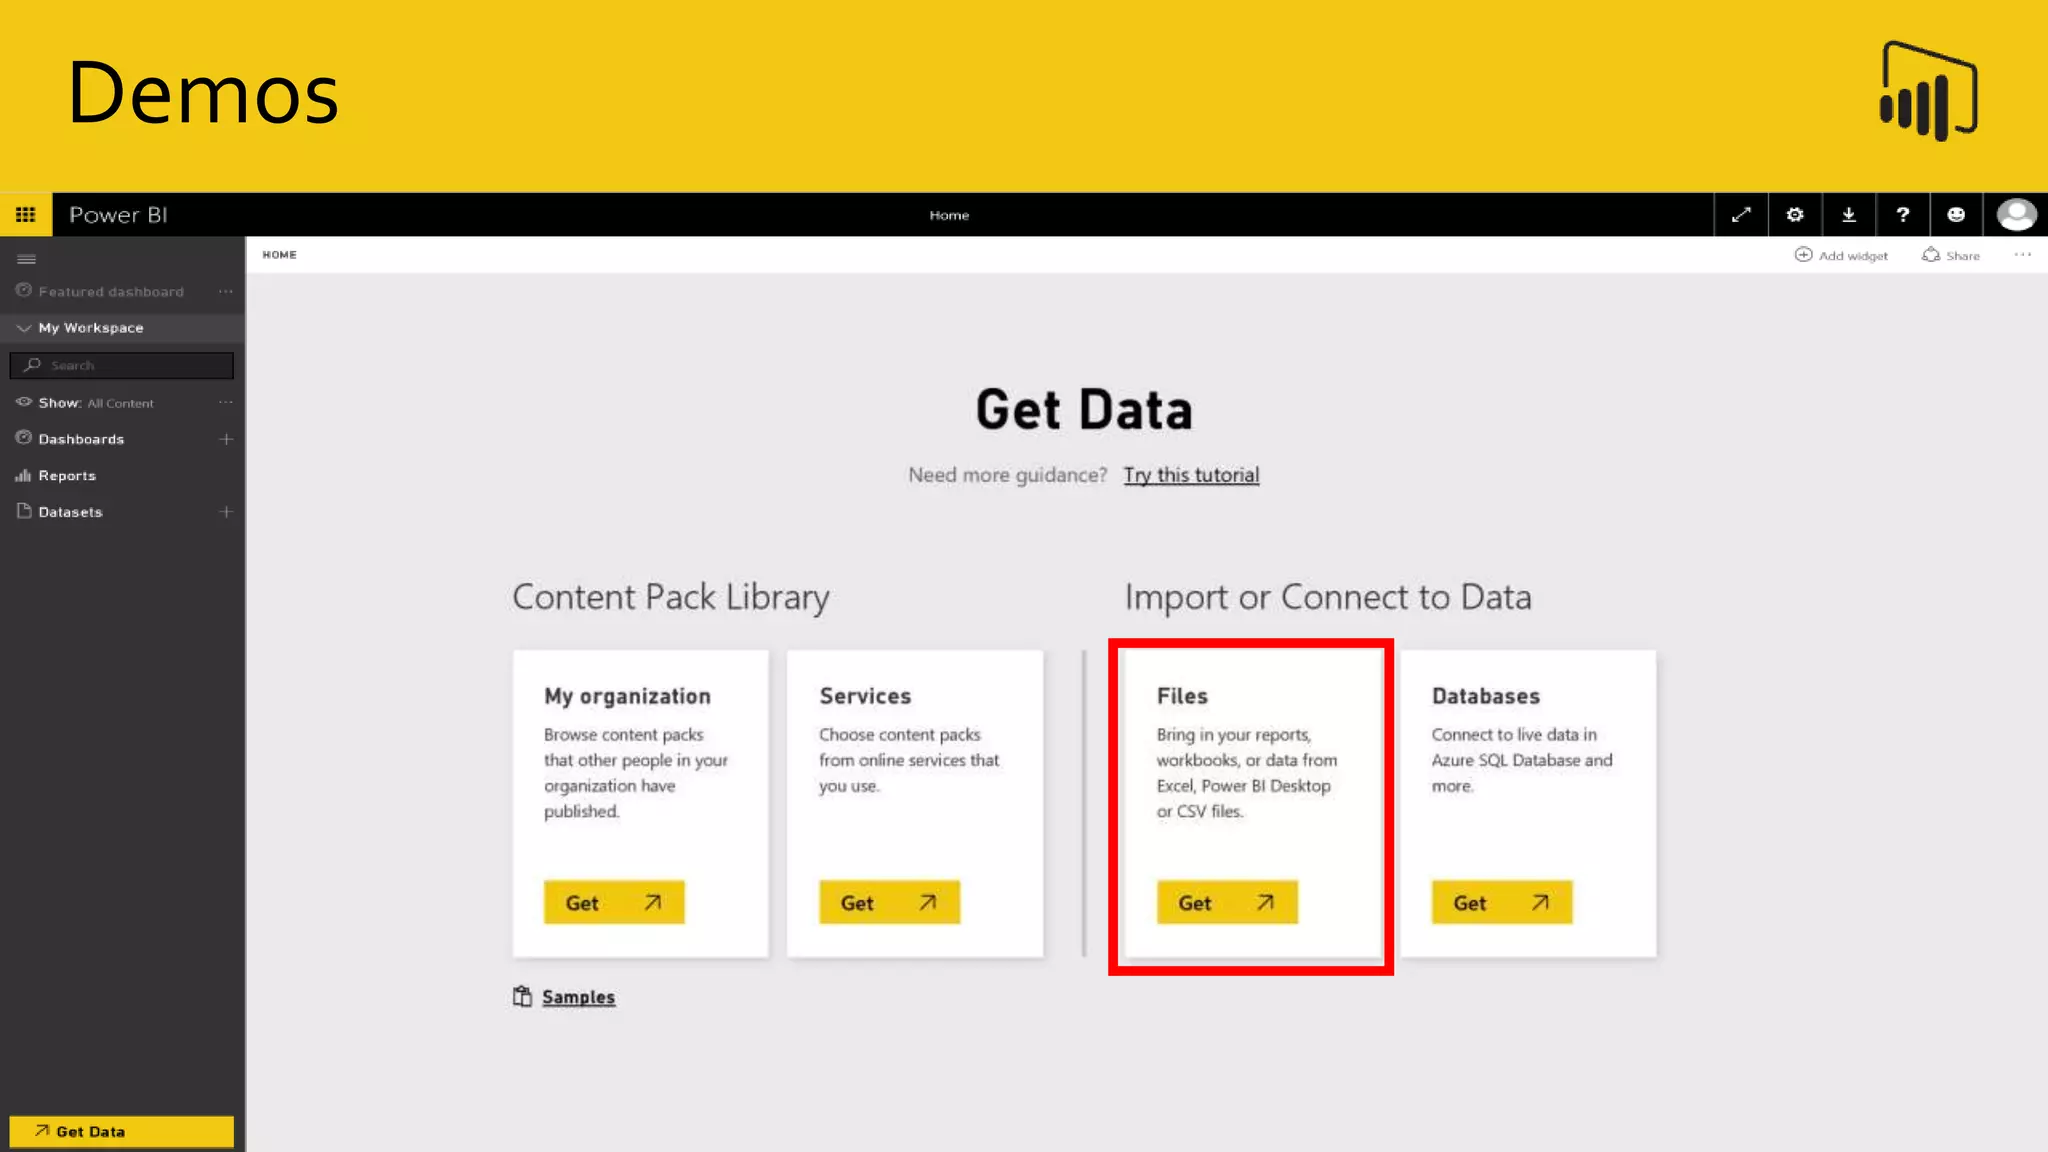
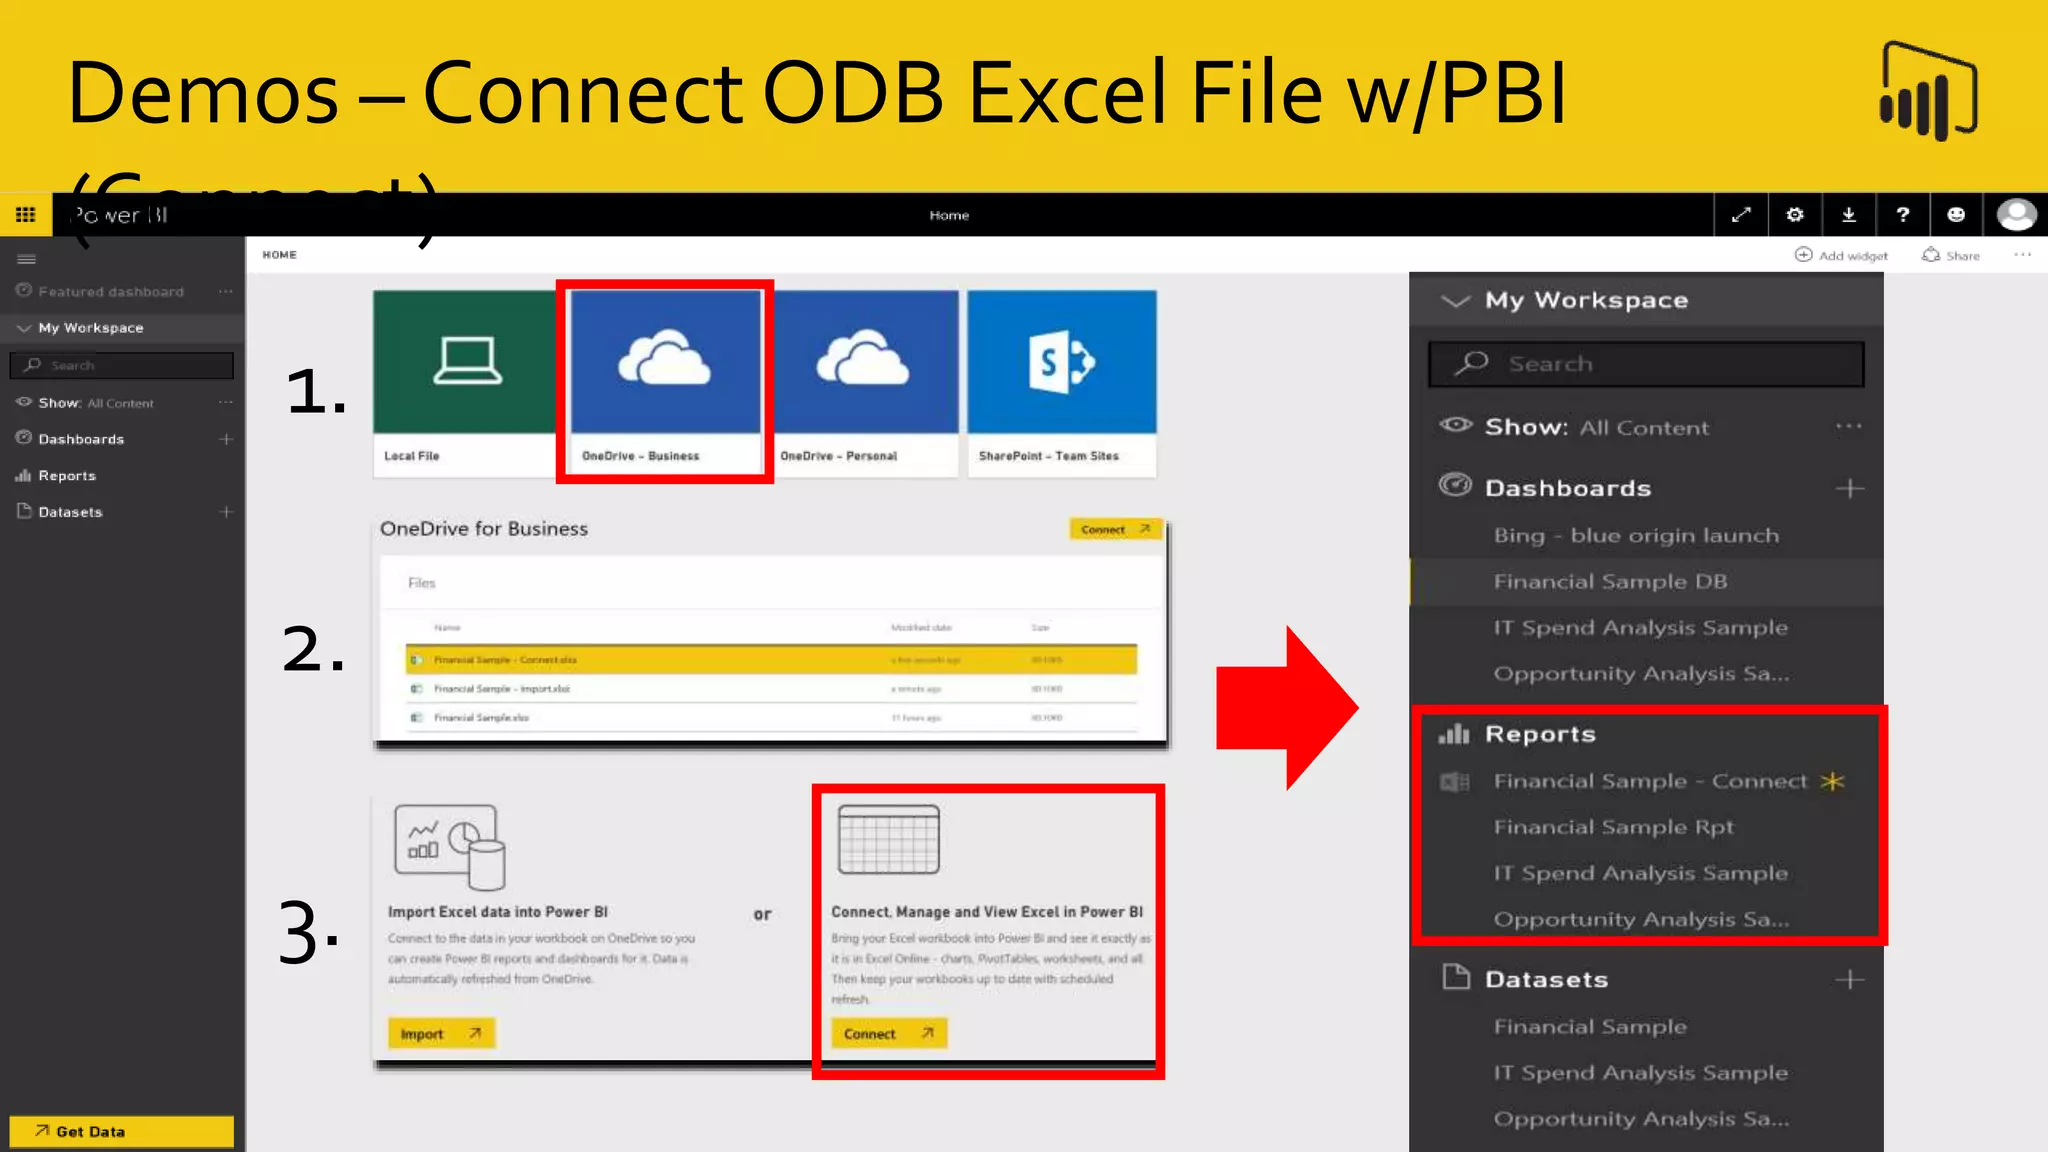
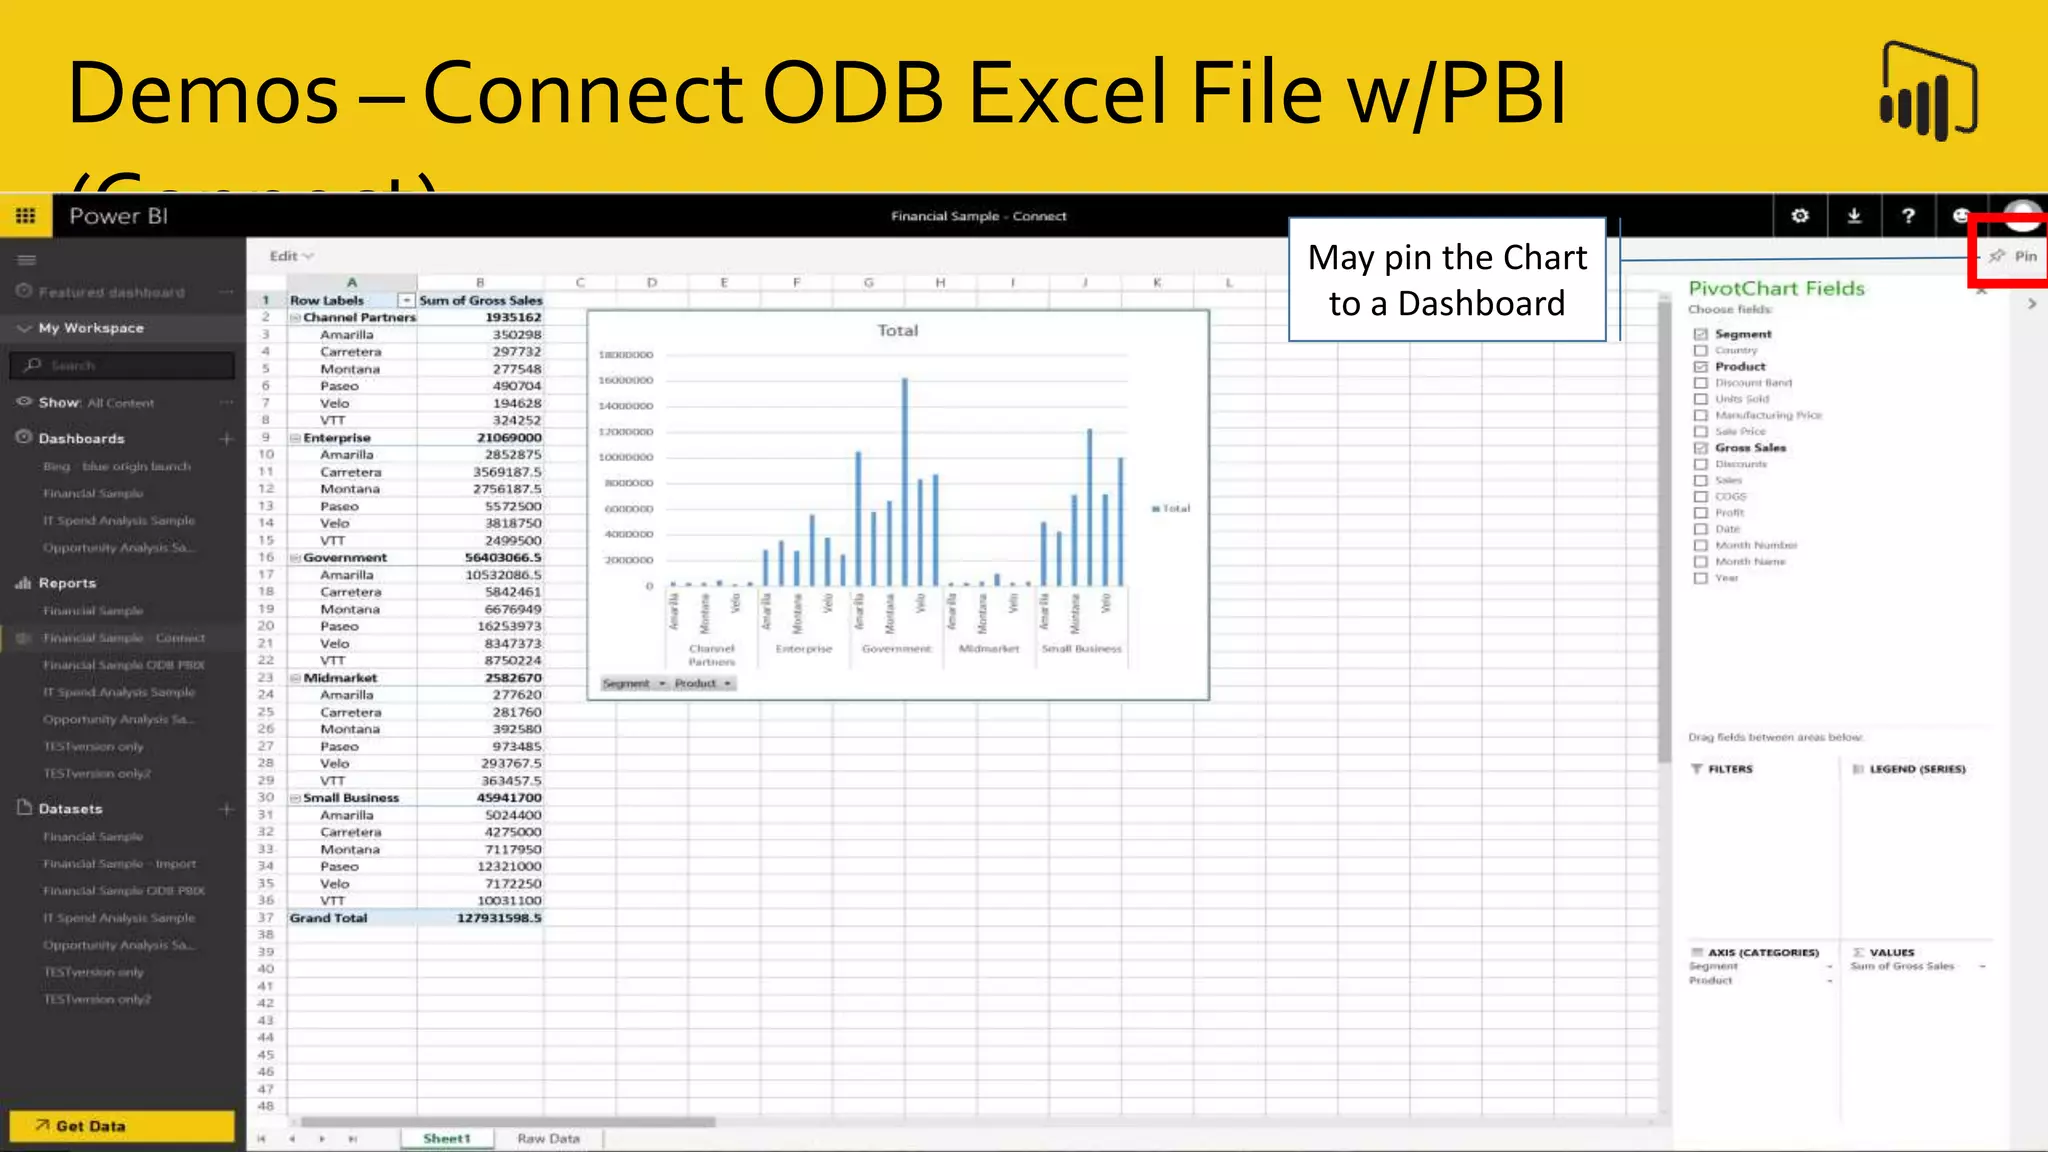
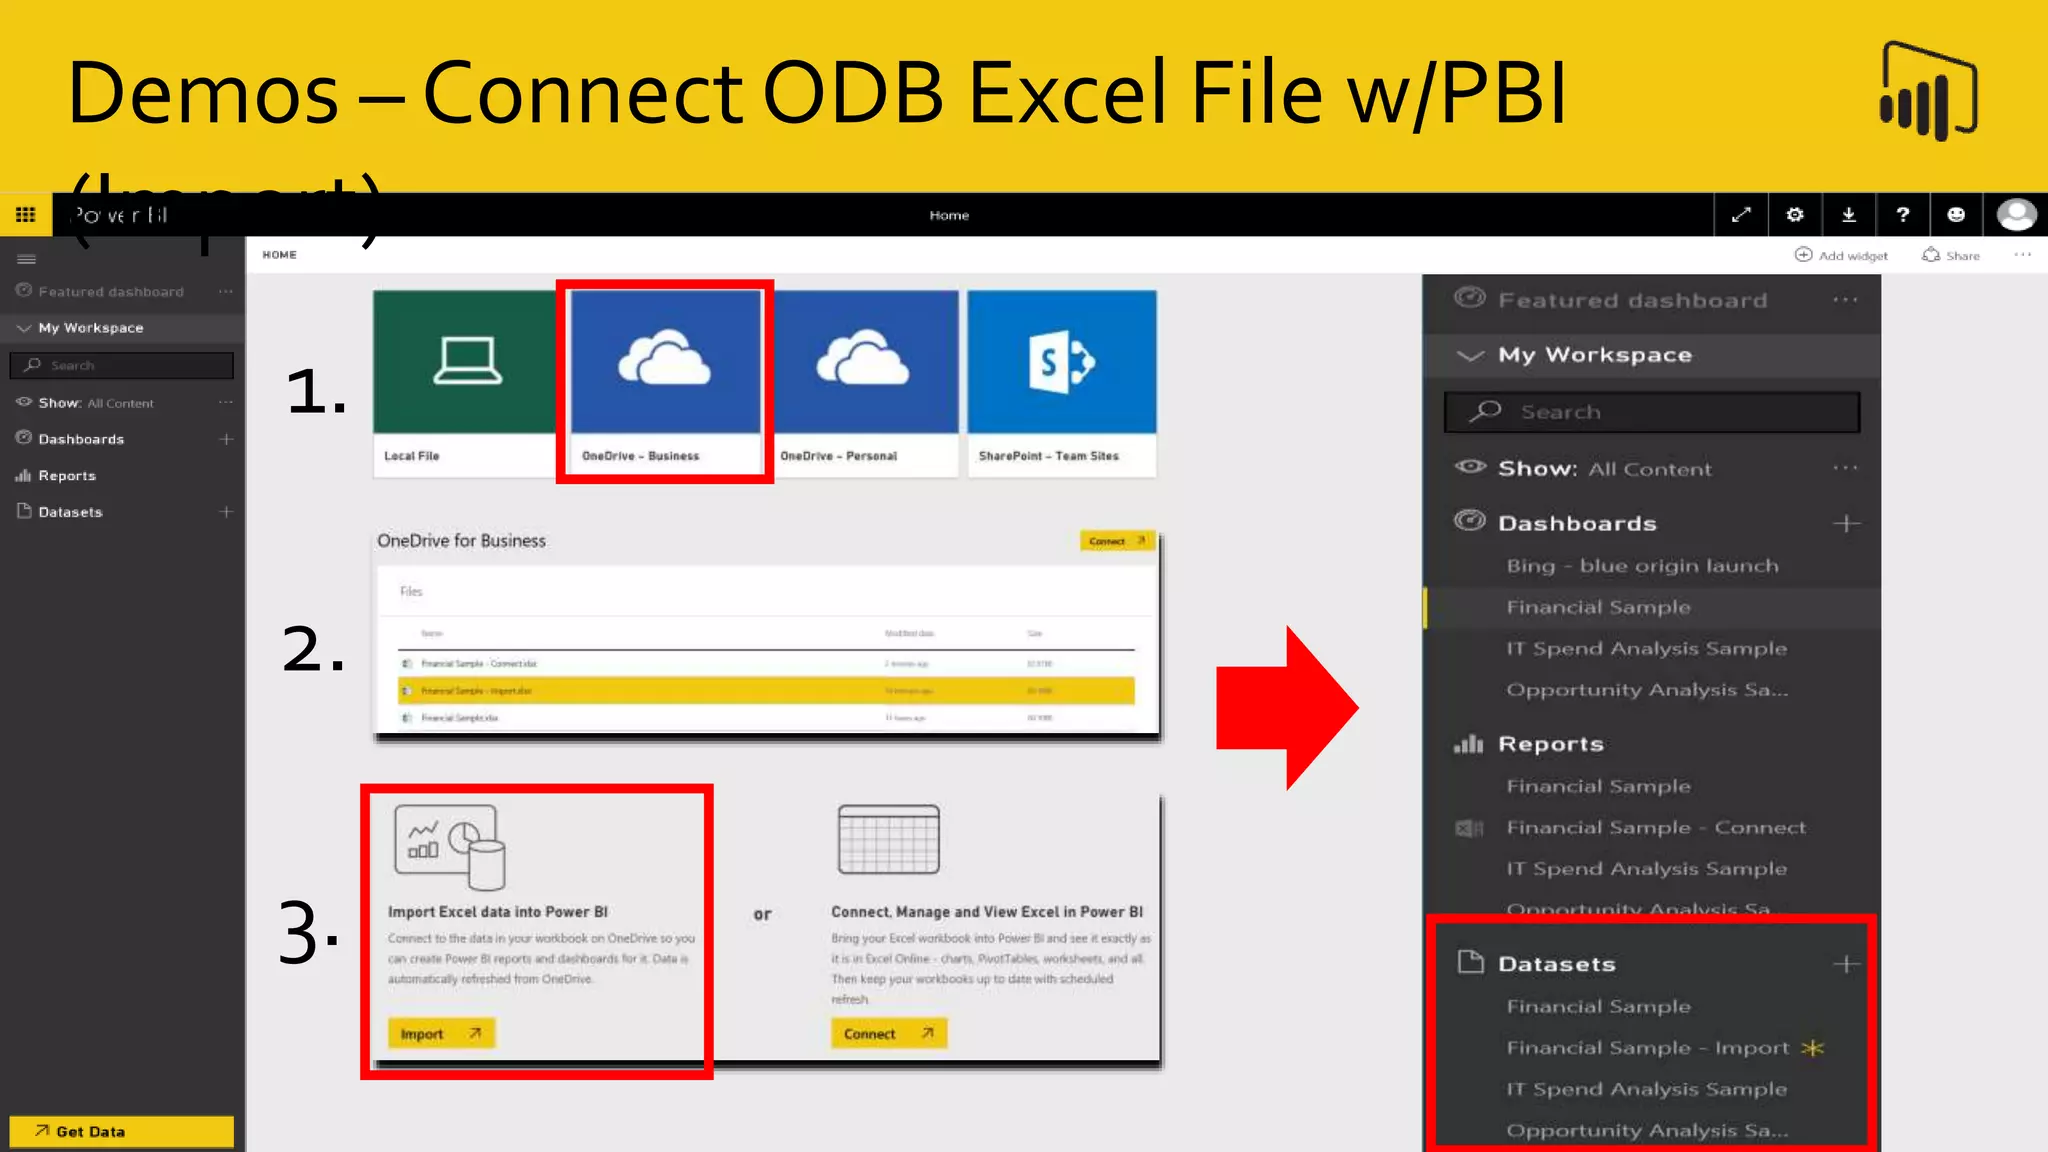
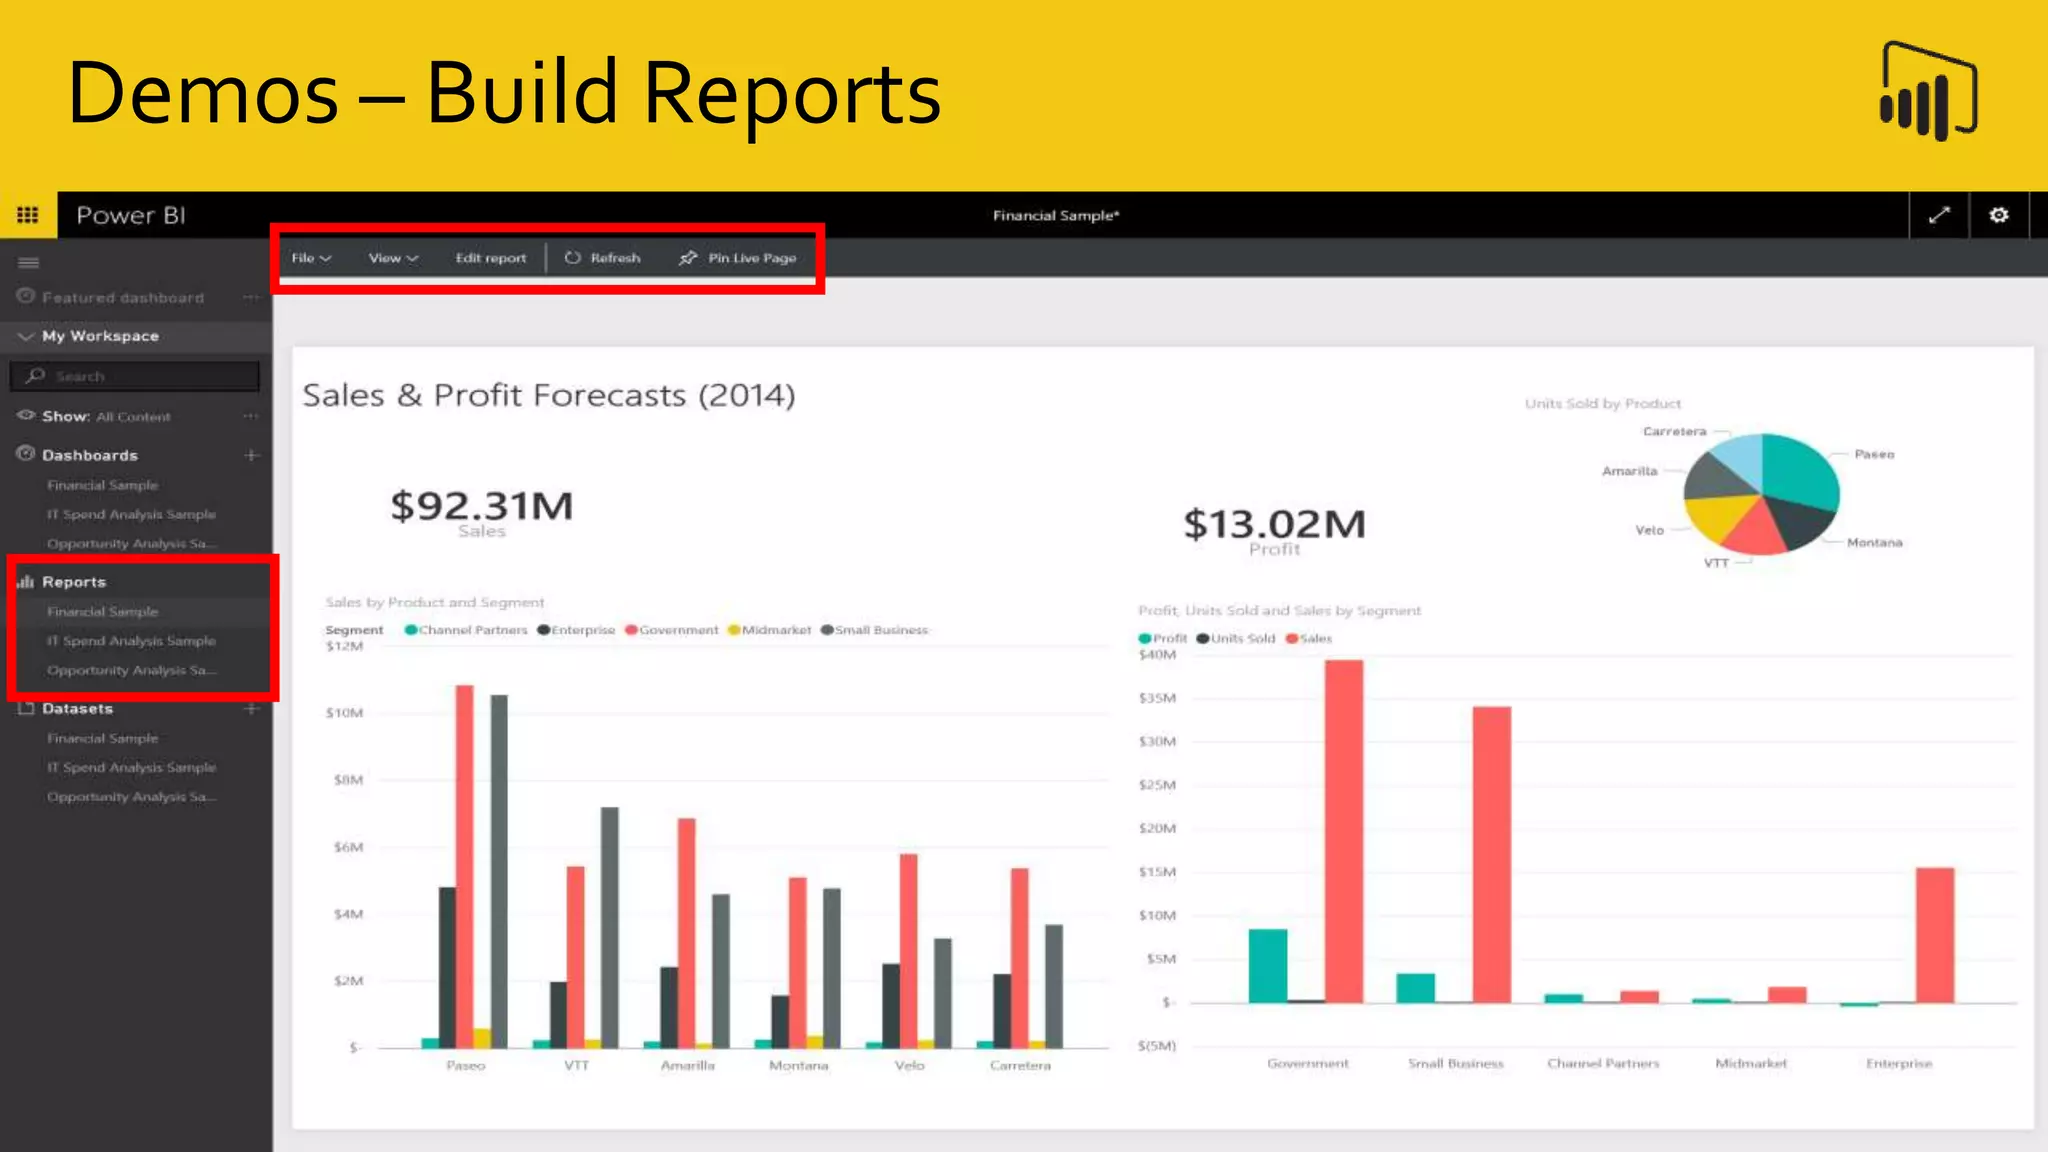
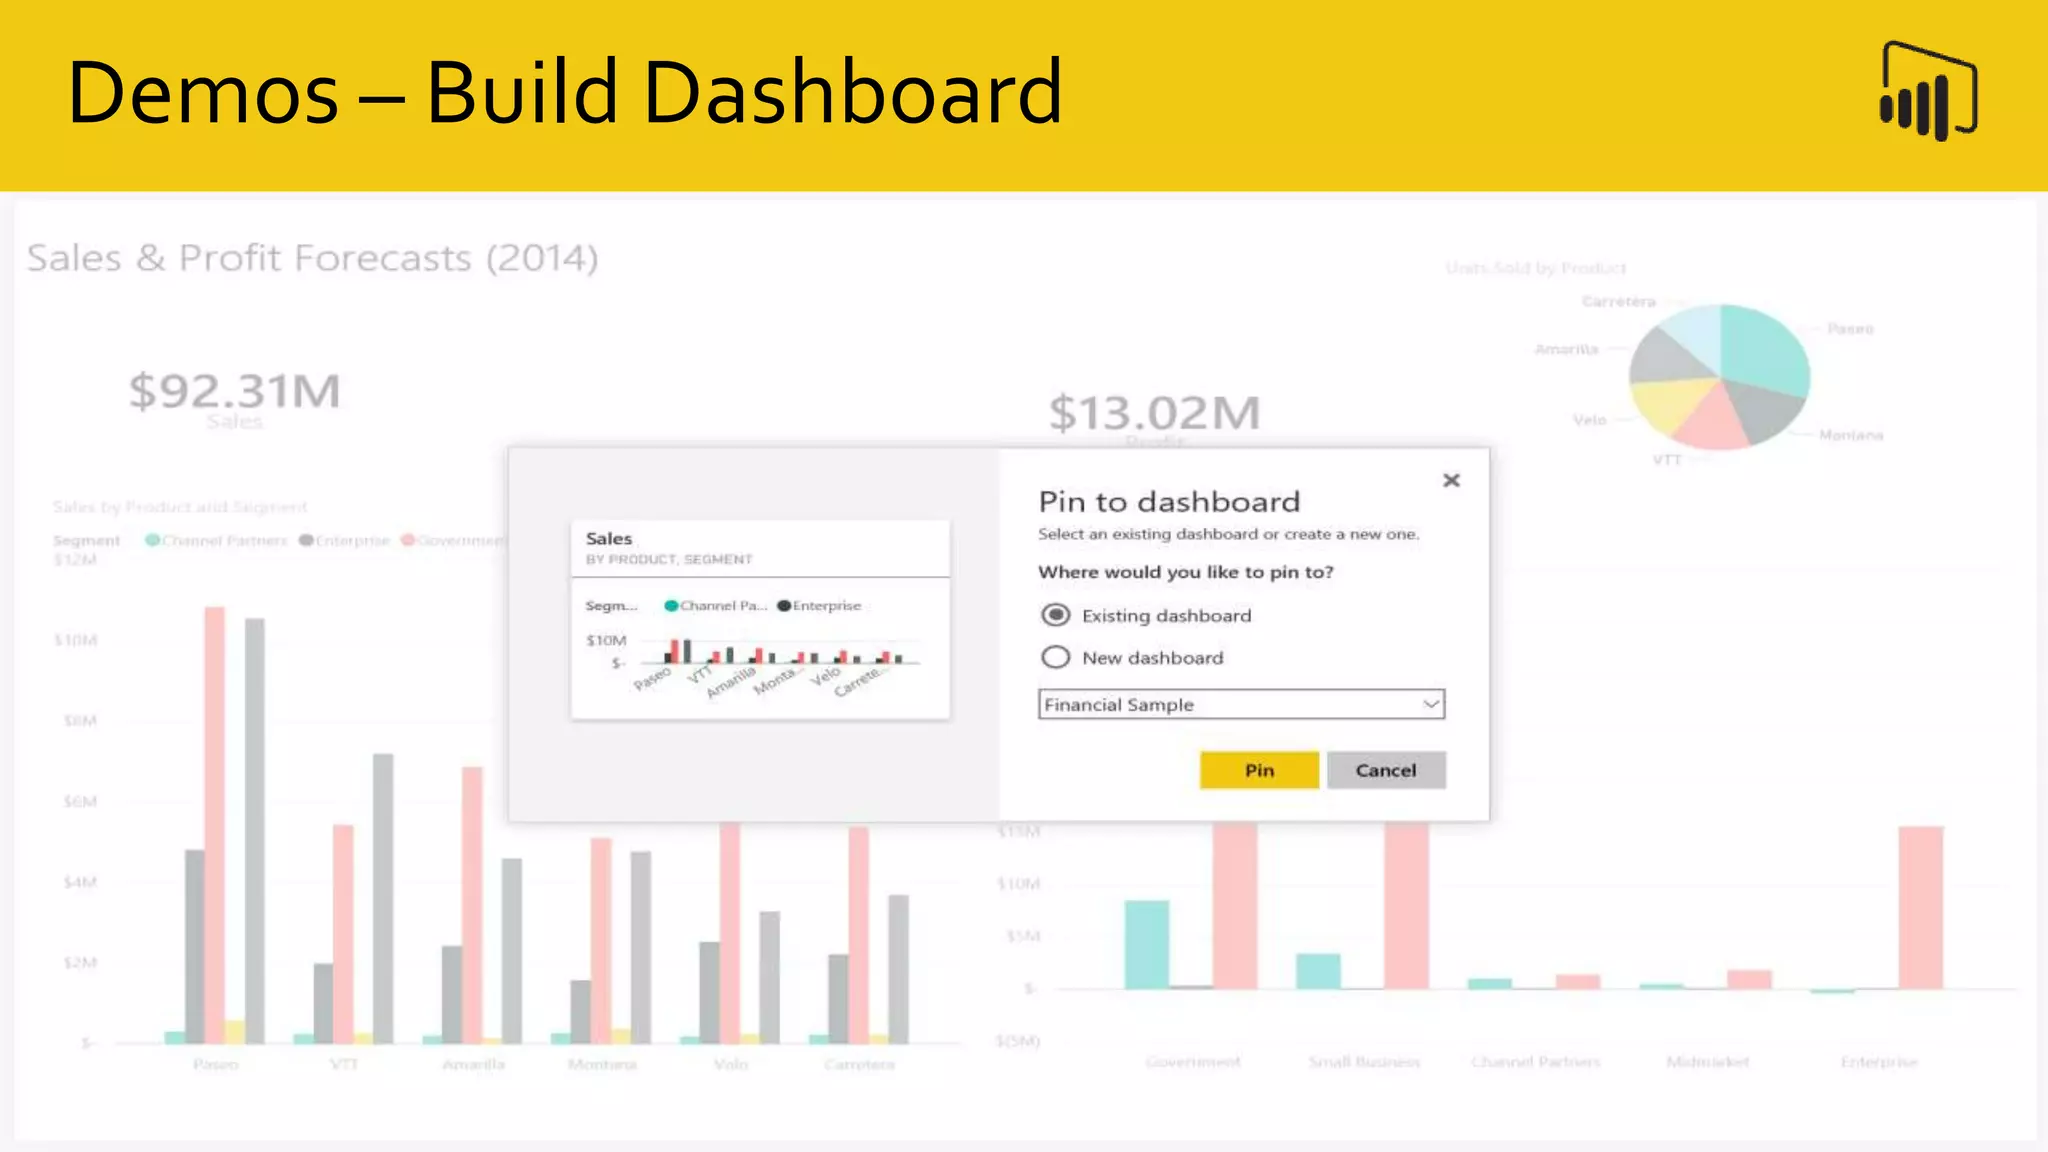
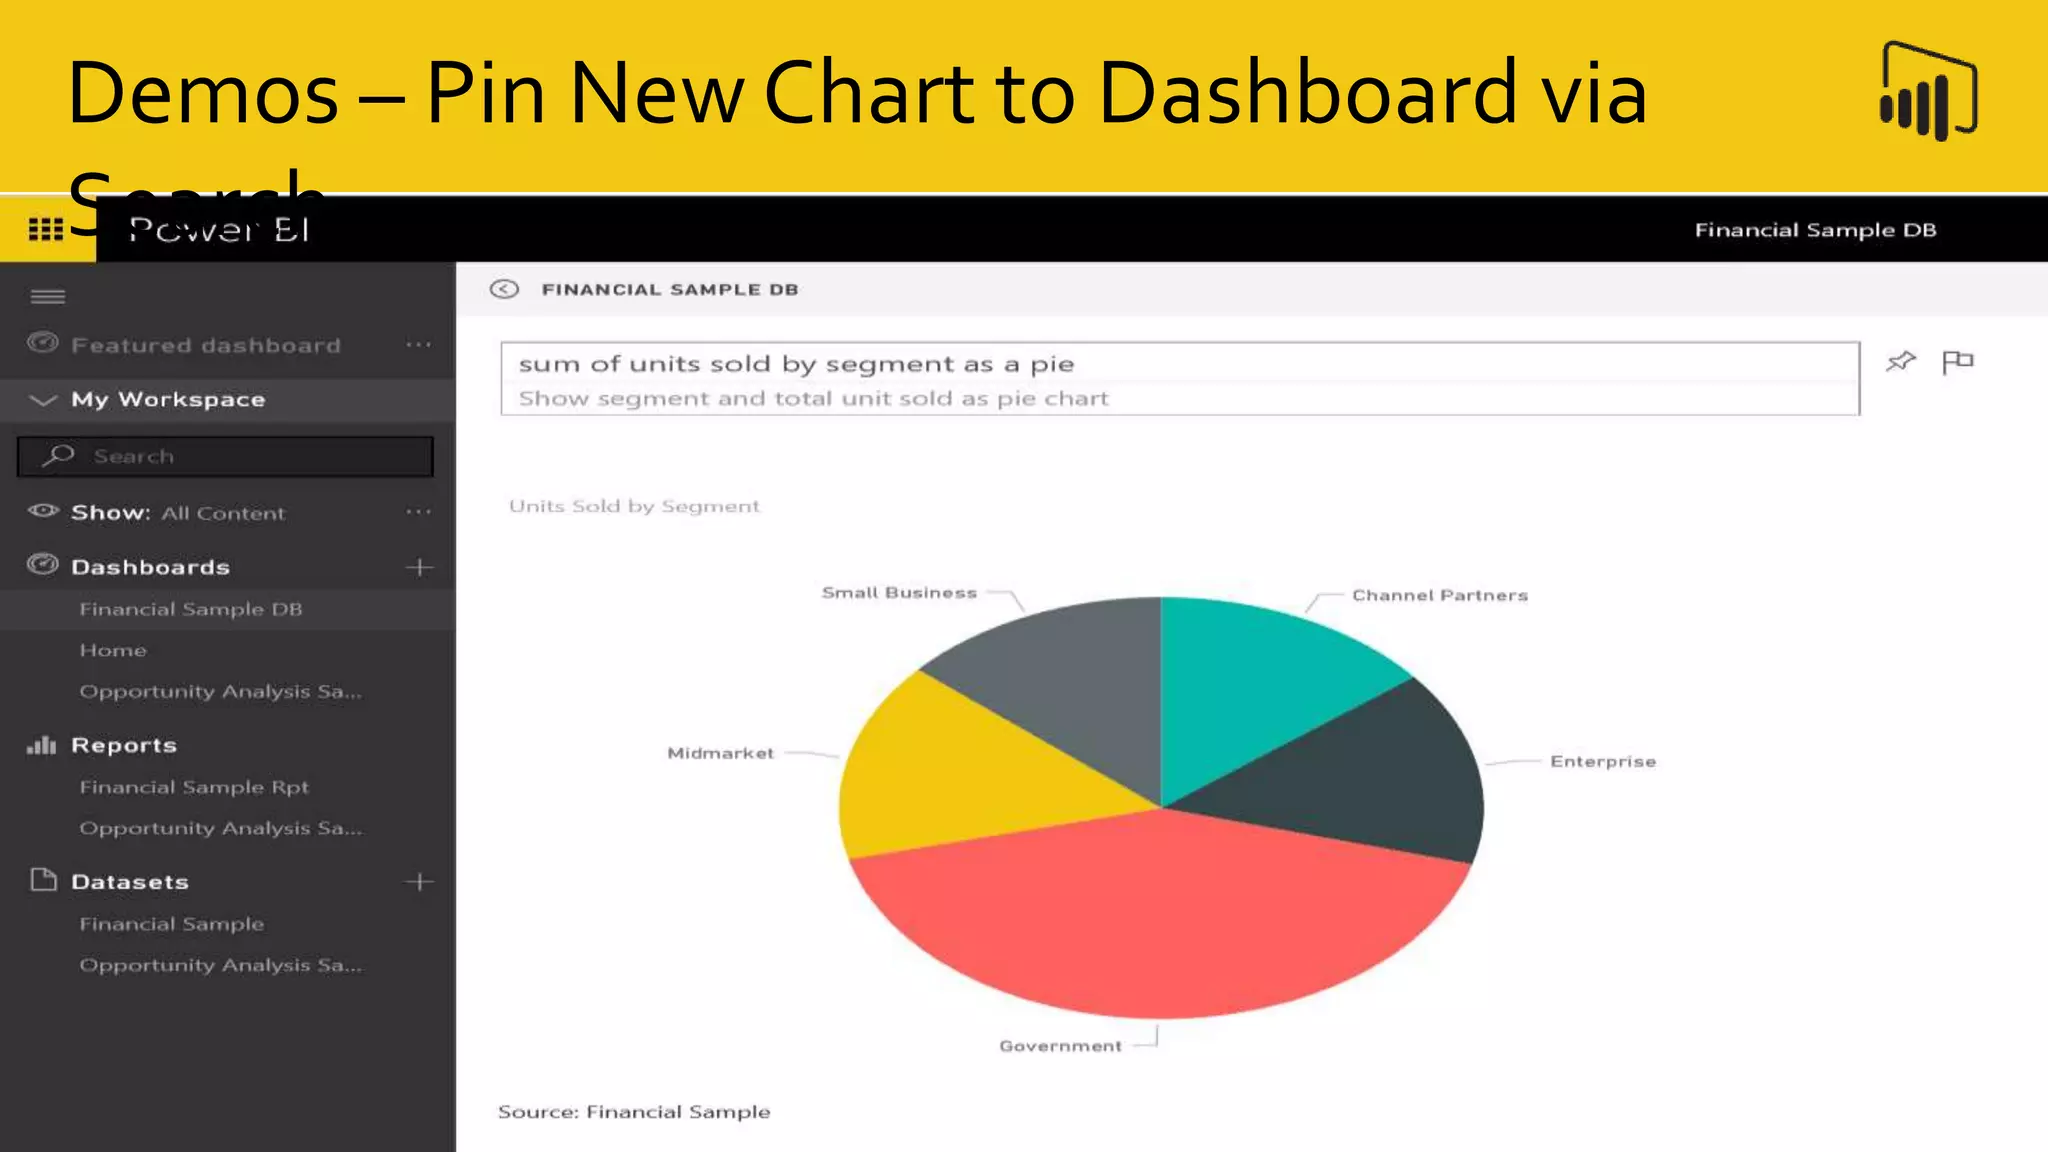
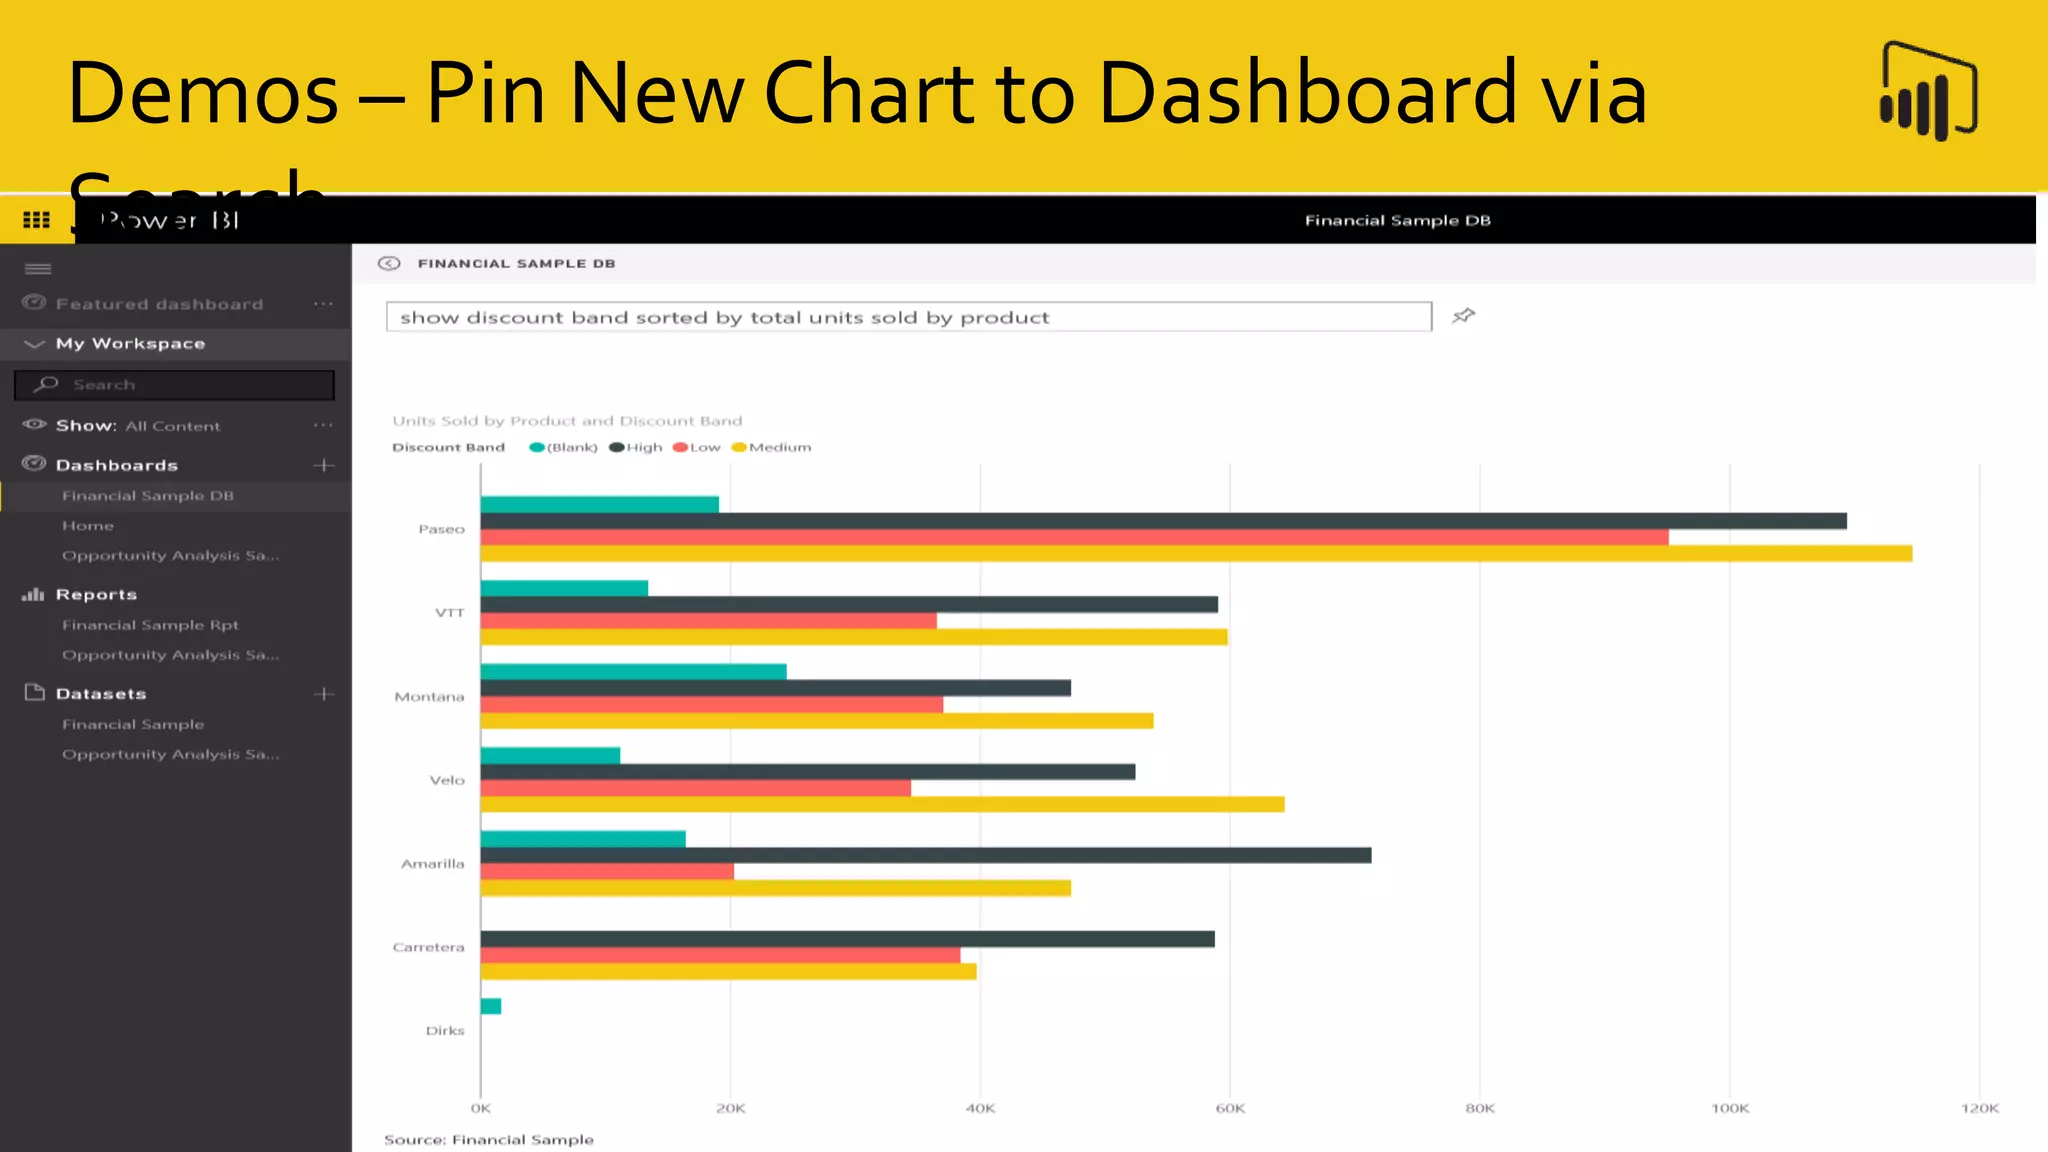
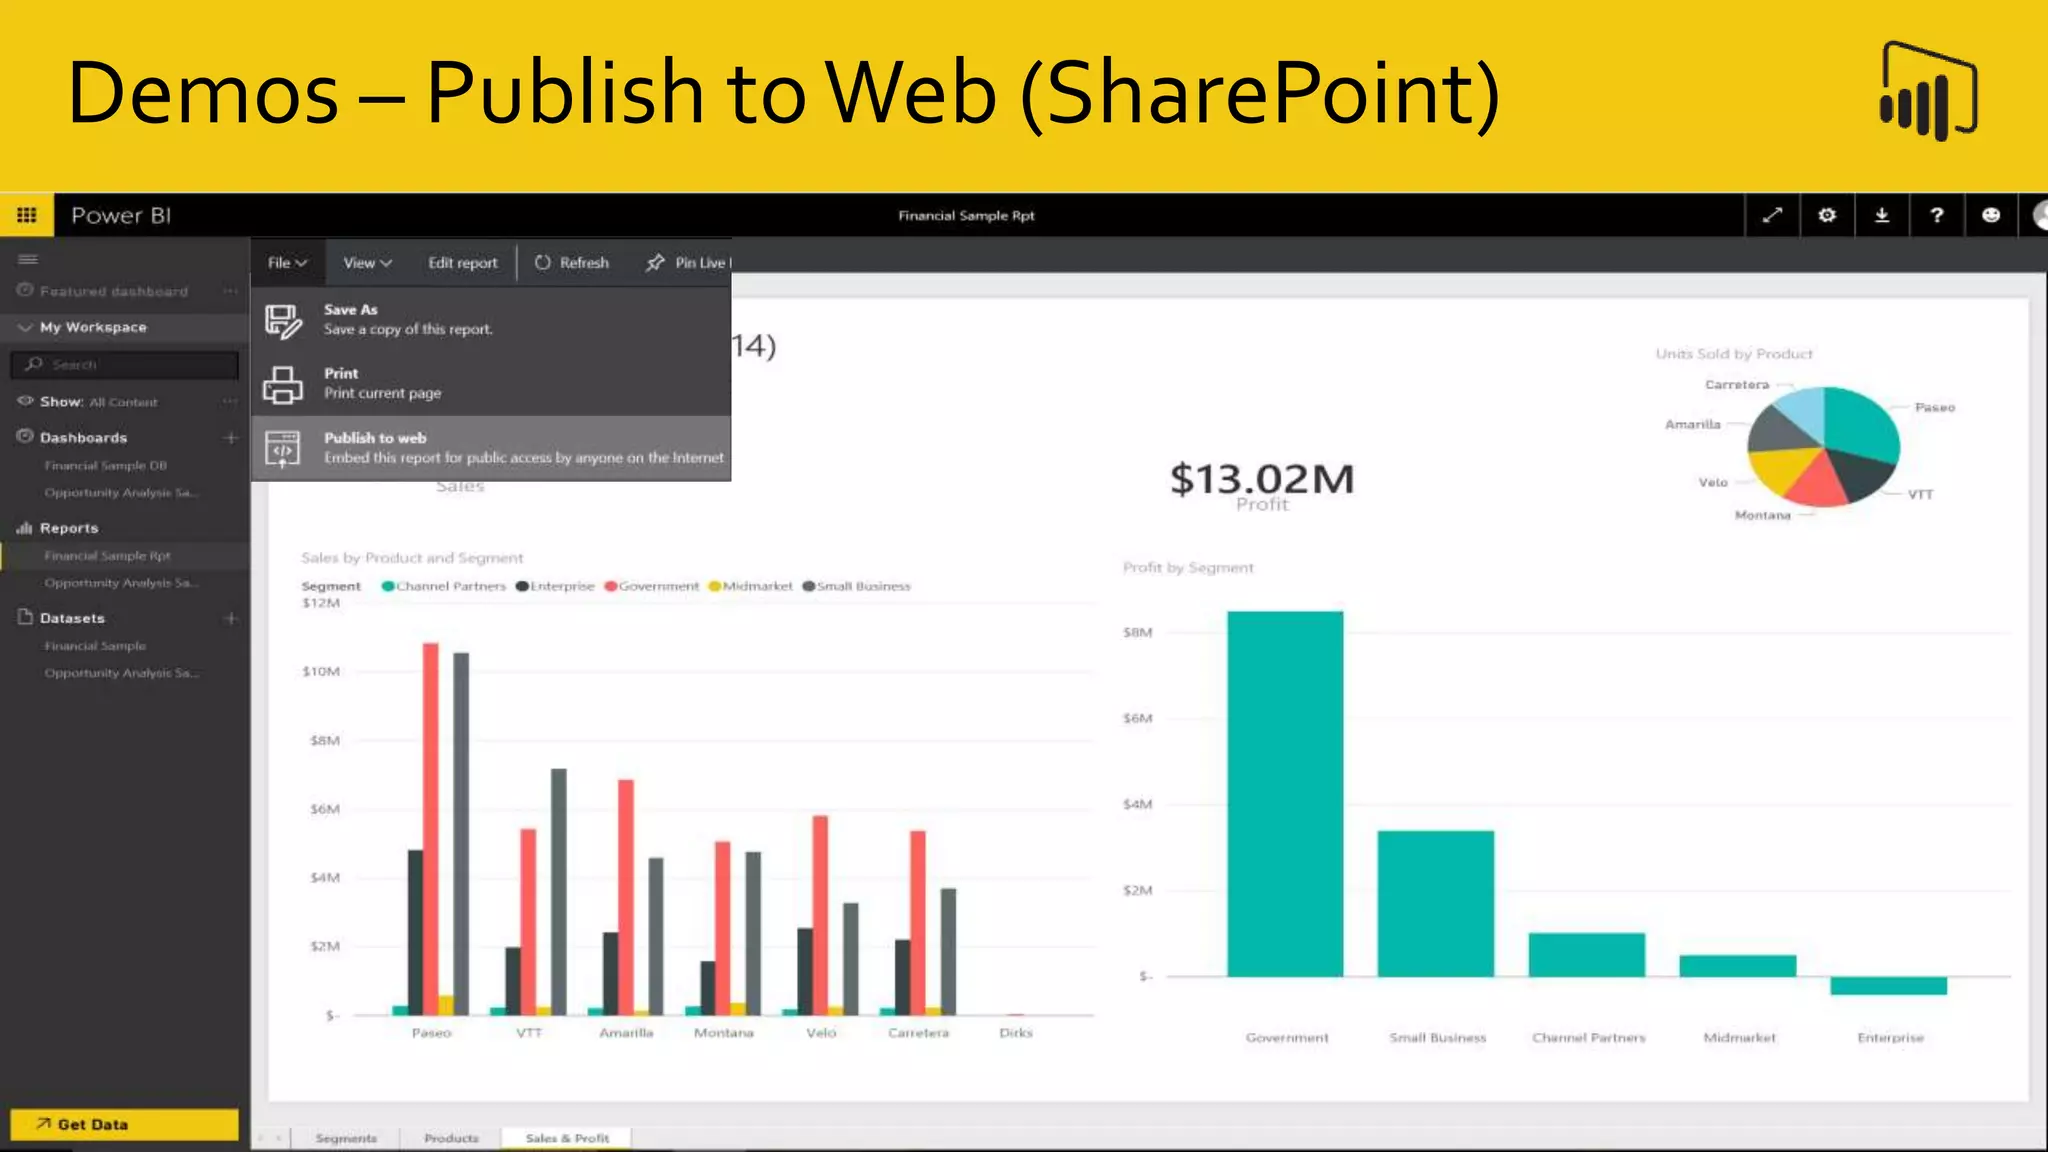

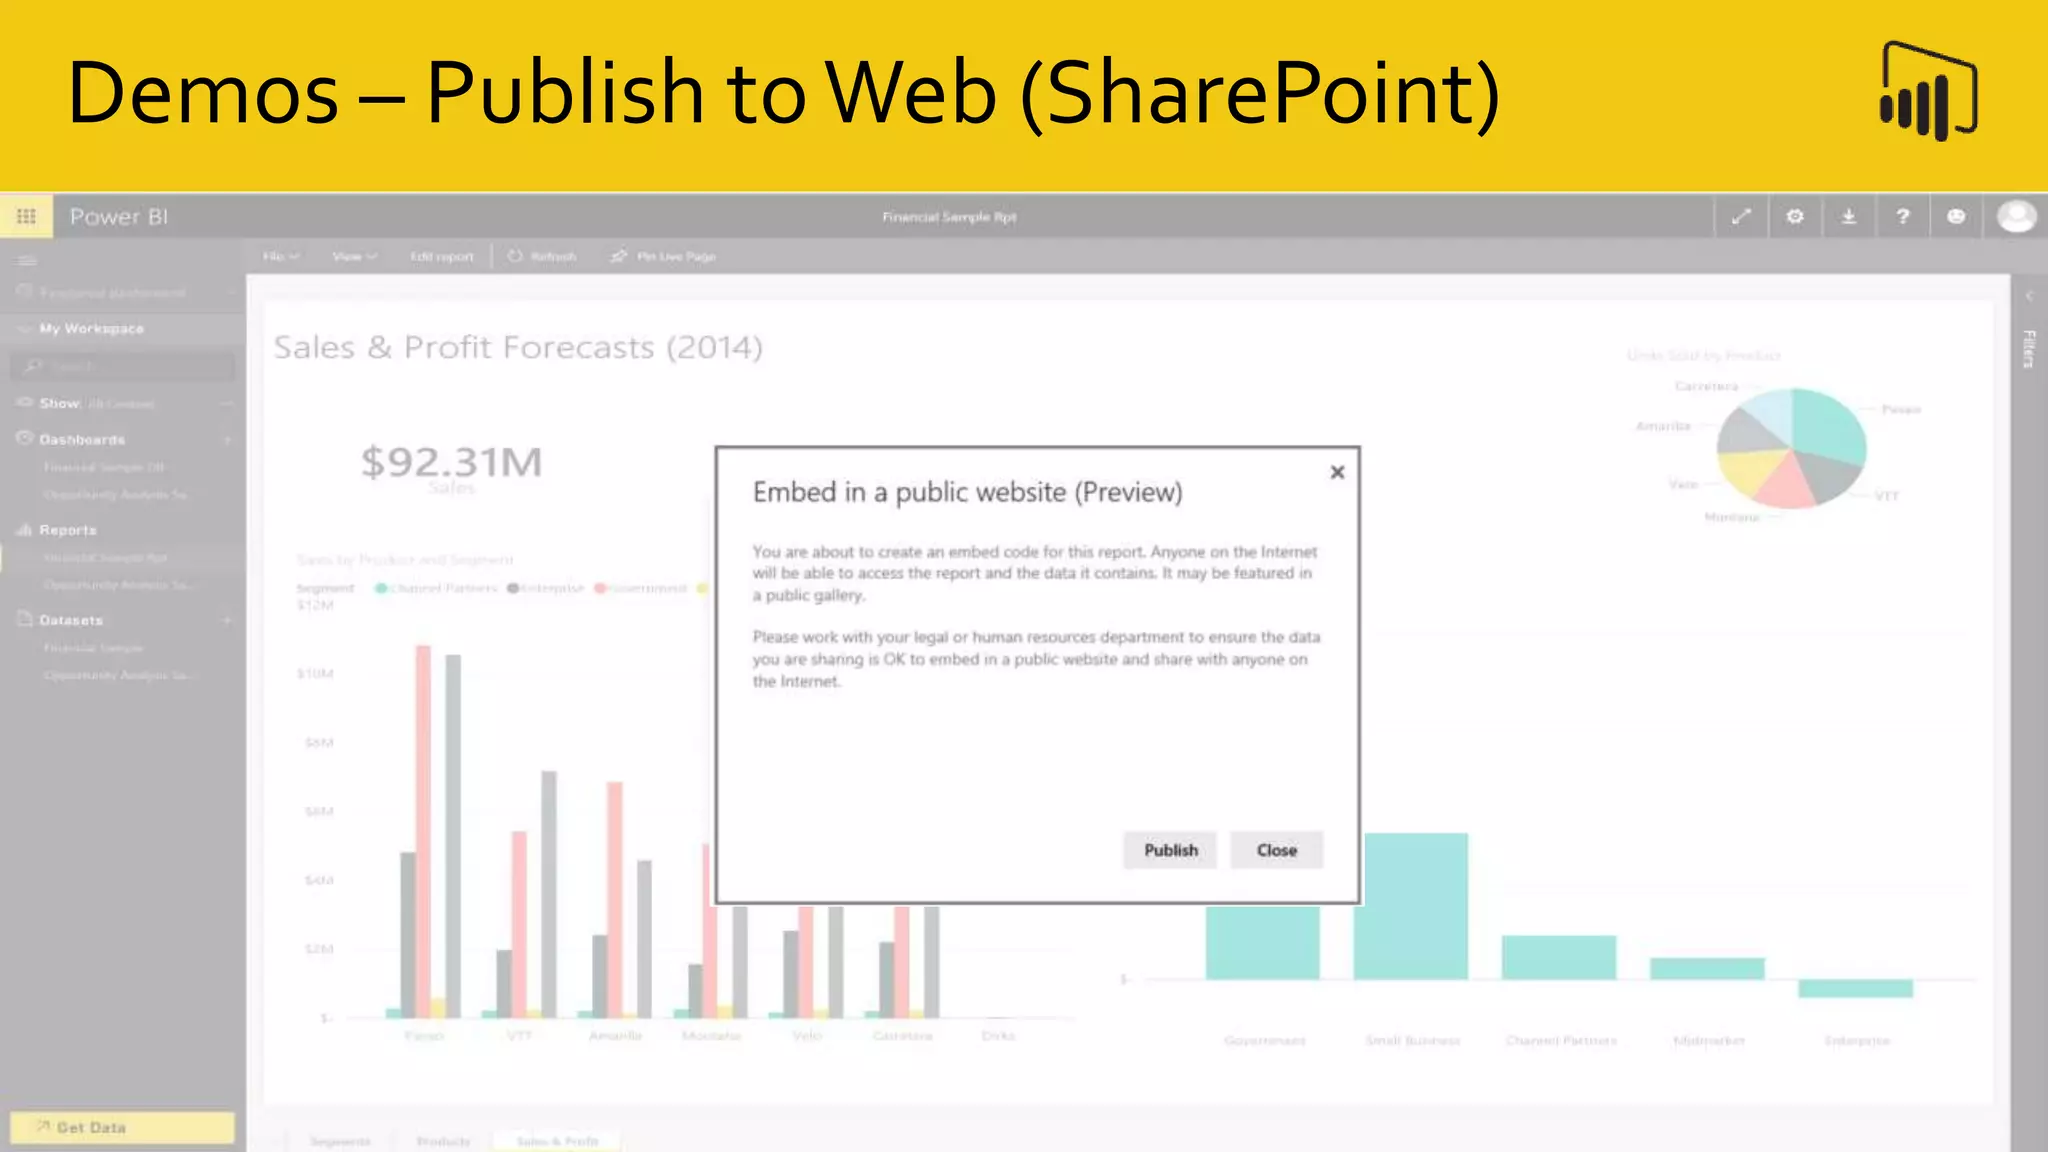
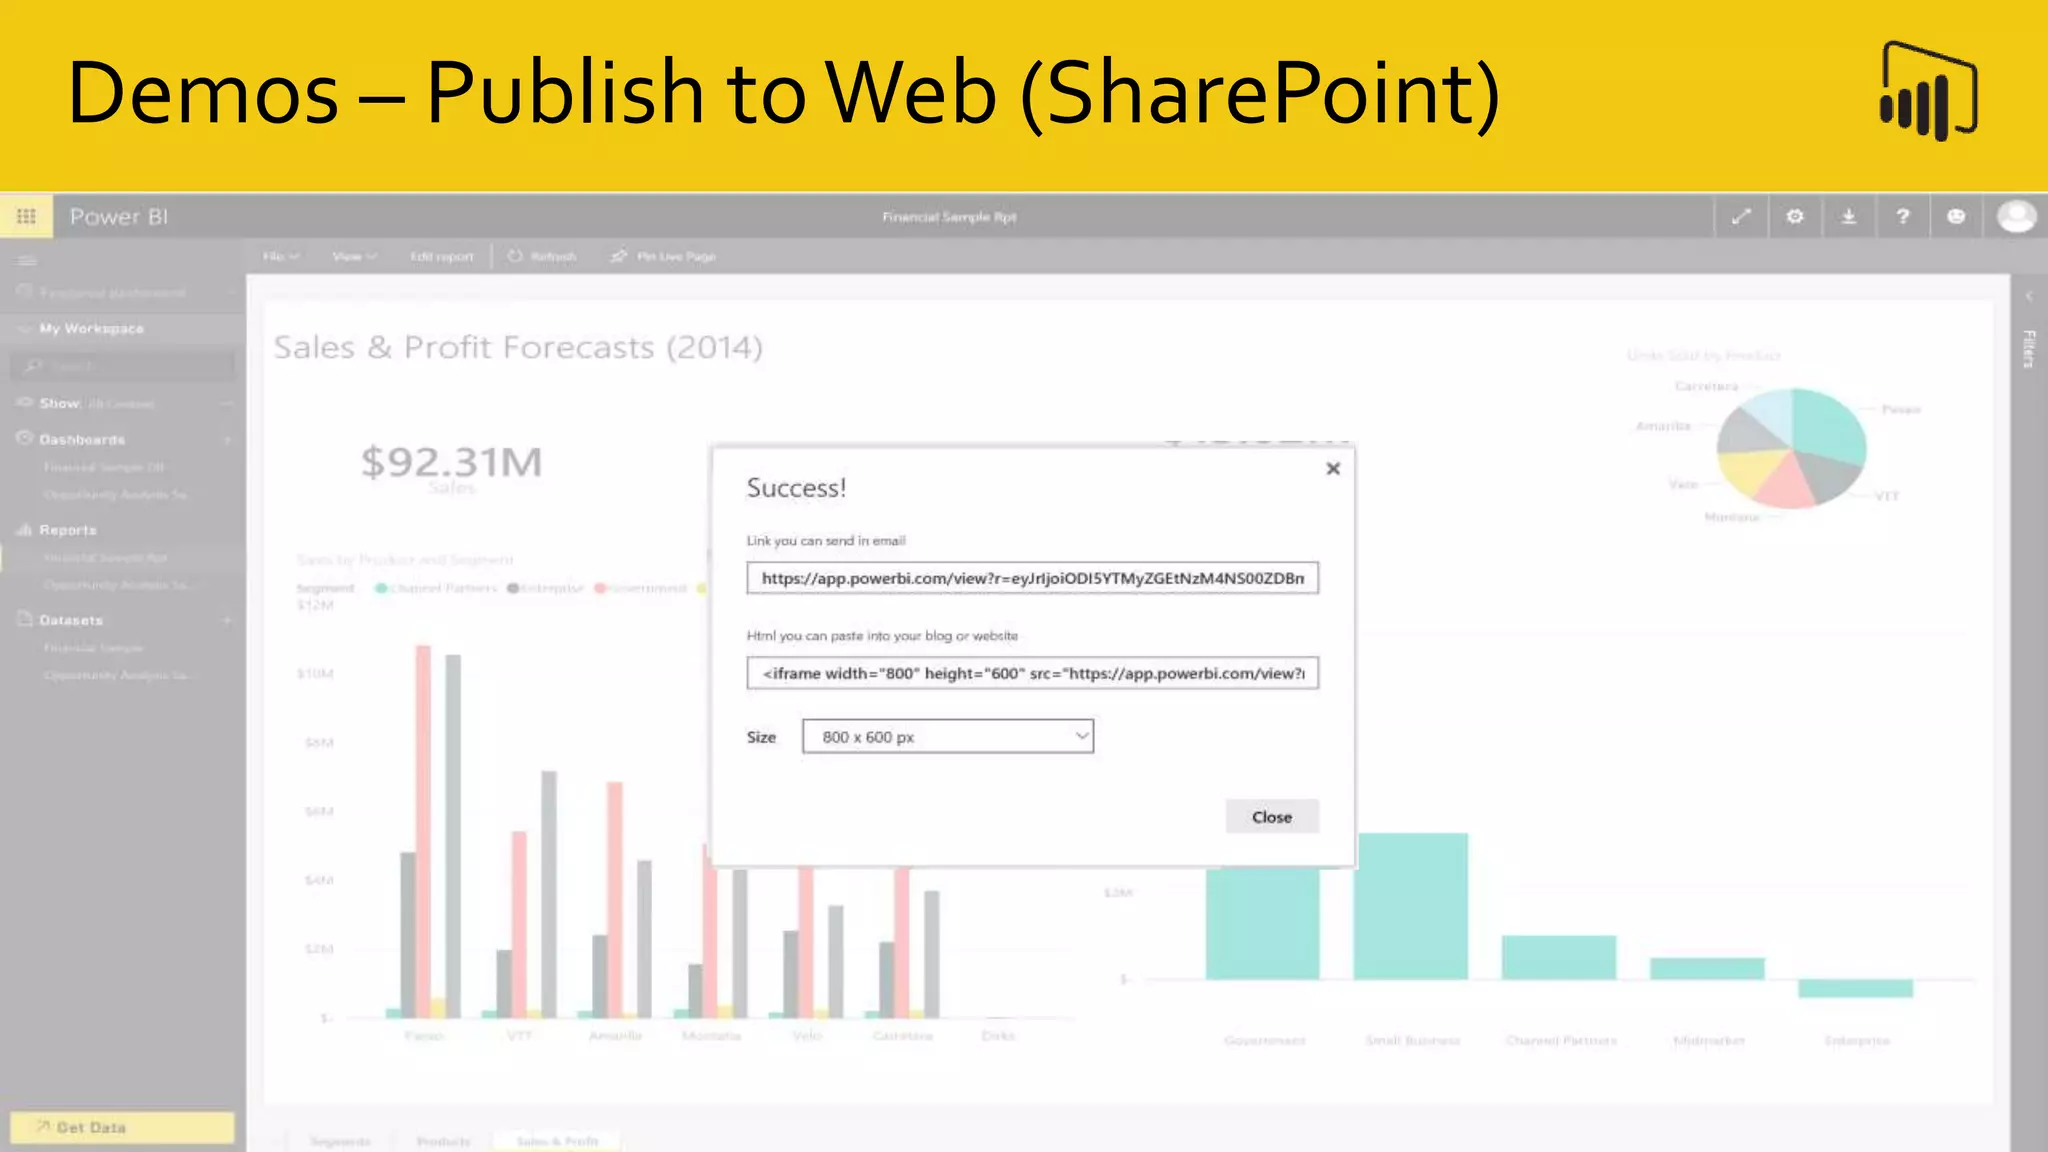
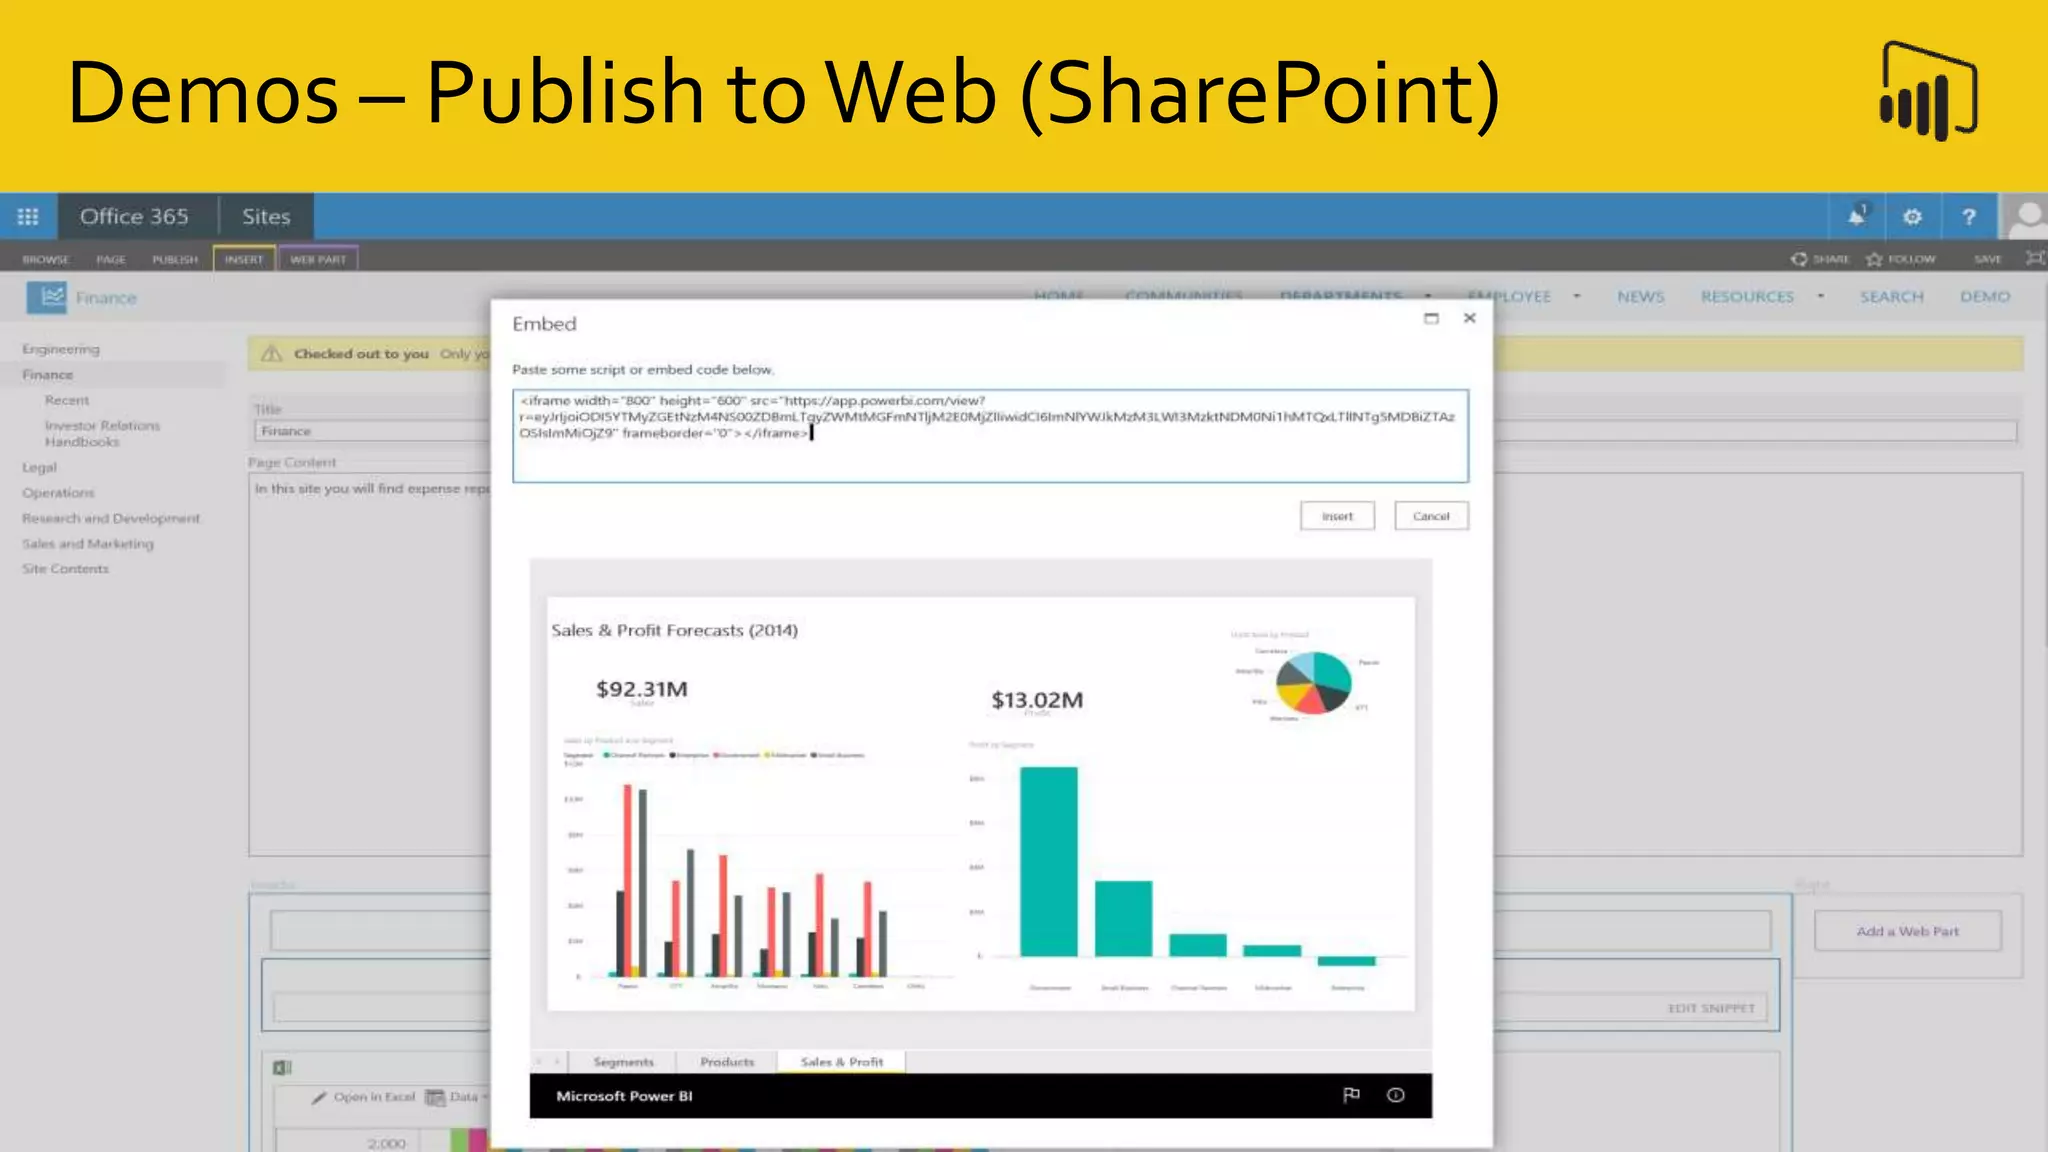
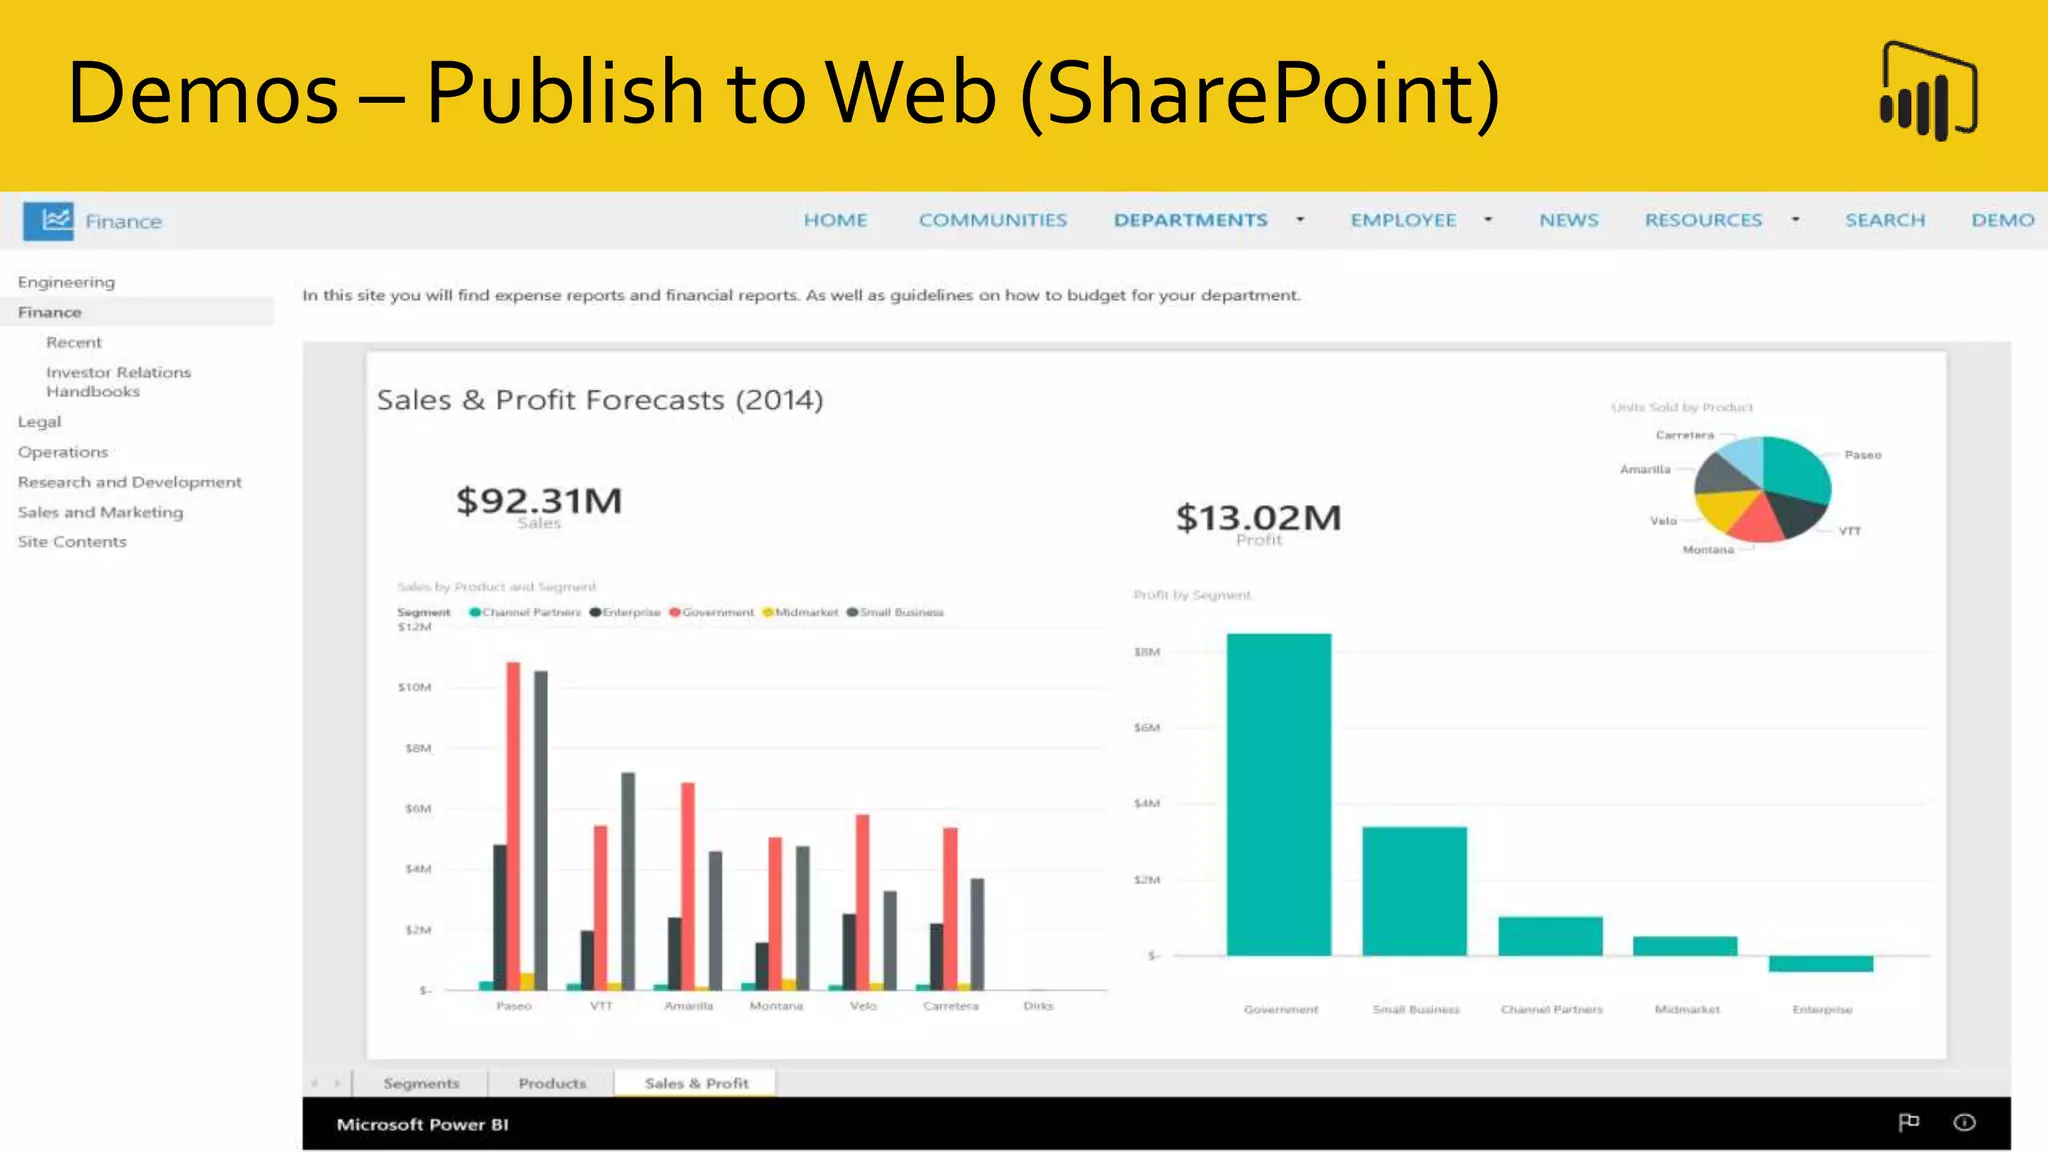

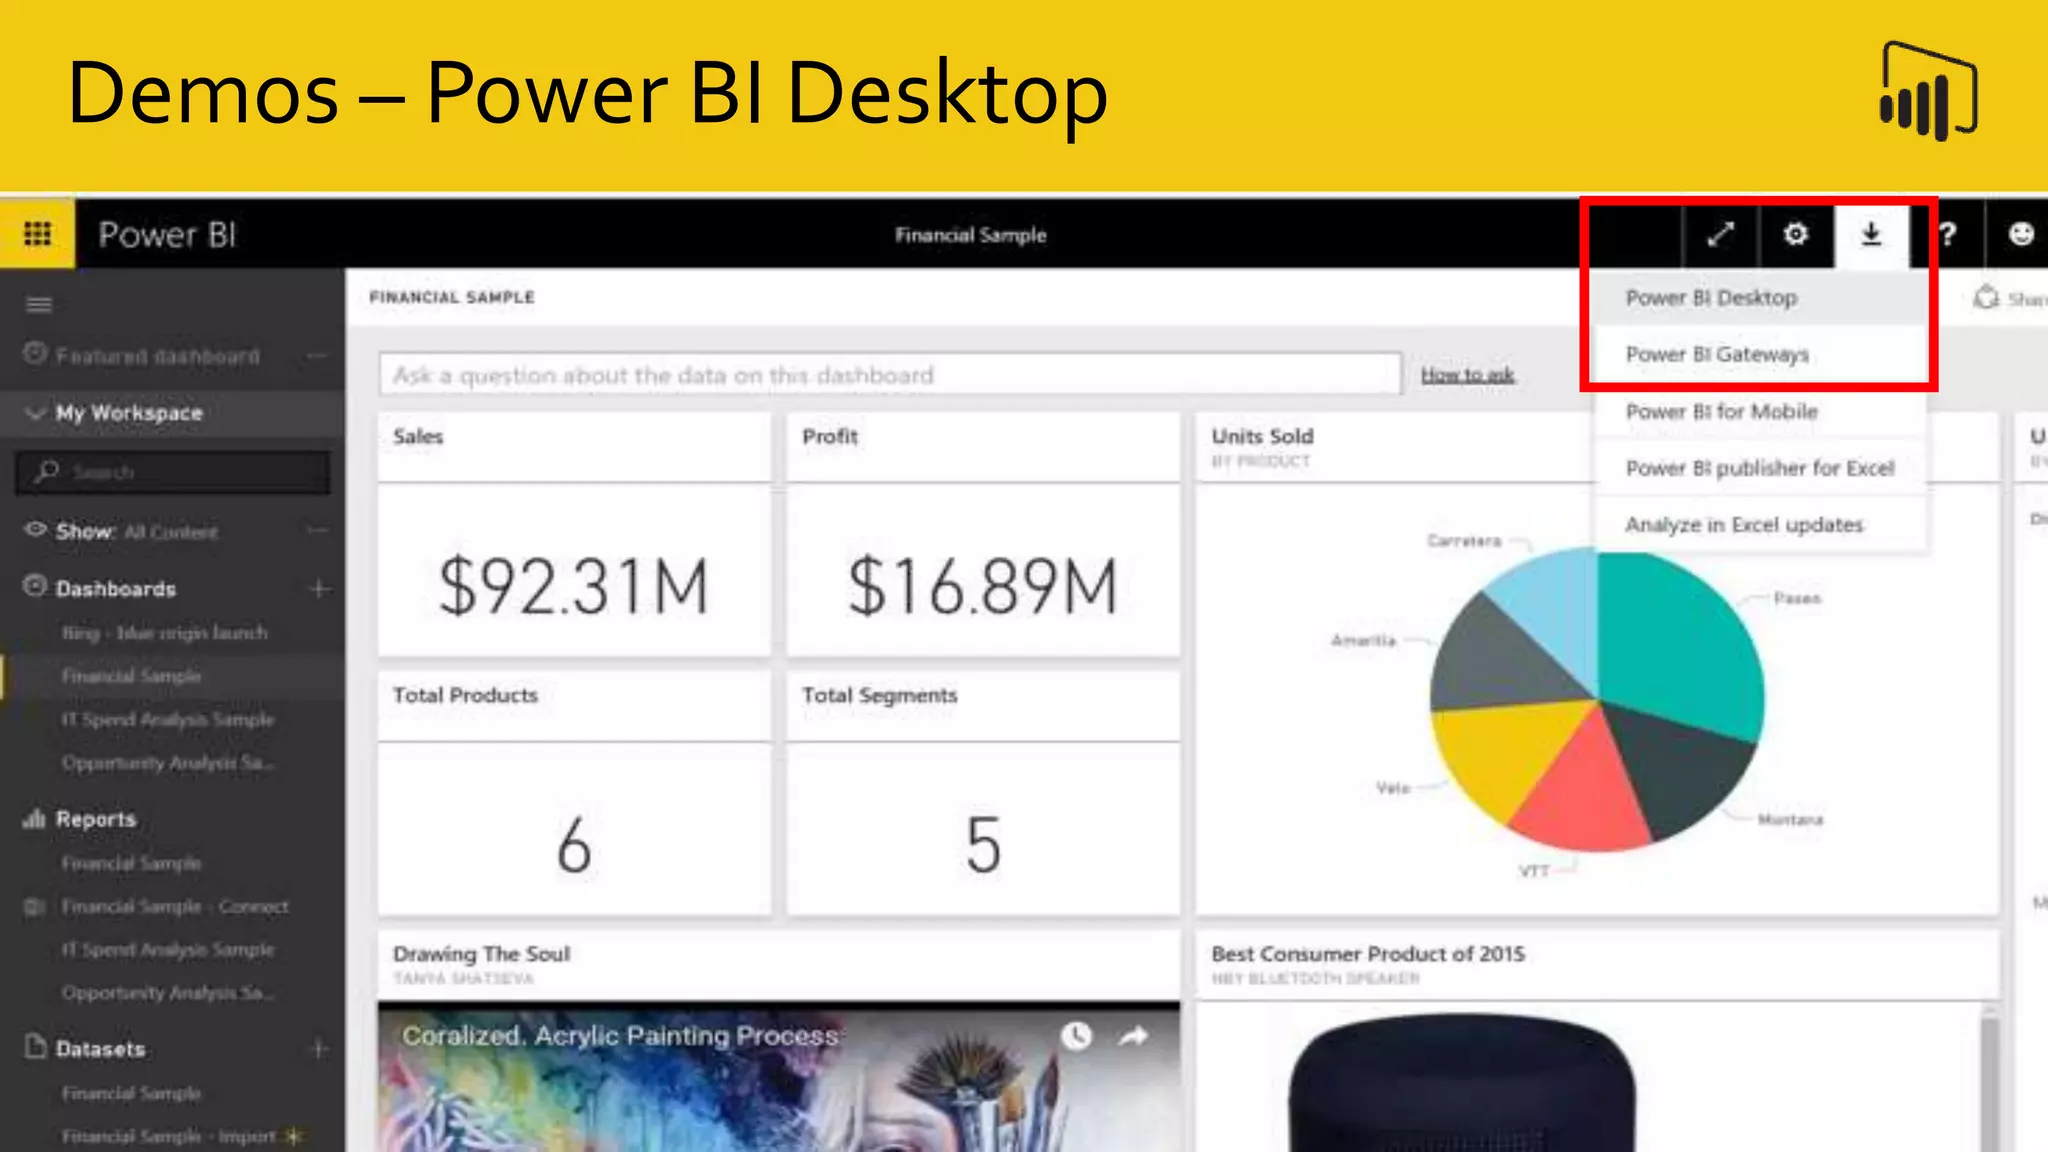
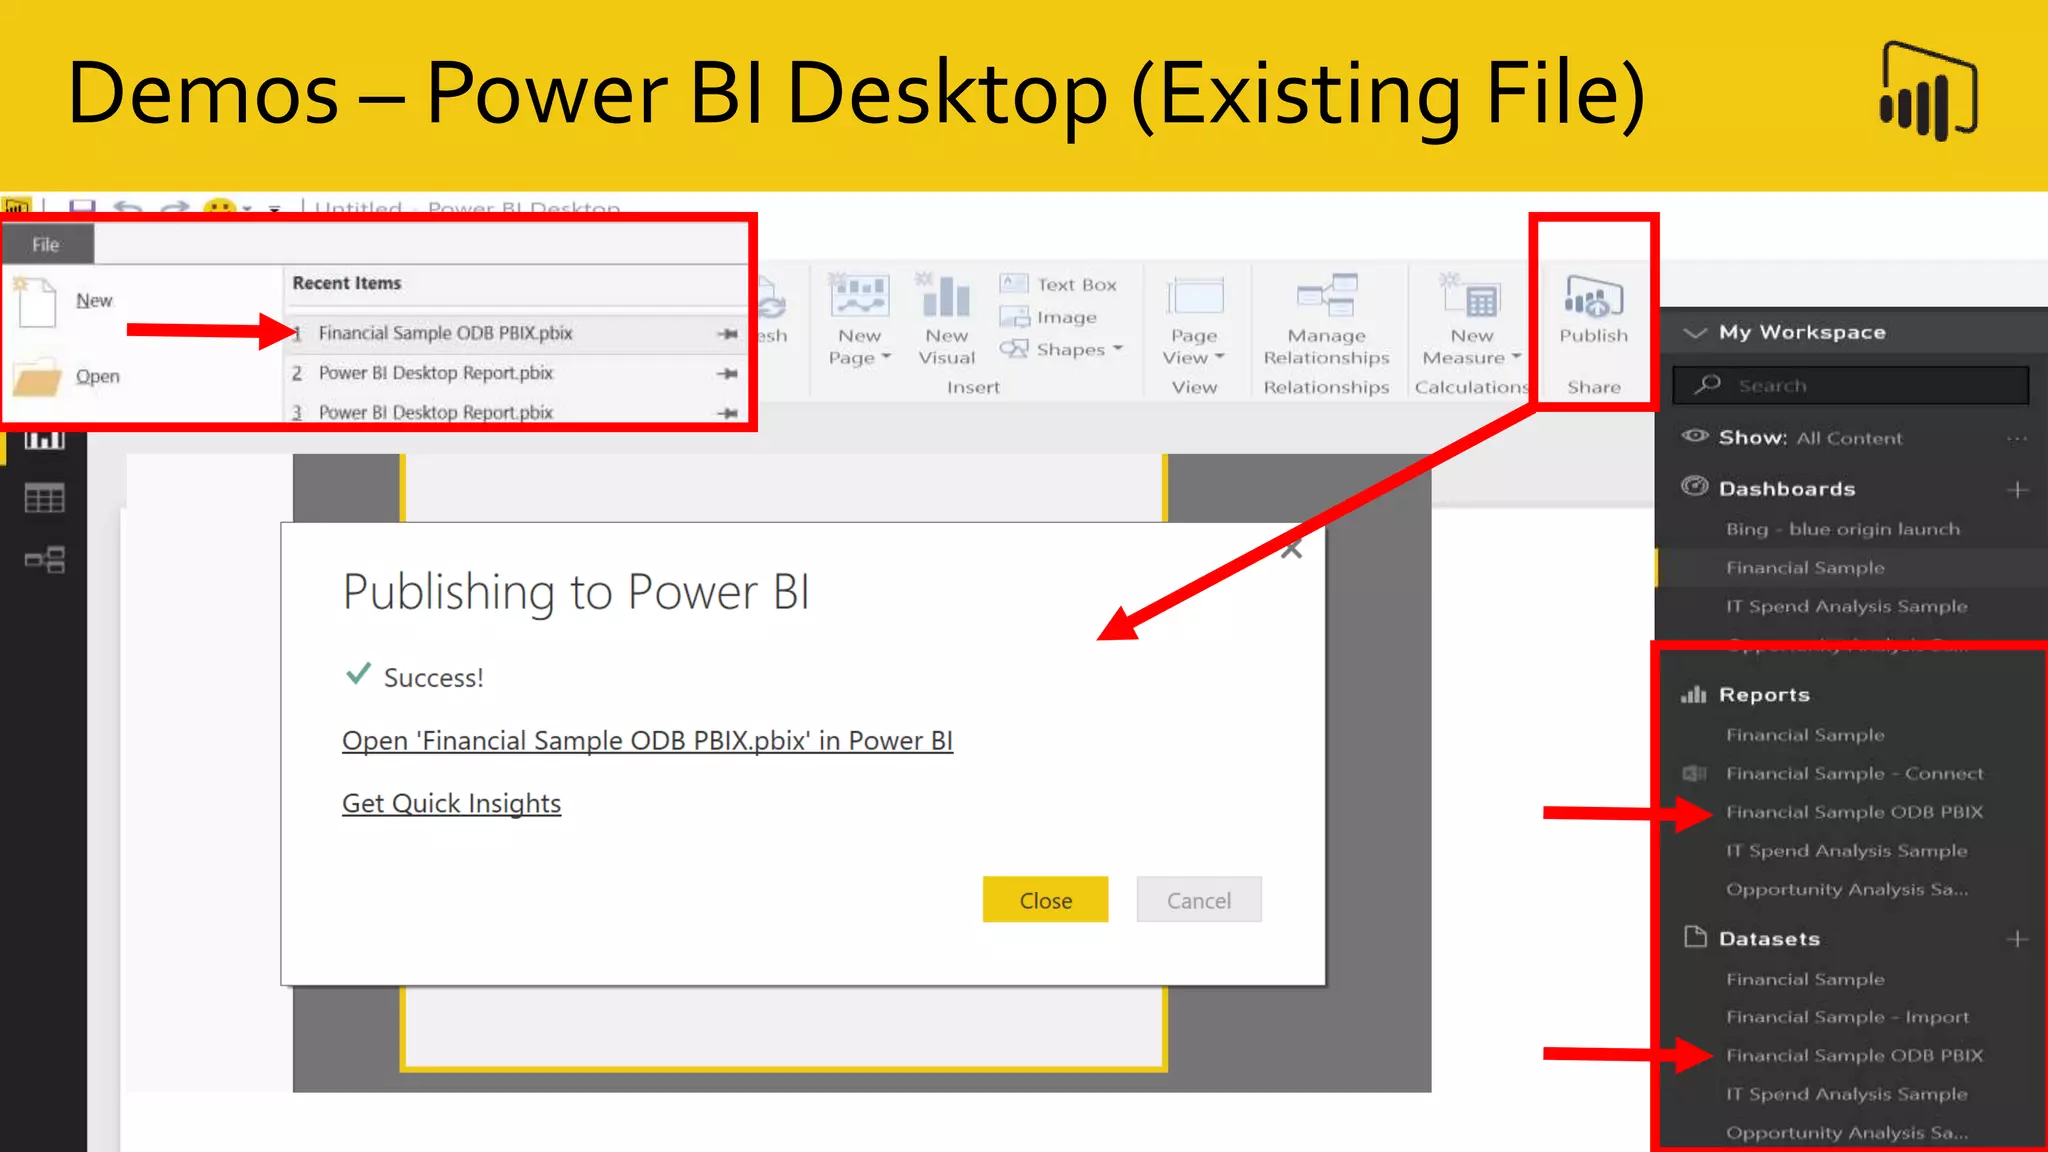
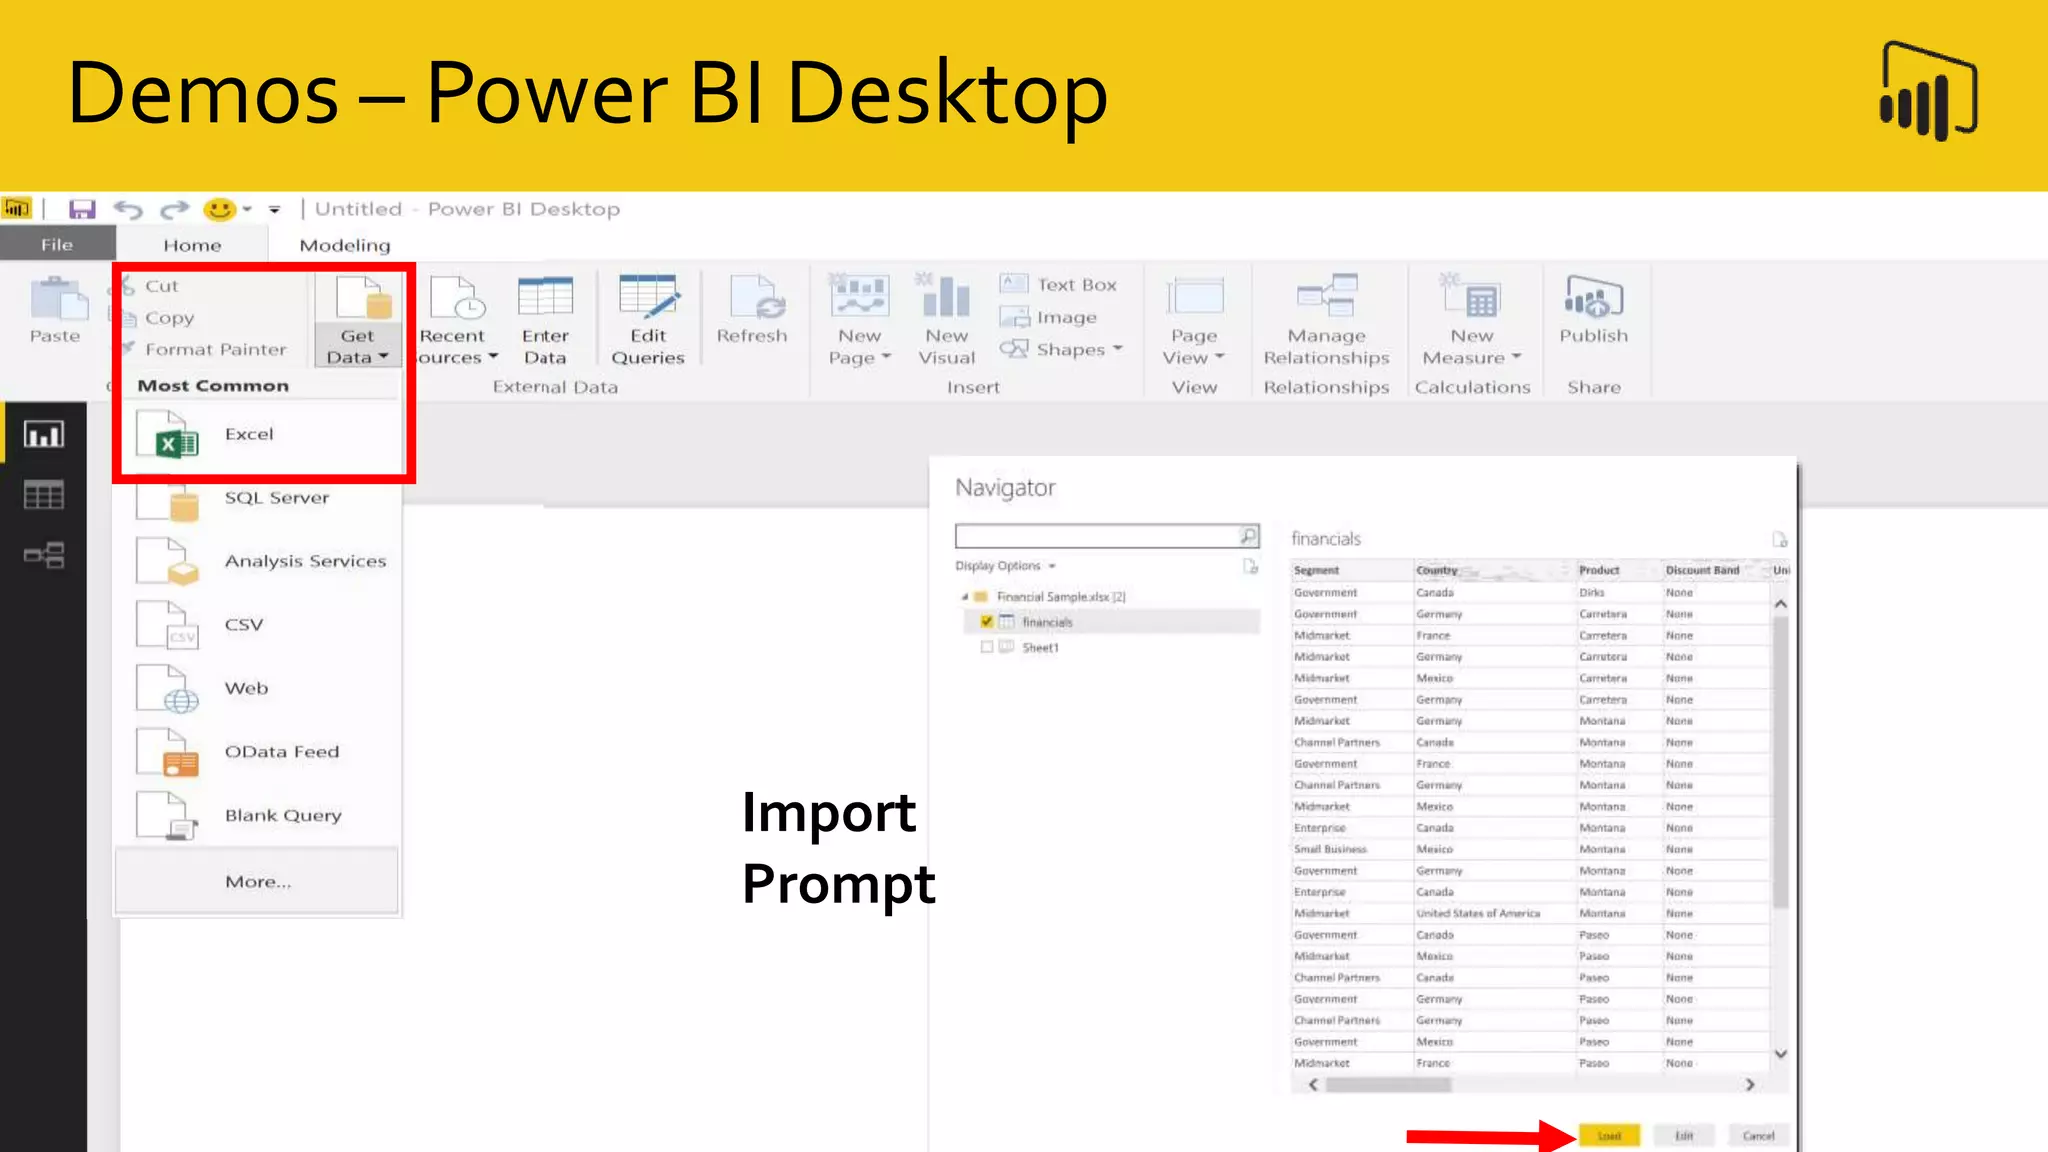

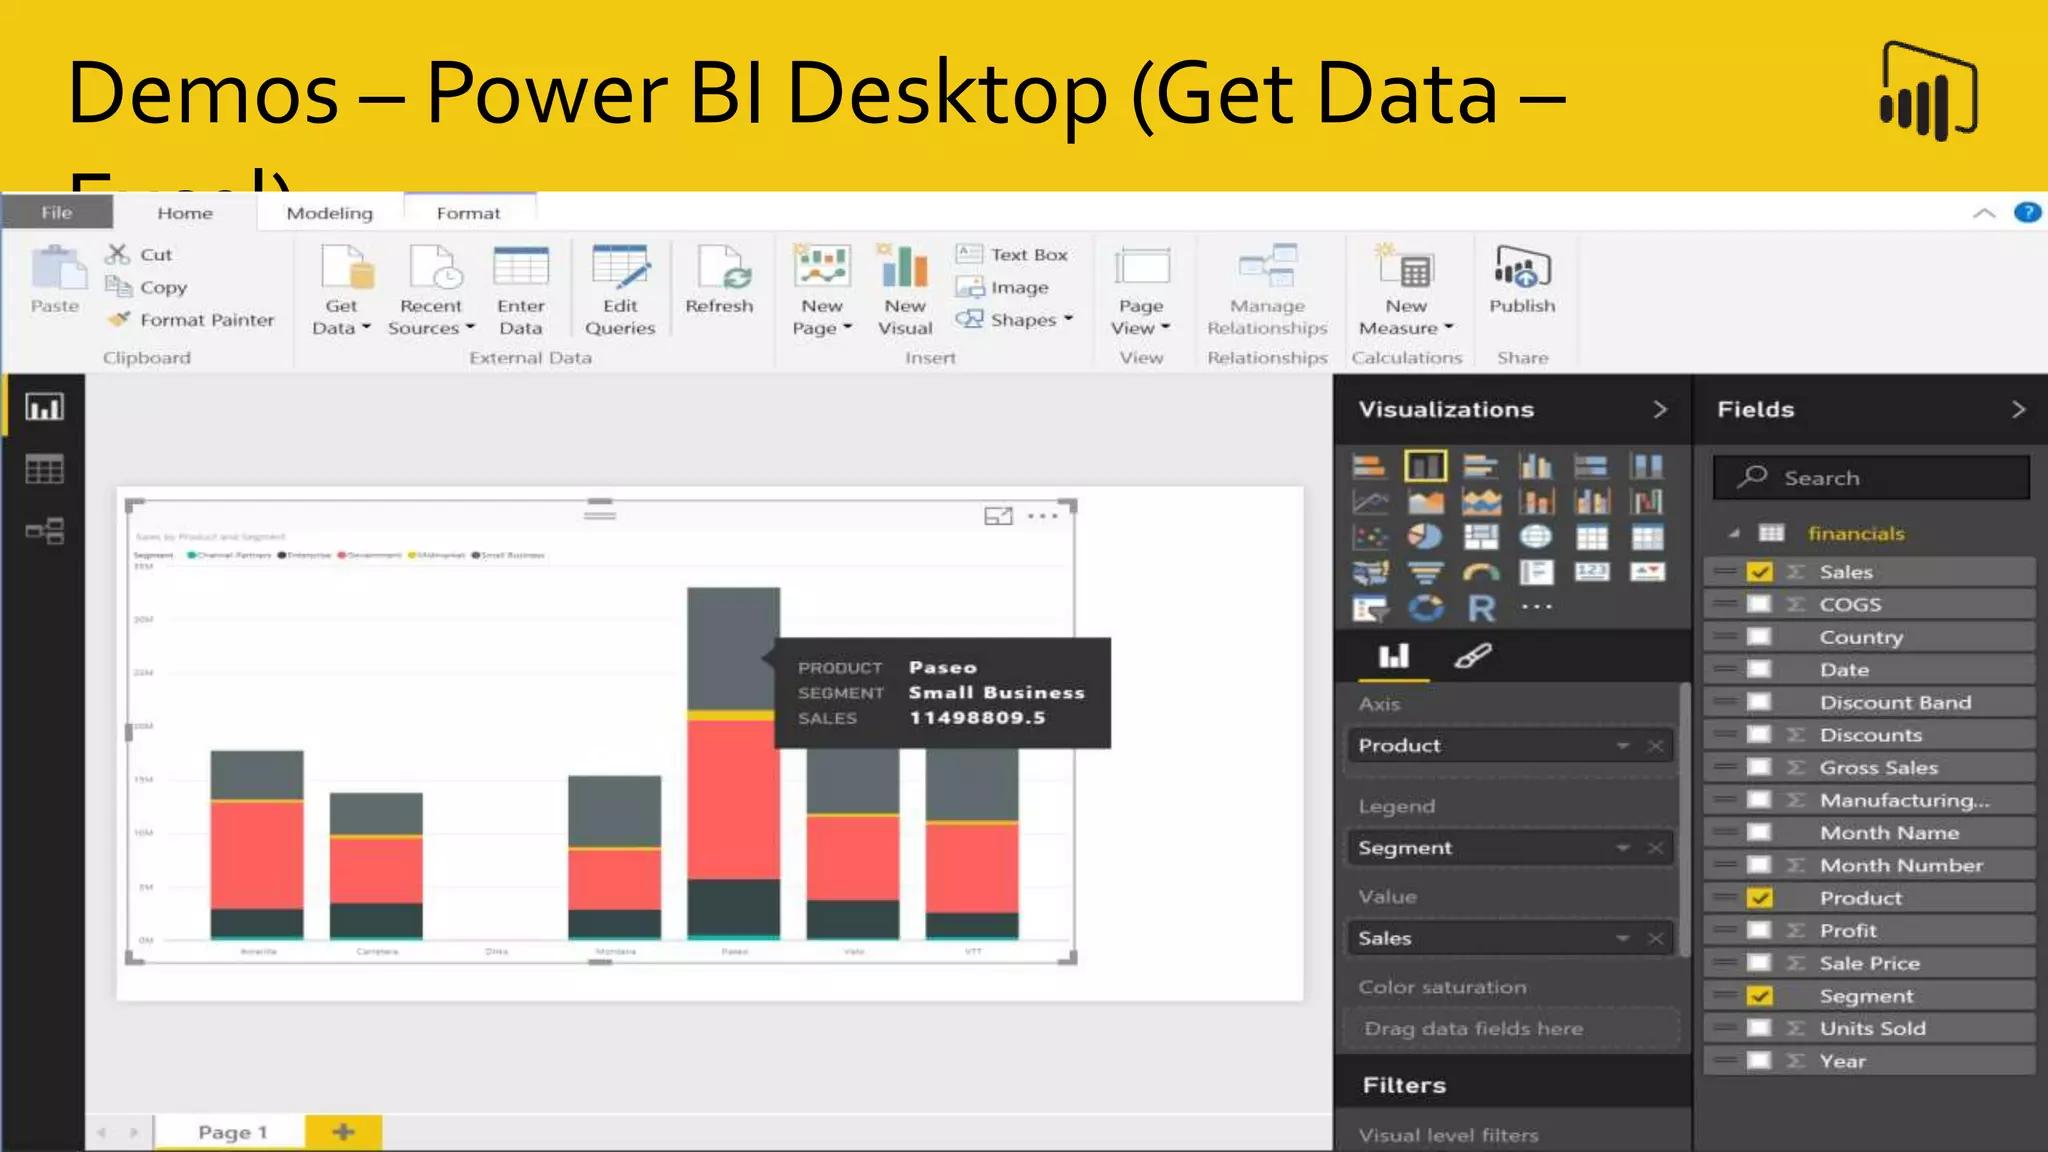
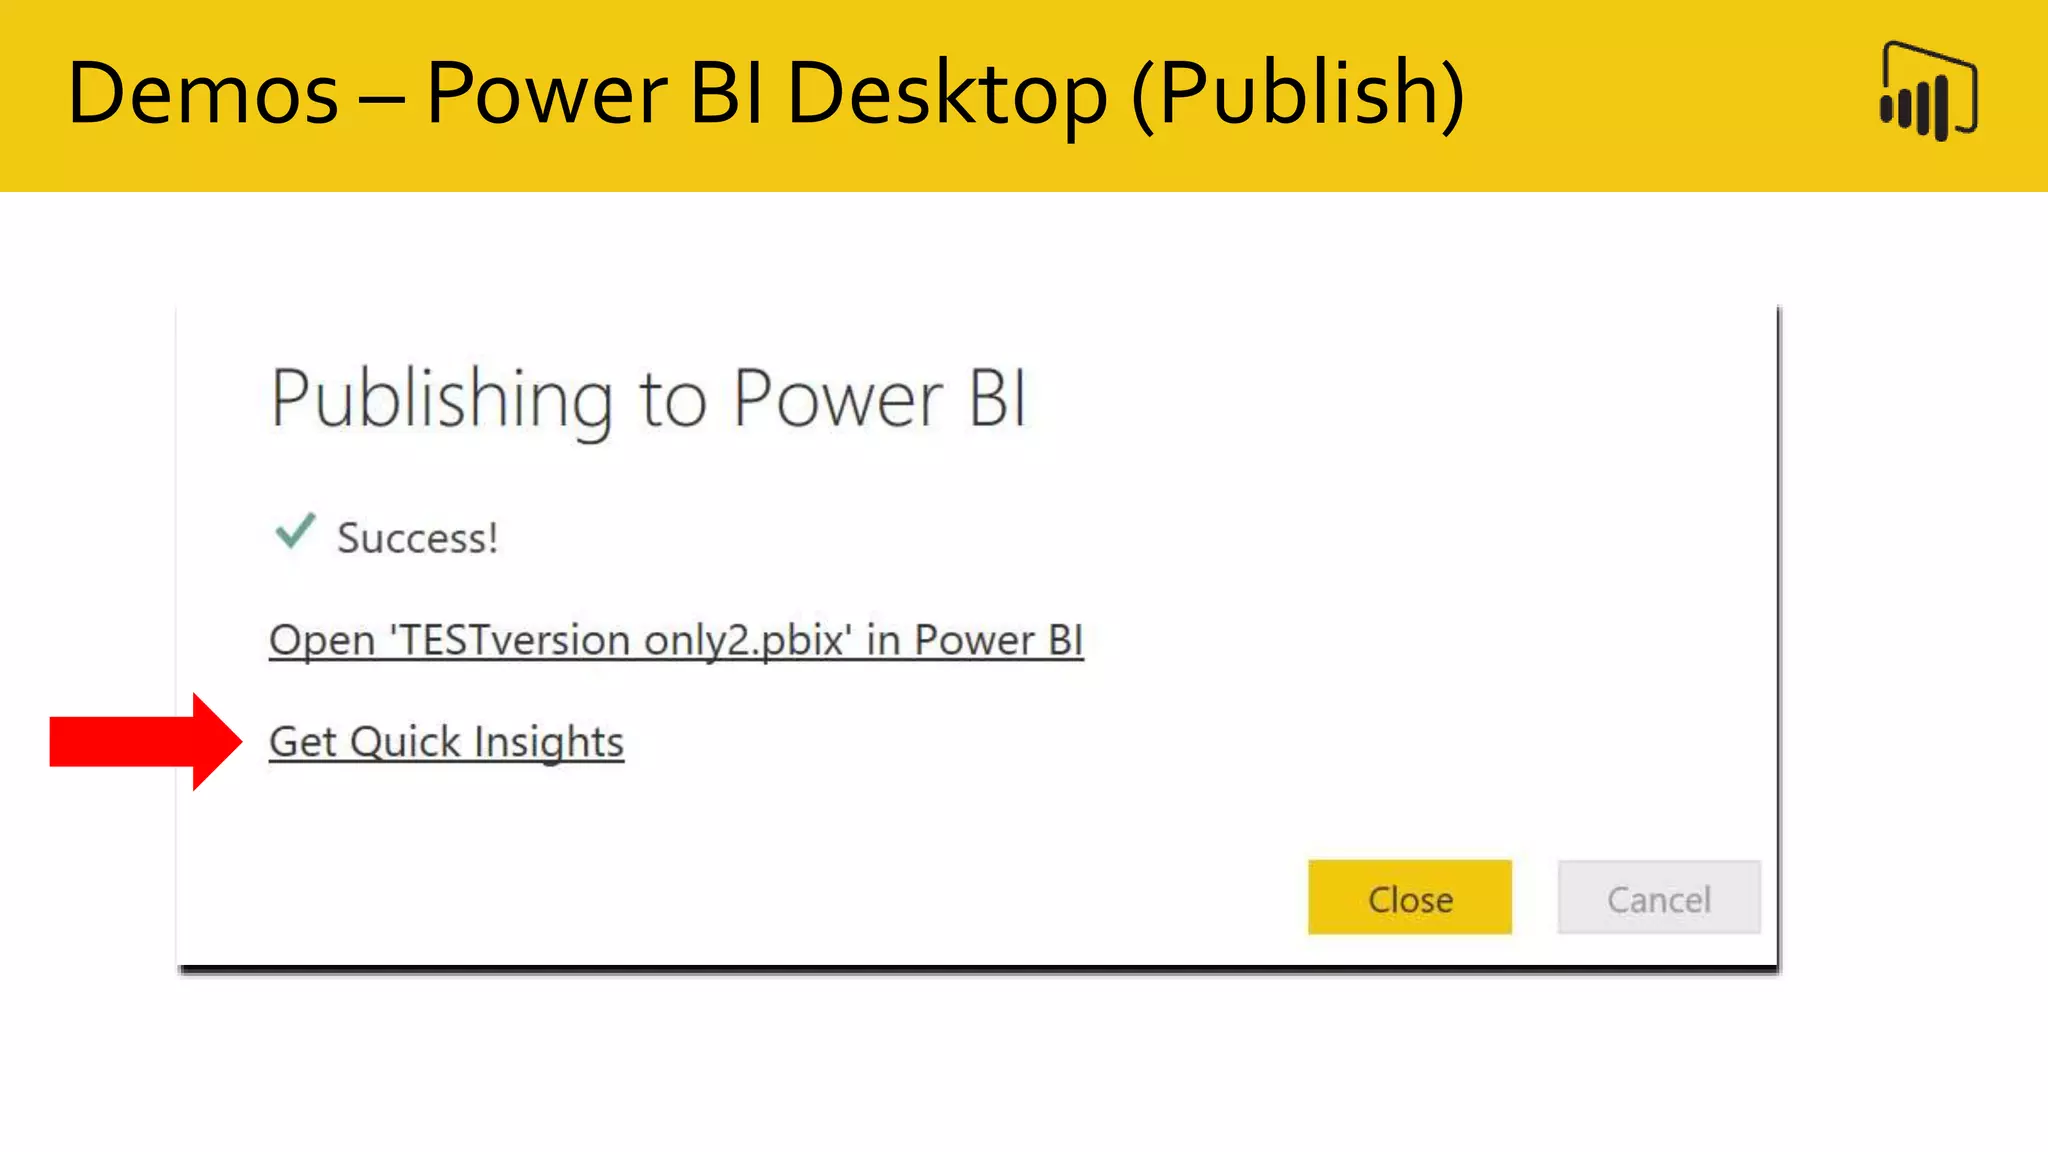
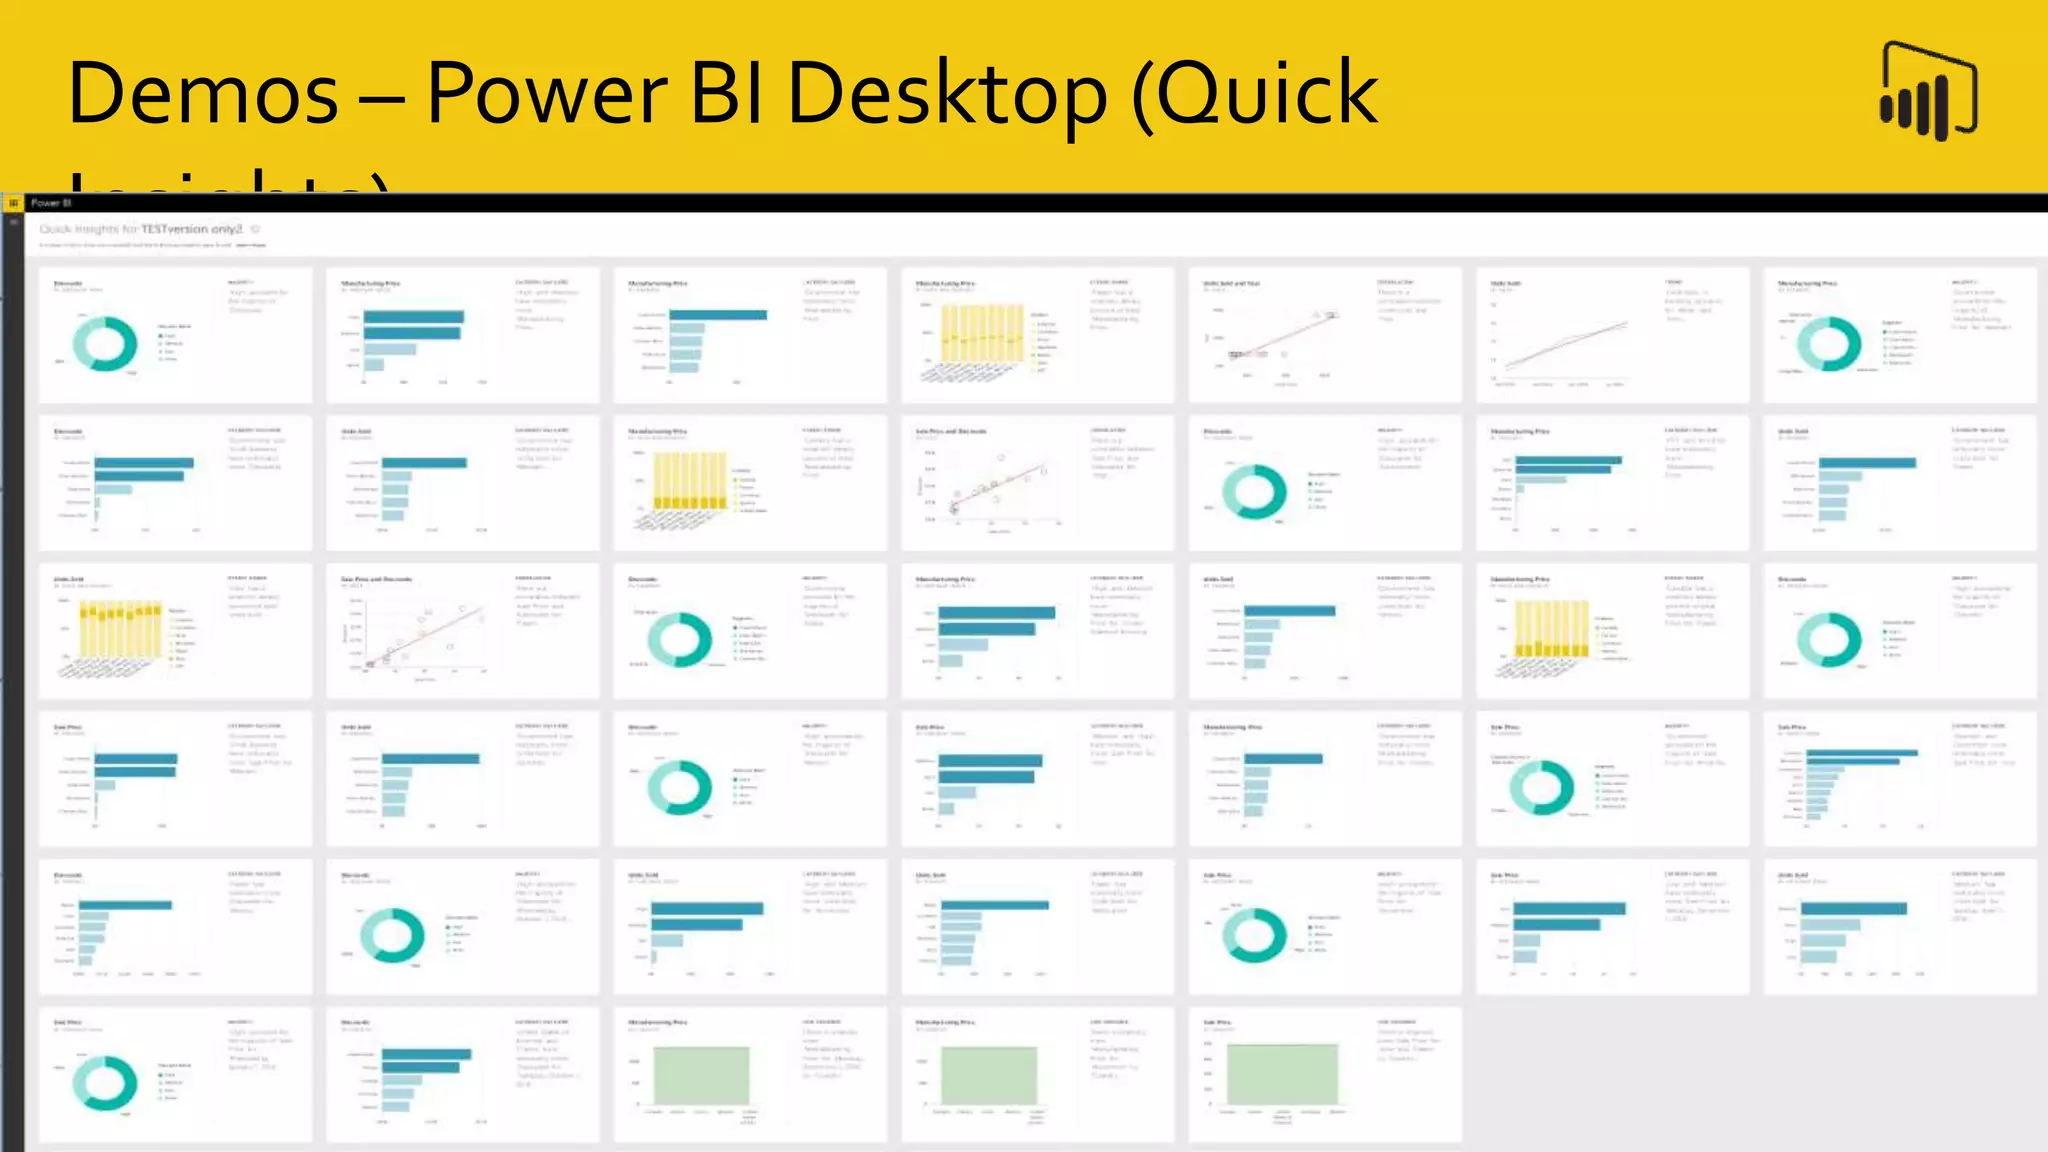
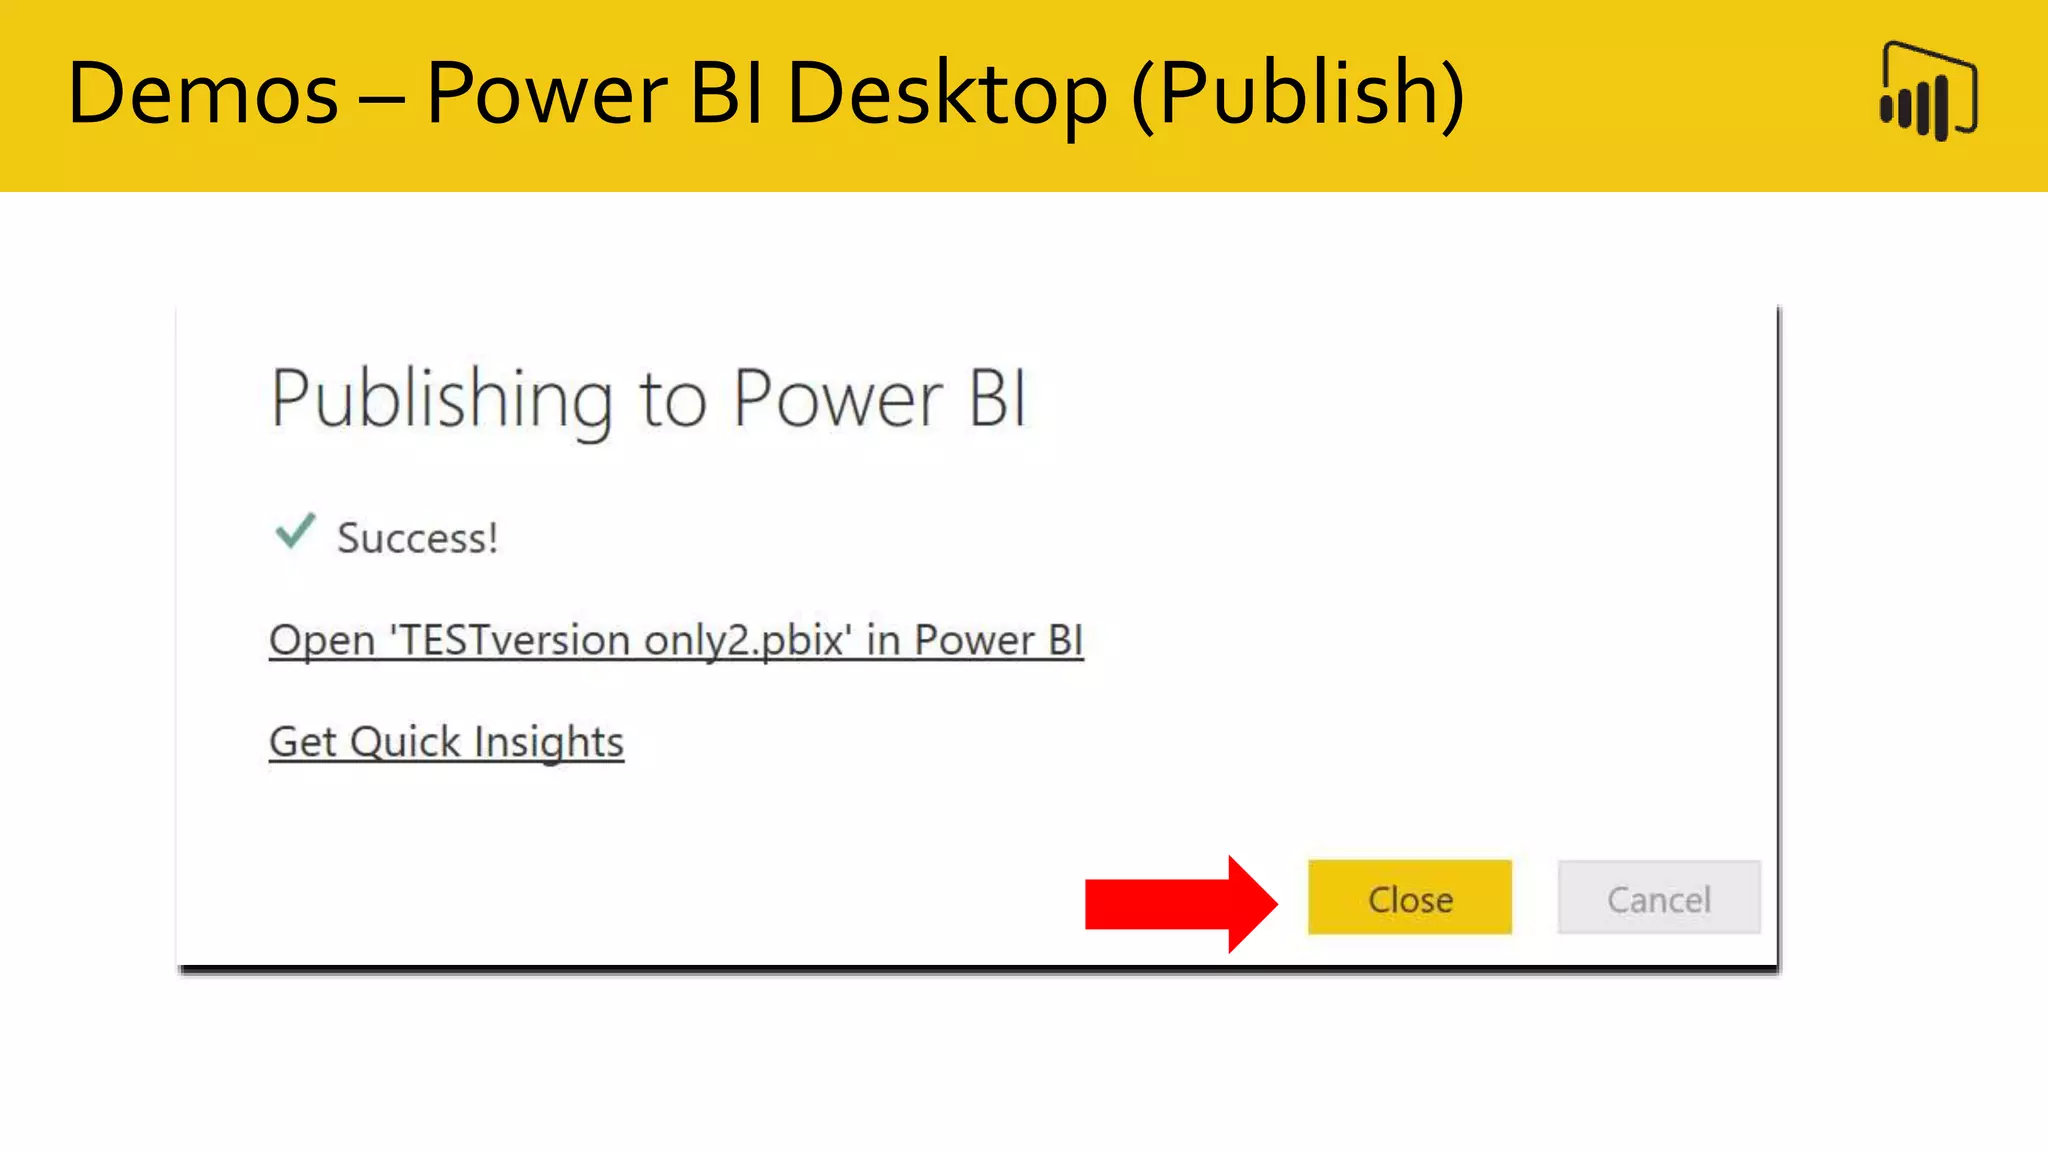
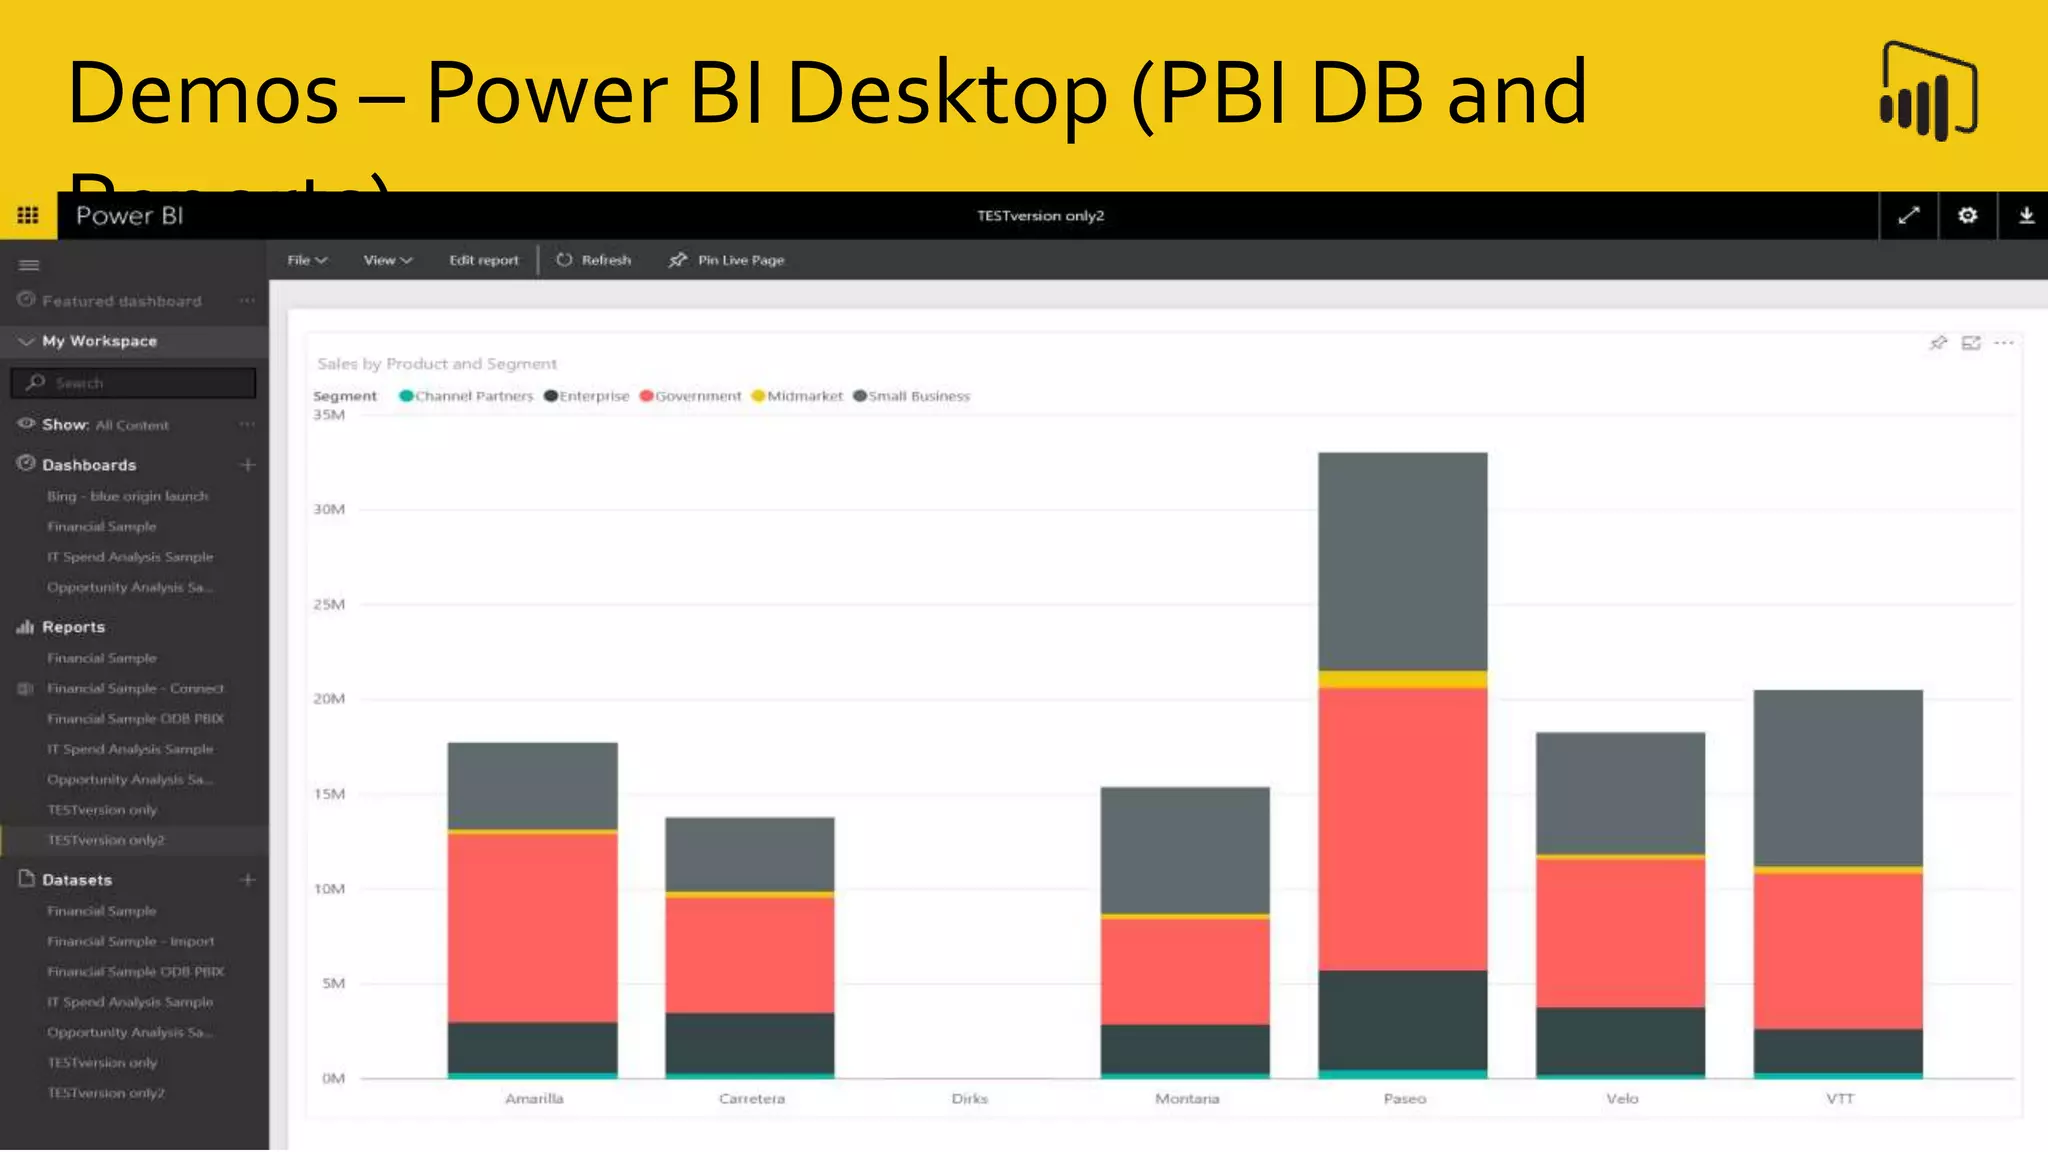


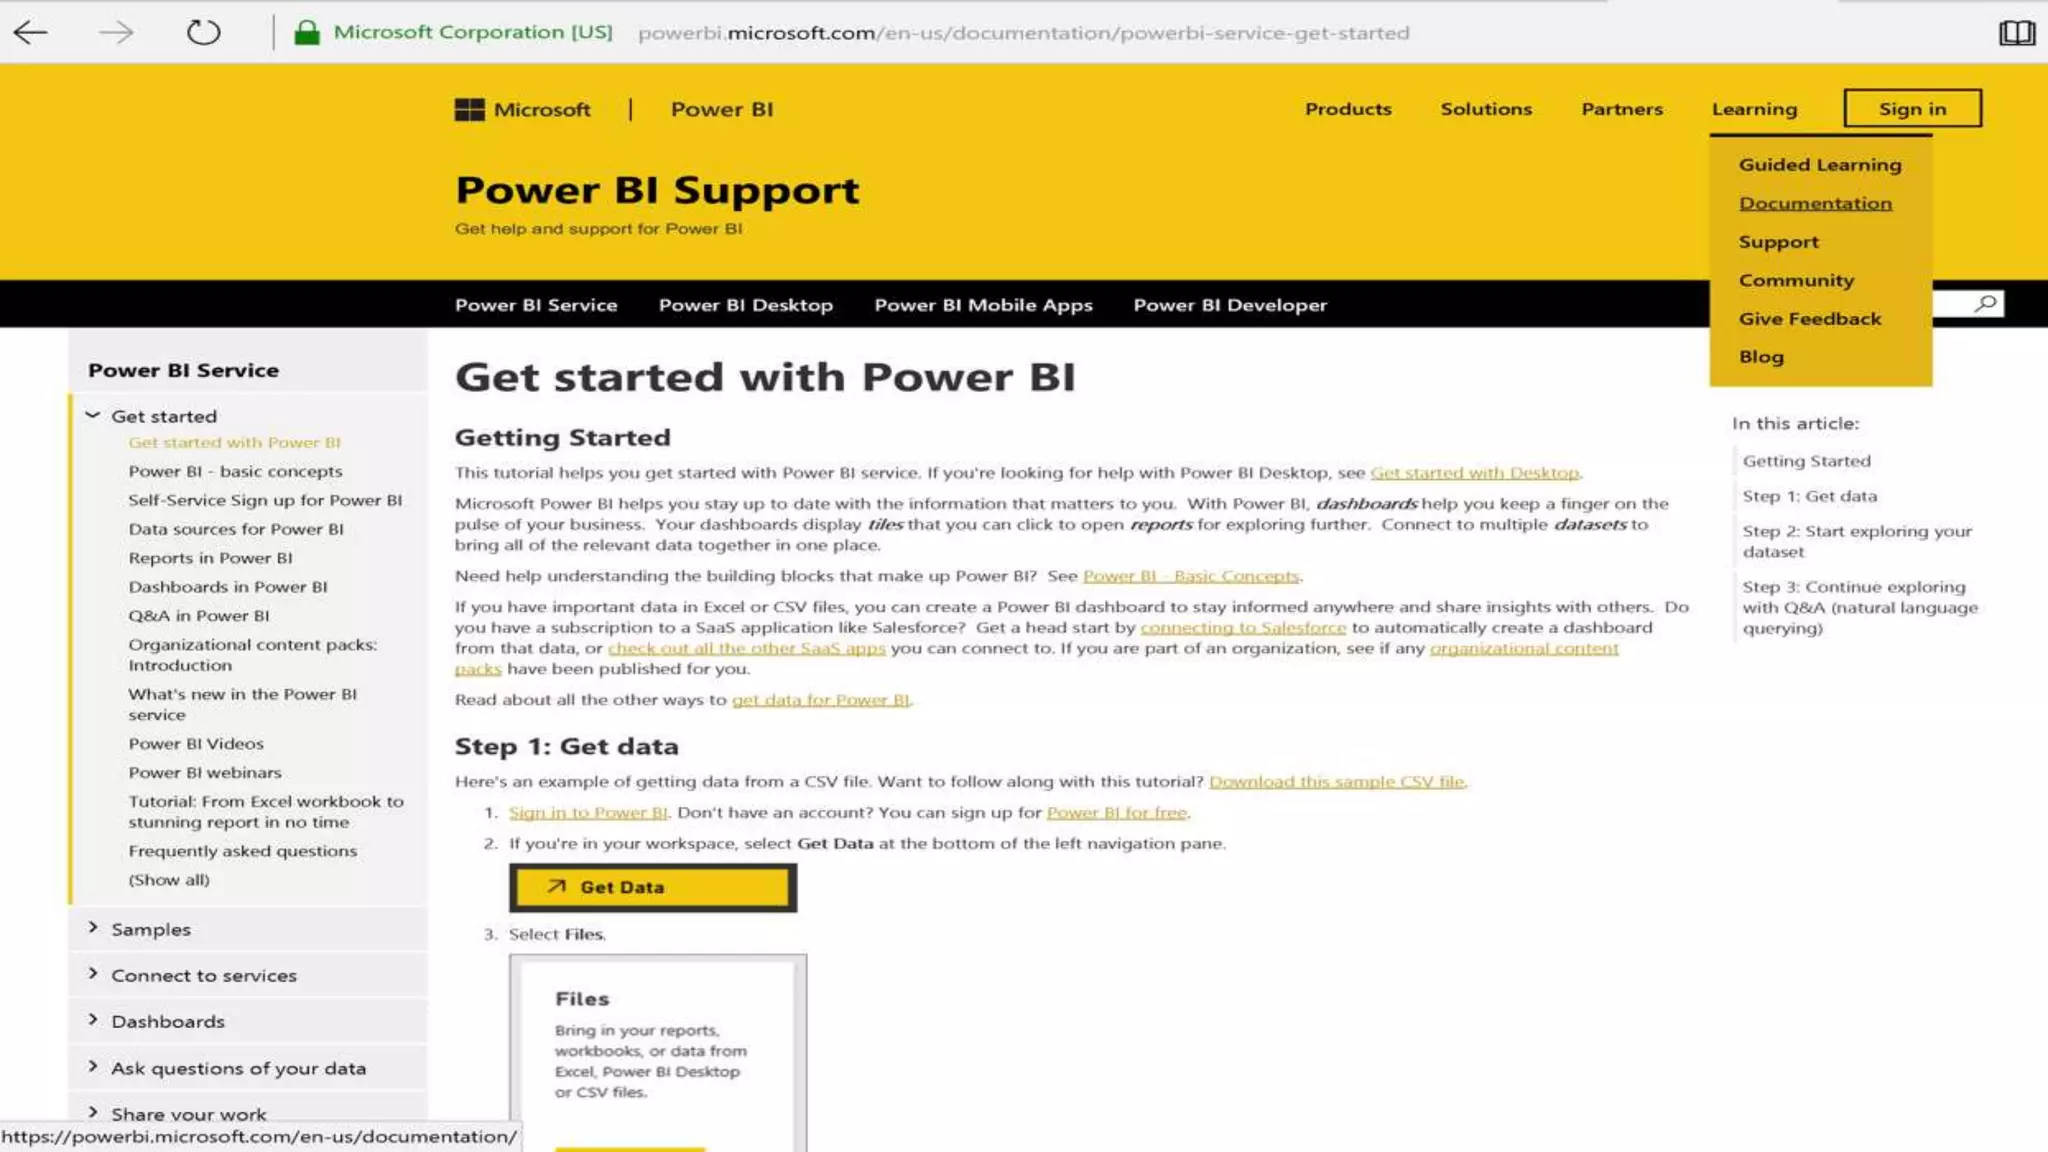
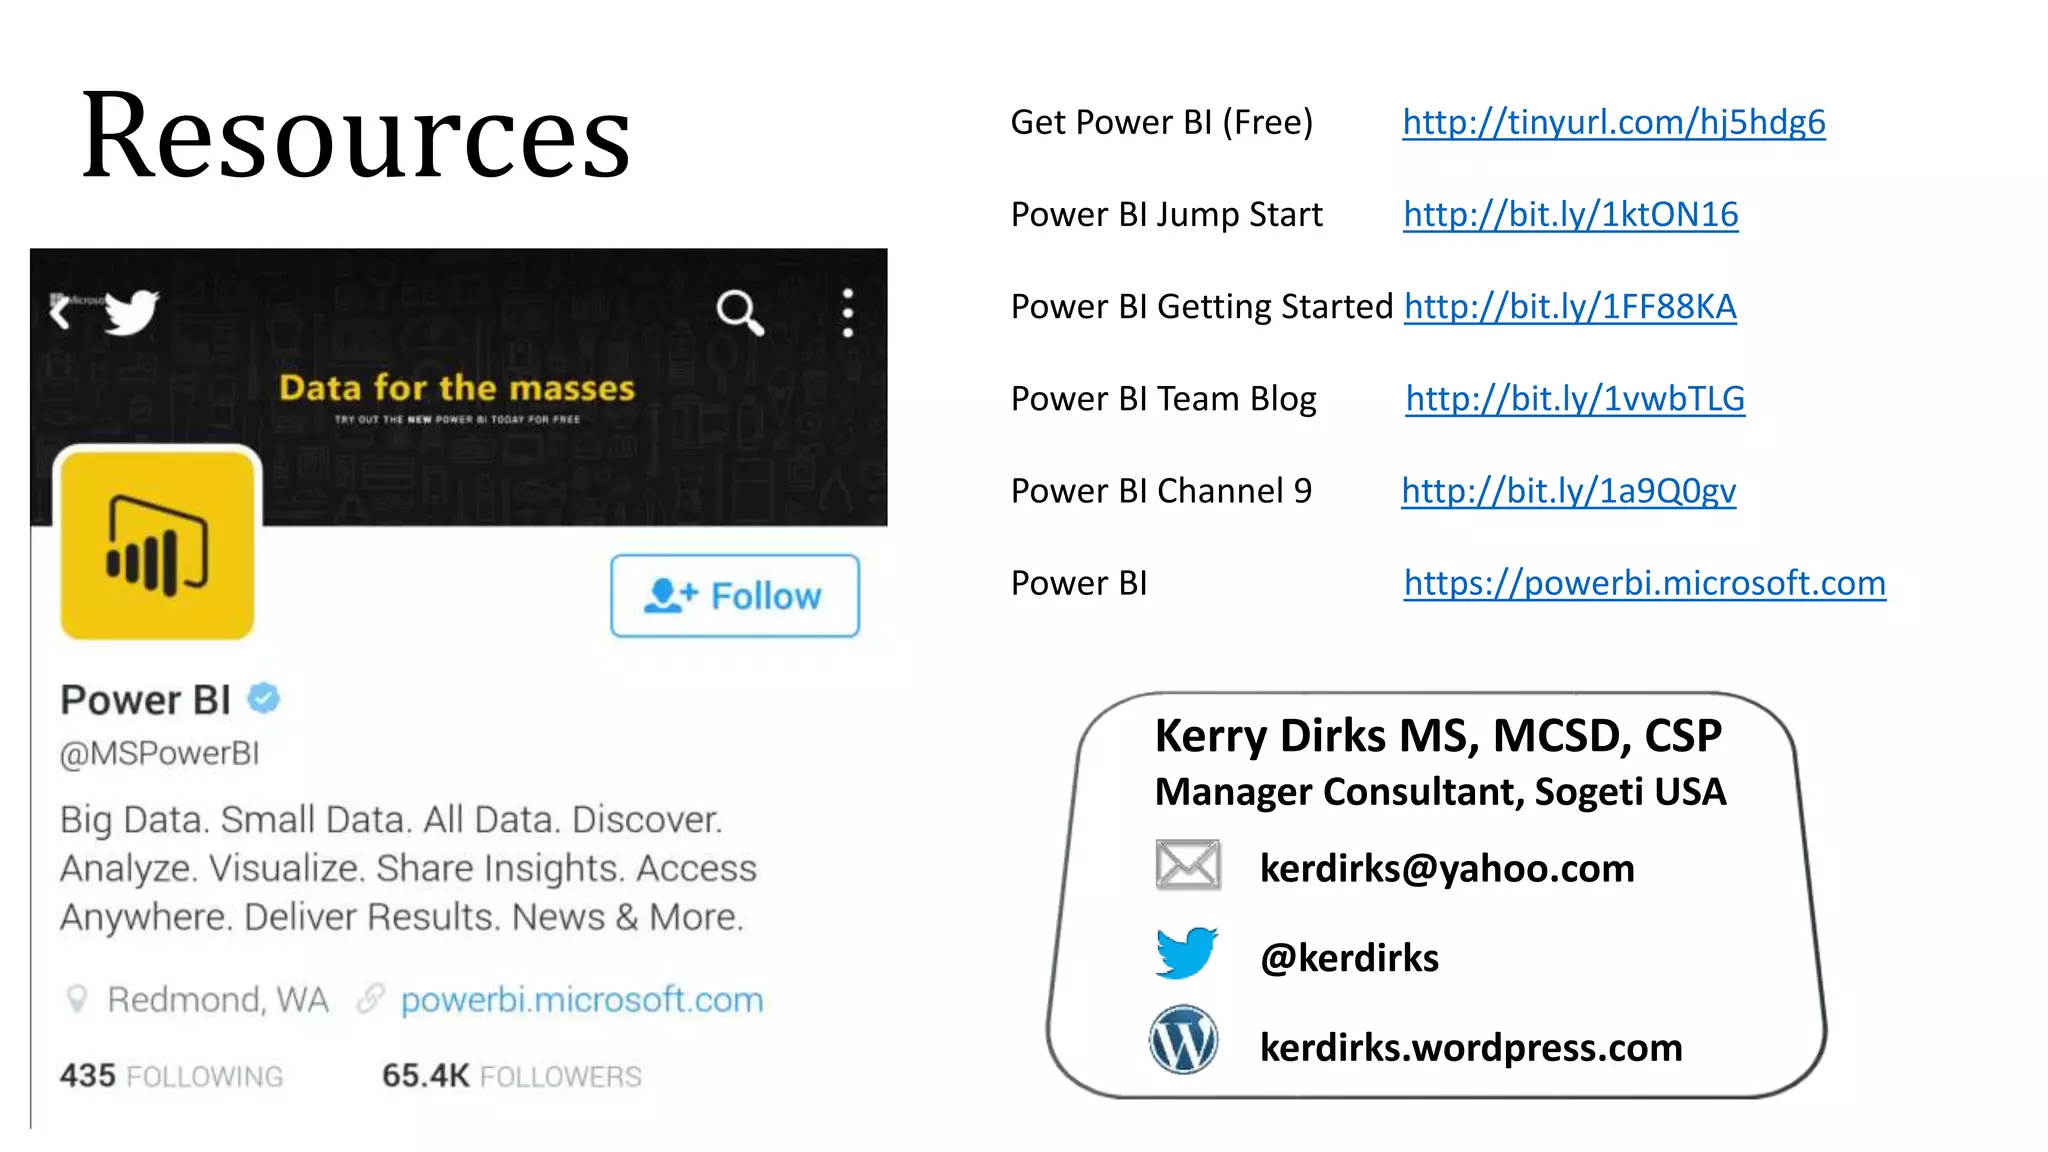


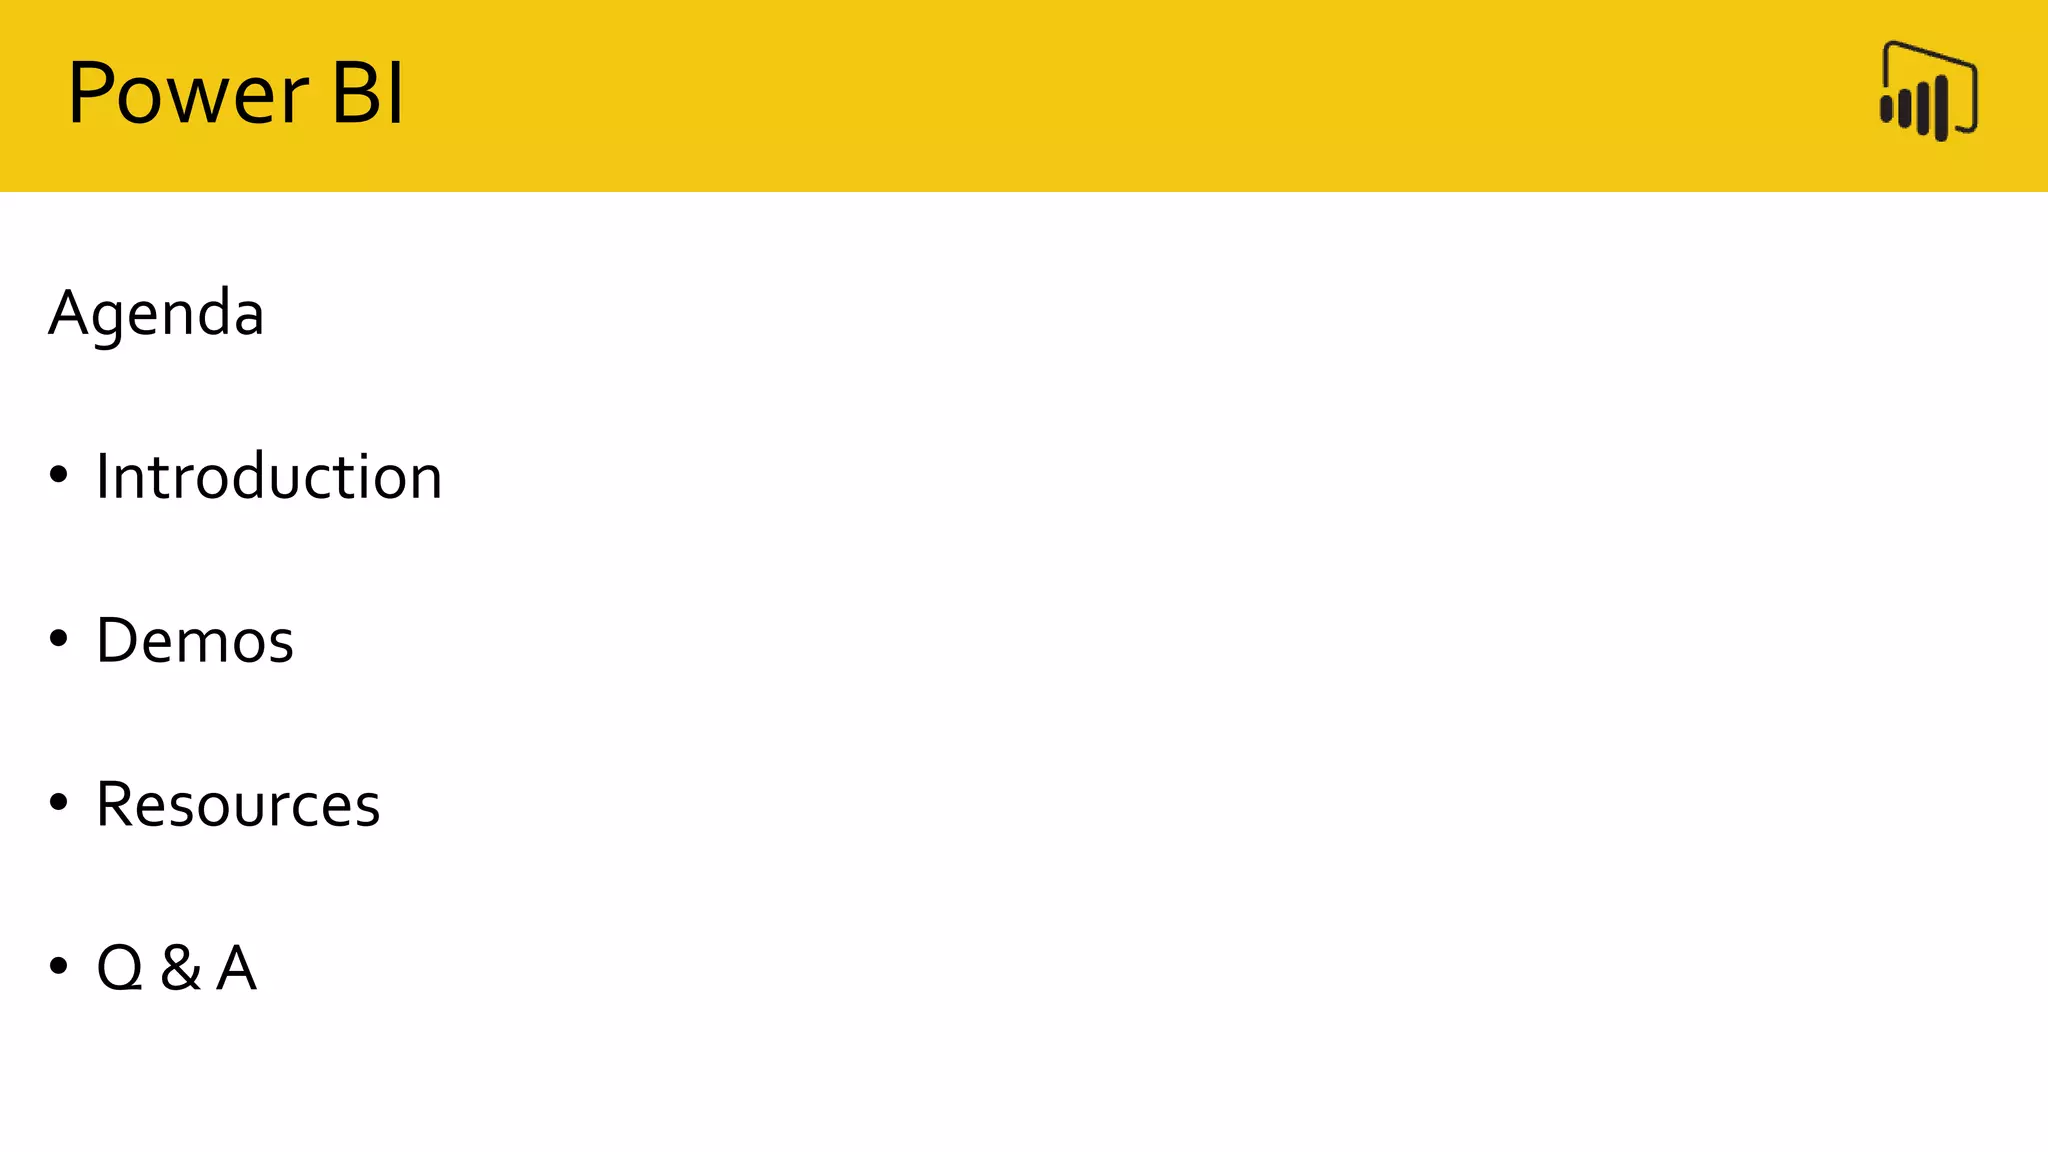
Power BI is a business analytics tool that allows users to visualize and analyze data from various sources. The presentation provided an introduction to Power BI capabilities, including connecting to data, building reports and dashboards, and publishing content. Attendees saw demonstrations of connecting Excel data, creating reports and dashboards, pinning visuals, and publishing a dashboard to SharePoint. Resources for learning more about Power BI were also shared.


