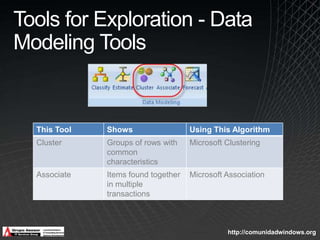
Data Mining in SQL Server 2008Ing Eduardo CastroGrupoAsesor en Informáticaecastro@grupoasesor.net
Eduardo Castroecastro@grupoasesor.netMCITP Server AdministratorMCTS Windows Server 2008 ActiveDirectoryMCTS Windows Server 2008 Network InfrastructureMCTS Windows Server 2008 Applications InfrastructureMCITP Enterprise SupportMCSTS Windows VistaMCITP Database DeveloperMCITP Database AdministratorMCTS SQL ServerMCITP Exchange Server 2007MCTS Office PerformancePoint ServerMCTS Team Foundation ServerMCPD Enterprise Application DeveloperMCTS .Net Framework 2.0: Distributed ApplicationsMCT 2008International Association of  Software Architects Chapter LeaderIEEE Communications Society Board of DirectorsEuropean Datawarehouse Research
DisclaimerThe information contained in this slide deck represents the current view of Microsoft Corporation on the issues discussed as of the date of publication.  Because Microsoft must respond to changing market conditions, it should not be interpreted to be a commitment on the part of Microsoft, and Microsoft cannot guarantee the accuracy of any information presented after the date of publication.This slide deck is for informational purposes only.  MICROSOFT MAKES NO WARRANTIES, EXPRESS, IMPLIED OR STATUTORY, AS TO THE INFORMATION IN THIS DOCUMENT.Complying with all applicable copyright laws is the responsibility of the user.  Without limiting the rights under copyright, no part of this slide deck may be reproduced, stored in or introduced into a retrieval system, or transmitted in any form or by any means (electronic, mechanical, photocopying, recording, or otherwise), or for any purpose, without the express written permission of Microsoft Corporation. Microsoft may have patents, patent applications, trademarks, copyrights, or other intellectual property rights covering subject matter in this slide deck.  Except as expressly provided in any written license agreement from Microsoft, the furnishing of this slide deck does not give you any license to these patents, trademarks, copyrights, or other intellectual property.Unless otherwise noted, the example companies, organizations, products, domain names, e-mail addresses, logos, people, places and events depicted herein are fictitious, and no association with any real company, organization, product, domain name, email address, logo, person, place or event is intended or should be inferred.  © 2008 Microsoft Corporation.  All rights reserved.Microsoft, SQL Server, Office System, Visual Studio, SharePoint Server, Office PerformancePoint Server, .NET Framework, ProClarity Desktop Professionalare either registered trademarks or trademarks of Microsoft Corporation in the United States and/or other countries.The names of actual companies and products mentioned herein may be the trademarks of their respective owners.3
OverviewIntroducing Data Mining Office Add-InsUnderstanding Data Mining Structure ImprovementsUsing the New Time Series Algorithm4
Introducing Data Mining Office Add-InsData Preparation TasksTools for ExplorationTools for PredictionModel Testing and Validation
Data Preparation Tasks
Tools for Exploration - Table Analysis Tools7
Tools for Exploration - Data Modeling Tools
Tools for Exploration – Model Viewers Cluster DiagramDistribution of population
Strength of similarities between clustersOther viewers: Decision tree
 Neural  network
 Association   rules
 Time seriesCluster ProfilesDistribution of values for each attribute
Drill through to detailsCluster CharacteristicsAttributes ordered by importance to cluster
Probability attribute appearing in clusterCluster DiscriminationComparison of attributes between two clustersTools for Prediction - Table Analysis Tools
Tools for Prediction - Data Modeling Tools
Model Testing and ValidationAccuracy ChartMeasurement of model accuracy
Lift chart comparing actual results to random guess and to perfect predictionClassification MatrixShows correct and incorrect predictions
Displays percentage and countsProfit ChartEstimation of profit by percentage of population contacted
Input: population, fixed cost, individual cost, revenue per individual
Output: maximum profit, probability thresholdCross Validation – more on this later
1 Using the Data Mining Excel Add-Indemo
Understanding Data Mining Structure ImprovementsData Partitioning for Training and TestingMining Model Column AliasesData Mining FiltersDrill Through to Mining Structure DataCross-Validation of a Mining Model
Data Partitioning for Training and TestingSpecify as percentage or maximum number of casesSmaller value is used if both parameters specifiedData is divided randomly between training and testingHoldoutSeed property enables consistent partitions across structures
Data Partitioning with DMXCreate a structure with partitioning with the HOLDOUT keywordQuery the structure to review partitions
Mining Model Column AliasesAssign a column alias to reuse a column in a structureColumn content can be clarifiedColumn can be more easily referenced in DMXContinuous and discretized versions of the same column can be used in separate models in the same structure
Data Mining FiltersSpecify a condition to apply to mining structure columns Filter creates subsets of training and testing data for a modelMultiple conditions can be linked with AND/OR operatorsConditions for continuous value use > , >=,  <, <= operatorsConditions for discrete values use =, !=, or is null operatorsConditions on nested tables can use EXISTS keyword and subquery
Data Mining Filters with DMXAdd a filtered mining model to a structure
Drill Through to Mining Structure  DataAdd columns to the mining structure, but not to modelsEliminates unnecessary data from model and improves processing timeSupports drill through from mining model viewer or DMX for visibility into results
Cross-Validation of a Mining ModelPurposeValidate the accuracy of a single modelCompare models within the same mining structureProcessSplit mining structure into partitions of equal sizeIteratively build models on all partitions excluding one partition such that all partitions are excluded onceMeasure accuracy of each model using the excluded partitionAnalyze results
Cross-Validation ParametersFold CountNumber of partitions to useMinimum 2, Maximum 256Maximum 10 for session mining structureMax CasesTotal number of cases to include in cross-validationCases divided across foldsValue of 0 specifies all casesTarget AttributePredictable column Target StateTarget value for target attributeValue of null specifies all states are to be testedTarget ThresholdValue between 0 and 1 for prediction probability above which a predicted state is considered correctValue of null specifies most probable prediction is considered correct

Minería de Datos en Sql Server 2008

  • 1.
    Data Mining inSQL Server 2008Ing Eduardo CastroGrupoAsesor en Informáticaecastro@grupoasesor.net
  • 2.
    Eduardo Castroecastro@grupoasesor.netMCITP ServerAdministratorMCTS Windows Server 2008 ActiveDirectoryMCTS Windows Server 2008 Network InfrastructureMCTS Windows Server 2008 Applications InfrastructureMCITP Enterprise SupportMCSTS Windows VistaMCITP Database DeveloperMCITP Database AdministratorMCTS SQL ServerMCITP Exchange Server 2007MCTS Office PerformancePoint ServerMCTS Team Foundation ServerMCPD Enterprise Application DeveloperMCTS .Net Framework 2.0: Distributed ApplicationsMCT 2008International Association of Software Architects Chapter LeaderIEEE Communications Society Board of DirectorsEuropean Datawarehouse Research
  • 3.
    DisclaimerThe information containedin this slide deck represents the current view of Microsoft Corporation on the issues discussed as of the date of publication. Because Microsoft must respond to changing market conditions, it should not be interpreted to be a commitment on the part of Microsoft, and Microsoft cannot guarantee the accuracy of any information presented after the date of publication.This slide deck is for informational purposes only. MICROSOFT MAKES NO WARRANTIES, EXPRESS, IMPLIED OR STATUTORY, AS TO THE INFORMATION IN THIS DOCUMENT.Complying with all applicable copyright laws is the responsibility of the user. Without limiting the rights under copyright, no part of this slide deck may be reproduced, stored in or introduced into a retrieval system, or transmitted in any form or by any means (electronic, mechanical, photocopying, recording, or otherwise), or for any purpose, without the express written permission of Microsoft Corporation. Microsoft may have patents, patent applications, trademarks, copyrights, or other intellectual property rights covering subject matter in this slide deck. Except as expressly provided in any written license agreement from Microsoft, the furnishing of this slide deck does not give you any license to these patents, trademarks, copyrights, or other intellectual property.Unless otherwise noted, the example companies, organizations, products, domain names, e-mail addresses, logos, people, places and events depicted herein are fictitious, and no association with any real company, organization, product, domain name, email address, logo, person, place or event is intended or should be inferred. © 2008 Microsoft Corporation. All rights reserved.Microsoft, SQL Server, Office System, Visual Studio, SharePoint Server, Office PerformancePoint Server, .NET Framework, ProClarity Desktop Professionalare either registered trademarks or trademarks of Microsoft Corporation in the United States and/or other countries.The names of actual companies and products mentioned herein may be the trademarks of their respective owners.3
  • 4.
    OverviewIntroducing Data MiningOffice Add-InsUnderstanding Data Mining Structure ImprovementsUsing the New Time Series Algorithm4
  • 5.
    Introducing Data MiningOffice Add-InsData Preparation TasksTools for ExplorationTools for PredictionModel Testing and Validation
  • 6.
  • 7.
    Tools for Exploration- Table Analysis Tools7
  • 8.
    Tools for Exploration- Data Modeling Tools
  • 9.
    Tools for Exploration– Model Viewers Cluster DiagramDistribution of population
  • 10.
    Strength of similaritiesbetween clustersOther viewers: Decision tree
  • 11.
    Neural network
  • 12.
  • 13.
    Time seriesClusterProfilesDistribution of values for each attribute
  • 14.
    Drill through todetailsCluster CharacteristicsAttributes ordered by importance to cluster
  • 15.
    Probability attribute appearingin clusterCluster DiscriminationComparison of attributes between two clustersTools for Prediction - Table Analysis Tools
  • 16.
    Tools for Prediction- Data Modeling Tools
  • 17.
    Model Testing andValidationAccuracy ChartMeasurement of model accuracy
  • 18.
    Lift chart comparingactual results to random guess and to perfect predictionClassification MatrixShows correct and incorrect predictions
  • 19.
    Displays percentage andcountsProfit ChartEstimation of profit by percentage of population contacted
  • 20.
    Input: population, fixedcost, individual cost, revenue per individual
  • 21.
    Output: maximum profit,probability thresholdCross Validation – more on this later
  • 22.
    1 Using theData Mining Excel Add-Indemo
  • 23.
    Understanding Data MiningStructure ImprovementsData Partitioning for Training and TestingMining Model Column AliasesData Mining FiltersDrill Through to Mining Structure DataCross-Validation of a Mining Model
  • 24.
    Data Partitioning forTraining and TestingSpecify as percentage or maximum number of casesSmaller value is used if both parameters specifiedData is divided randomly between training and testingHoldoutSeed property enables consistent partitions across structures
  • 25.
    Data Partitioning withDMXCreate a structure with partitioning with the HOLDOUT keywordQuery the structure to review partitions
  • 26.
    Mining Model ColumnAliasesAssign a column alias to reuse a column in a structureColumn content can be clarifiedColumn can be more easily referenced in DMXContinuous and discretized versions of the same column can be used in separate models in the same structure
  • 27.
    Data Mining FiltersSpecifya condition to apply to mining structure columns Filter creates subsets of training and testing data for a modelMultiple conditions can be linked with AND/OR operatorsConditions for continuous value use > , >=, <, <= operatorsConditions for discrete values use =, !=, or is null operatorsConditions on nested tables can use EXISTS keyword and subquery
  • 28.
    Data Mining Filterswith DMXAdd a filtered mining model to a structure
  • 29.
    Drill Through toMining Structure DataAdd columns to the mining structure, but not to modelsEliminates unnecessary data from model and improves processing timeSupports drill through from mining model viewer or DMX for visibility into results
  • 30.
    Cross-Validation of aMining ModelPurposeValidate the accuracy of a single modelCompare models within the same mining structureProcessSplit mining structure into partitions of equal sizeIteratively build models on all partitions excluding one partition such that all partitions are excluded onceMeasure accuracy of each model using the excluded partitionAnalyze results
  • 31.
    Cross-Validation ParametersFold CountNumberof partitions to useMinimum 2, Maximum 256Maximum 10 for session mining structureMax CasesTotal number of cases to include in cross-validationCases divided across foldsValue of 0 specifies all casesTarget AttributePredictable column Target StateTarget value for target attributeValue of null specifies all states are to be testedTarget ThresholdValue between 0 and 1 for prediction probability above which a predicted state is considered correctValue of null specifies most probable prediction is considered correct

Editor's Notes

  • #5 Data Mining Office Add-ins were introduced with SQL Server 2005, and a new version is available for SQL Server 2008 to take advantage of the improvements made to Analysis Services data mining. In this module, we’ll review how to use the Data Mining Add-ins, and then examine the changes made to mining structures as well as the new Time Series alogrithm.
  • #6 Data Mining Add-ins for Office allow you to perform a variety of data mining tasks. You can prepare data by applying data cleansing, and you can partition the data into training and test sets. Some of the add-in tools are focused on exploring your data, while other tools are built specifically for prediction purposes. The add-ins also includes functionality for testing and validating each model.Point out that the add-ins are also useful as a client viewer for data mining models developed on the server.
  • #7 This slide shows the data preparation tasks : Explore Data (to find anomalies), clean data (to handle outliers or erroenous data, and partition data to separate it into training and test data.In the background is a view used to consolidate information from several tables. Transformations have been applied to enforce business rules. This logical table is then used as the source for data mining activities –whether using the add-ins or using BI Development Studio.
  • #8 This slide identifies the table analysis tools that are exploration-based data mining tools and identifies the data mining algorithm associated with the tool.
  • #9 This slide identifies the data modeling tools that are exploration-based data mining tools and identifies the data mining algorithm associated with the tool.
  • #10 Model viewers are available not only for mining data models created by using the add-in, but also for mining models created on the server.
  • #11 This slide shows the predictive tools and shows the related algorithm.
  • #12 Prediction tools are also available in the Data Modeling ribbon of Excel. Here you see the algorithm associated with these predictive tools.
  • #13 The Data Mining add-in also includes model testing and validation tools, such as an Accuracy cart, a classification matrix, and a profit chart. Cross Validation is also new to Analysis Services data mining and will be discussed in more detail later in this module.
  • #15 In this section, we’ll review the improvements for mining structures in SSAS 2008. Specifically, we’ll look at setting up data partitions for training and testing dta, how to us aliases with mining model columns, how to apply filers to data associated with a mining model, how to drillthrough to details when studying data mining results, and how to use the cross-validation report to assess the accuracy of a model or to compare multiple models to find the best model.
  • #16 To create training and testing sets using random data for SSAS 2005, best practice was to use the Random Sample transformation in SSIS 2005. However, the package design was particularly cumbersome for structures with nested tables. In SSAS 2008, the process to generate random data sets for training and testing is built in.You can specify parameters for partitioning data into training and testing sets: In the Data Mining Wizard In the Properties pane of the mining structureAnalysis services uses a random sampling algorithm to assign data to either the training or the testing data set.If you provide both a percentage and maximum number of rows, the smaller number prevails. For example, you can specify a percentage of 30% of the entire data set which is not to exceed 1,000 rows if the data source continues to grow. When using the same data source view for multiple mining structures, you might want to keep the same partitioning strategy for each mining structure. Set the HoldoutSeed property to the same value in each structure to yield comparable results in the training and testing data sets.You can also define partitioning using DMX, AMO, or XML DDL.Point out that partitioning is not available for a model using the Time Series algorithm.
  • #17 For those who prefer to use DMX to create mining structures instead of the user interface, DMX now supports partitioning when the mining structure is created. Point out that HOLDOUT cannot be used with ALTER MINING STRUCTURE.The process to train the model – using INSERT INTO MINING STRUCTURE – is unchanged. The query executes and data is random sampled. A holdout store is created for each partition of the mining structure. In SSAS 2008, you can now query the structure to view the contents of the training and testing data sets.
  • #18 In SSAS 2005, you could change the name of a mining model column in Business Intelligence Development Studio, but not in DMX. One reason you might want to use alias a column is when you want to use the same column with different algorithms, but one algorithm supports continuous columns and the other does not. You can add a column to the mining structure more than once and set the Content property to a different value for each version of the column. Ignore the column in the model where the content type is unsupported, and include it as an input column in models supporting that content type. By enabling the use of an alias, you can use the same NATURAL PREDICTION JOIN for the models in the same mining structure because input columns are bound by name to the model column.
  • #19 Instead of creating separate data source views for your mining structure, you can create separate filtered models. Each model contains the same training and testing data which allows you to compare model results. Why create filtered models?Achieve better overall accuracy by eliminating strong patterns of one attribute value (e.g. North America versus Pacific).Compare patterns in isolated subsets of data.You can create filers: In the Model Filter dialog box In the Properties pane of the mining modelIn the case of discretized values, the bucket containing the specified value is selected. Example: Age = 23 returns bucket containing 20-25 ages.An example of a filter expression for a case table and a nested table:Gender = ‘M’ and EXISTS(select * from Products where Model = ‘Water Bottle’)Point out that NOT EXISTS is also valid.Mention the URL on the Resources slide for more information about filter syntax.You must process the mining structure to see the filter applied to the model.
  • #20 Mention that using drillthrough in a filtered model returns all cases matching the filter, whether used for training or testing.
  • #21 As in SSAS 2005, the following algorithms do not support drill through: NaïveBayes Neural Network Logistic RegressionThe Time Series algorithm supports drill through in a DMX query only; drill through is not supported in Business Intelligence Development Studio.
  • #22 Using parameters you specify, cross-validation automatically creates partitions of the data set of approximately equal size. For each partition, a mining model is created for the entire data set with one of the partitions removed, and then tested for accuracy using the partition that was excluded. If the variations are subtle, then the model generalizes well. If there is too much variation, then the model is not useful.Point out that cross-validation cannot be used with models built using the Time Series or Sequence Clustering algorithms.You can use the Cross Validation Report in the Mining Accuracy Chart of Business Intelligence Development Studio, or use Analysis Services stored procedures to create an ad hoc cross-validation SQL Server Management Studio.
  • #23 More folds results in longer processing time.
  • #24 This slide and the next outlines the types of tests and their respective measures that are found on the cross-validation report. Different models will use different test types for this report. Point out the report can be generated in Business Intelligence Development Studio, which will be shown in the demonstration, or by calling an Analysis Services stored procedure.
  • #27 Data mining in SSAS 2008 was also improved by modifying the Time Series algorithm. In this section, we’ll review why the mining structure is improved and we’ll review the algorithm parameters for the Time Series algorithm.
  • #28 In SSAS 2005, the ARTxp Time Series prediction algorithm (autoregressive tree model for multiple prior unknown states), built by Microsoft Research, was introduced. The purpose of this algorithm was to tackle a difficult business problem – how to accuractly predict the next step in a series. It was less reliable for predicting 10 steps or further out.ARIMA (autoregressive integrated moving average) is a very common time series algorithm that is well understood by seasoned data miners. It provides good predictions when projecting beyond the next 10 steps. In SSAS 2008, the Microsoft Time Series algorithm blends results of the two algorithms to leverage short and long term capabilities.In Standard Edition, you can configure your model to use one or the other algorithm, or both (which is the default). In Enterprise Edition, you can do custom weighting to get best prediction over a variable time span.
  • #29 The FORECAST_METHOD default value is MIXED. You can change this to use ARIMA or ARTXP to use a single algorithm exclusively.The PREDICTION_SMOOTHING parameter affects the weighting of the ARTxpand ARIMAalgorithms when MIXED mode is used. A value closer to 0 weights in favor of ARTxp while a value closer to 1 weights in favor of ARIMA. For example, a value of 0.8 is weighted towards ARIMA and the value of 0.2 is used for ARTxp.