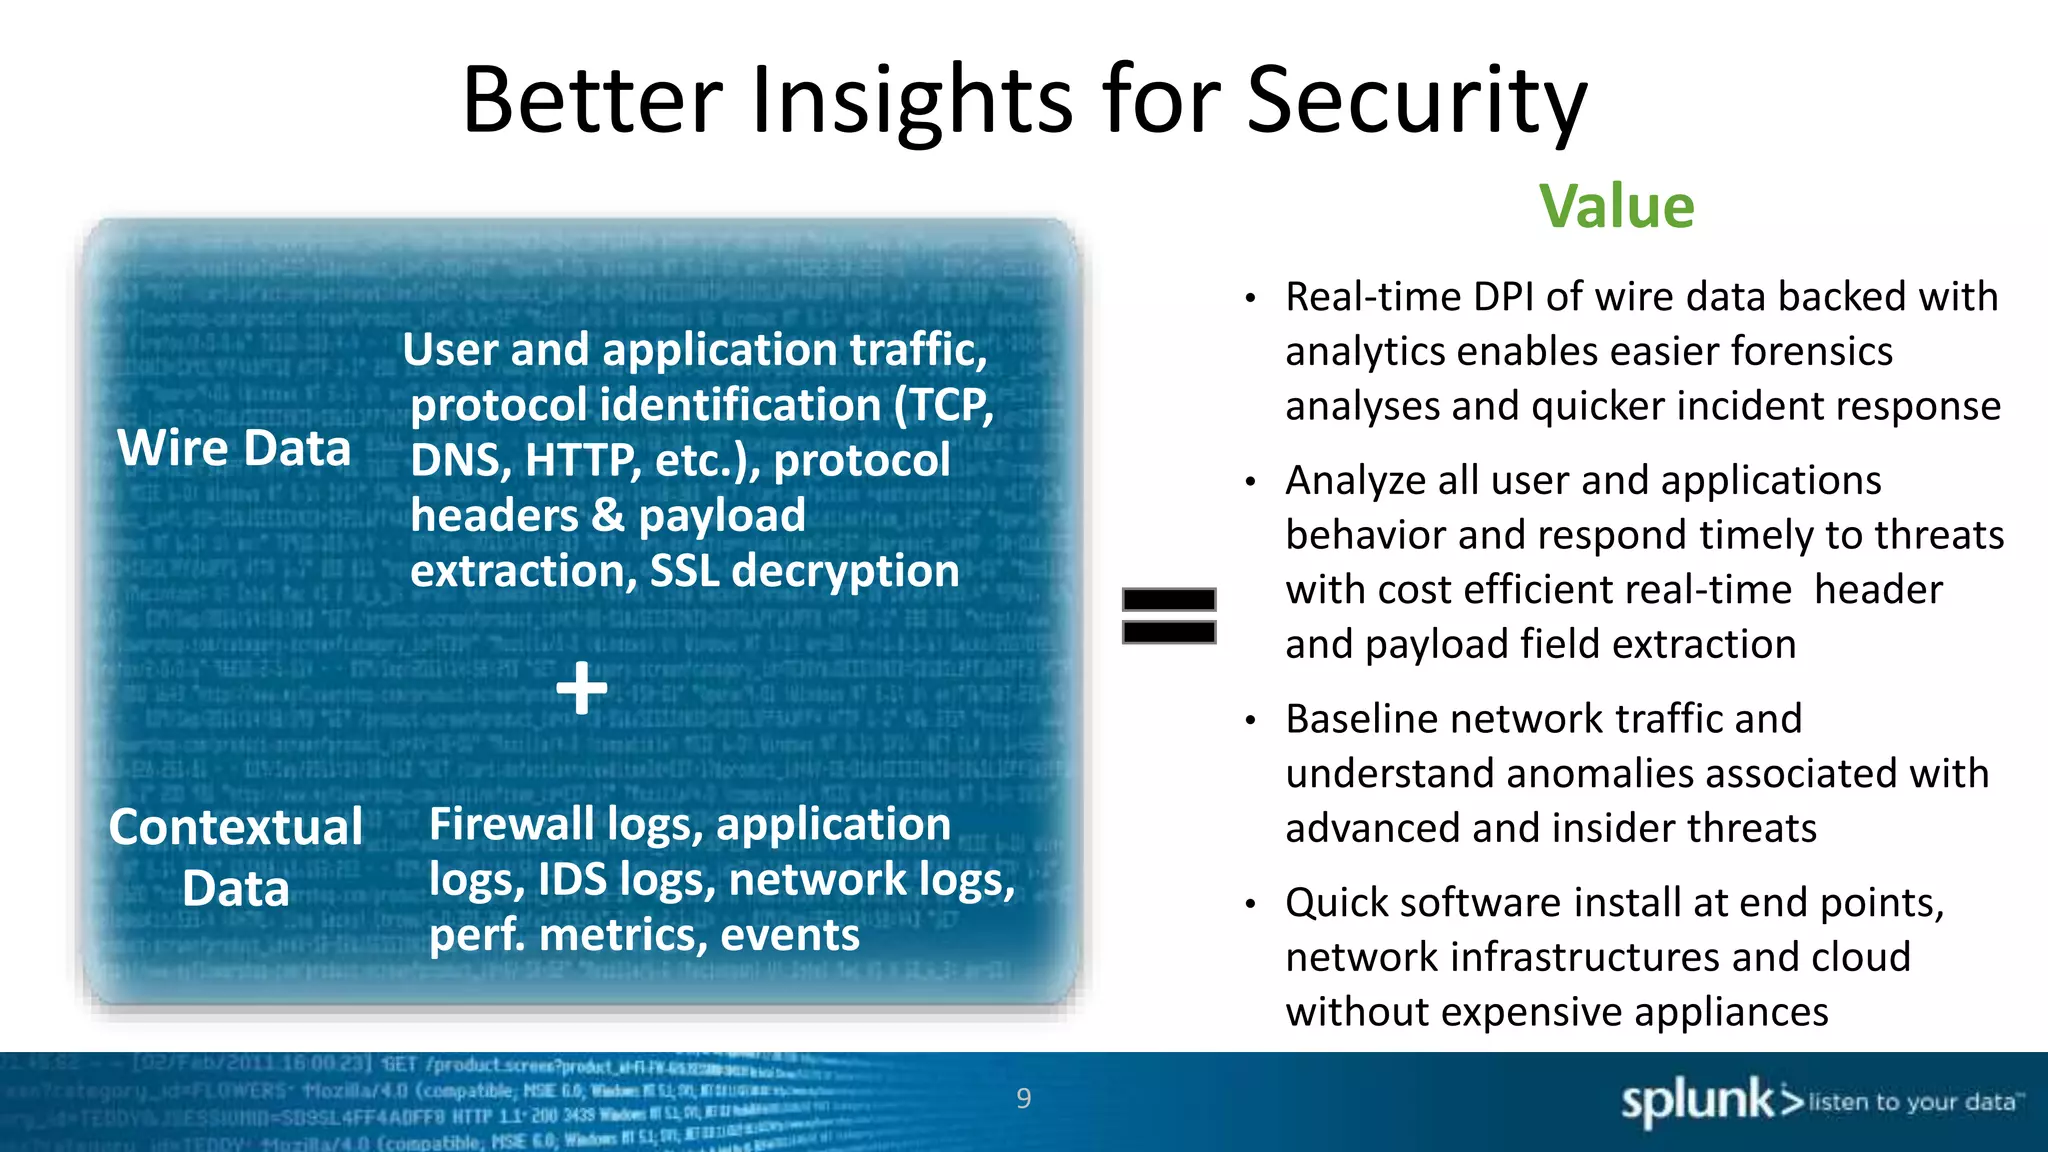
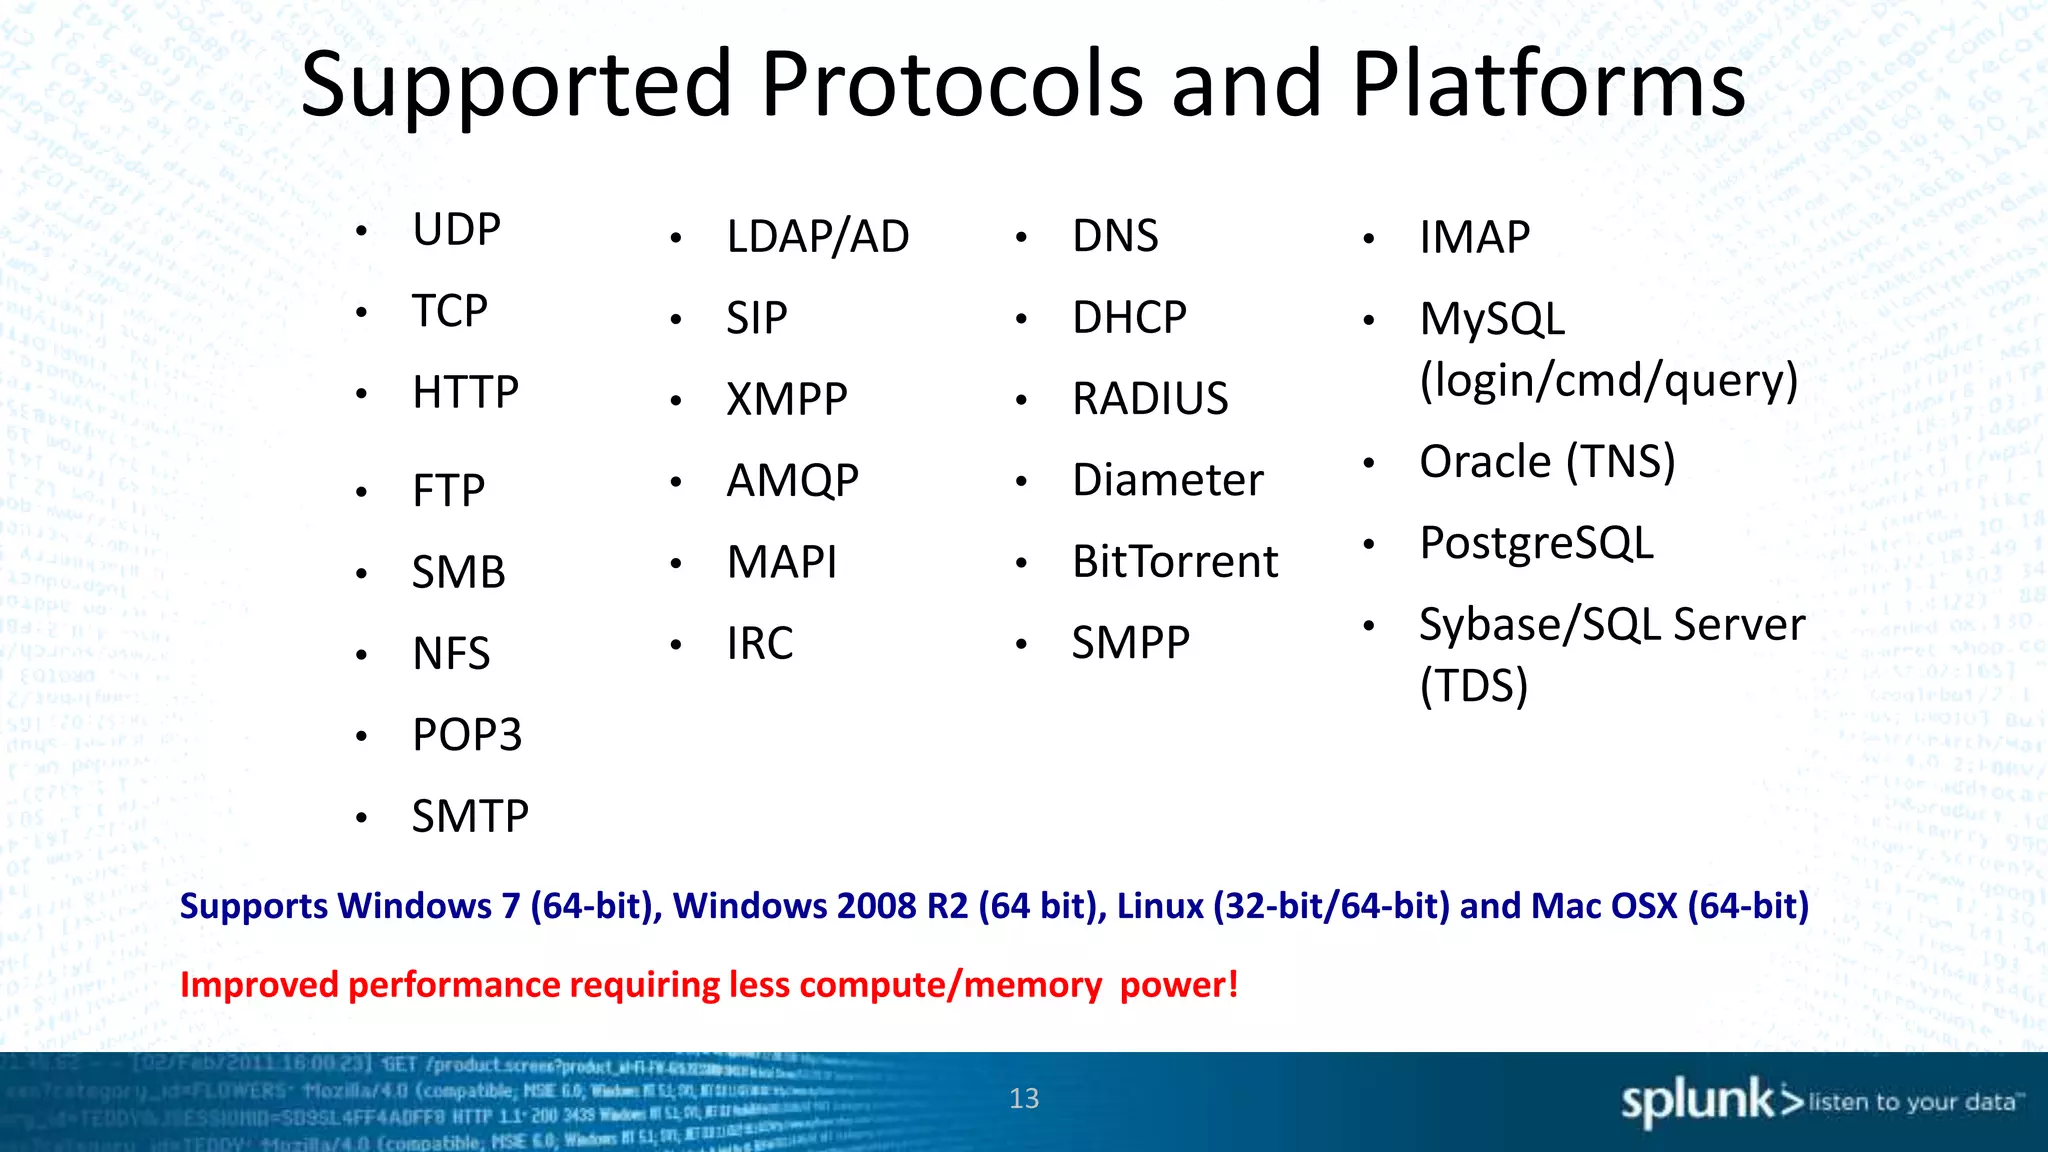
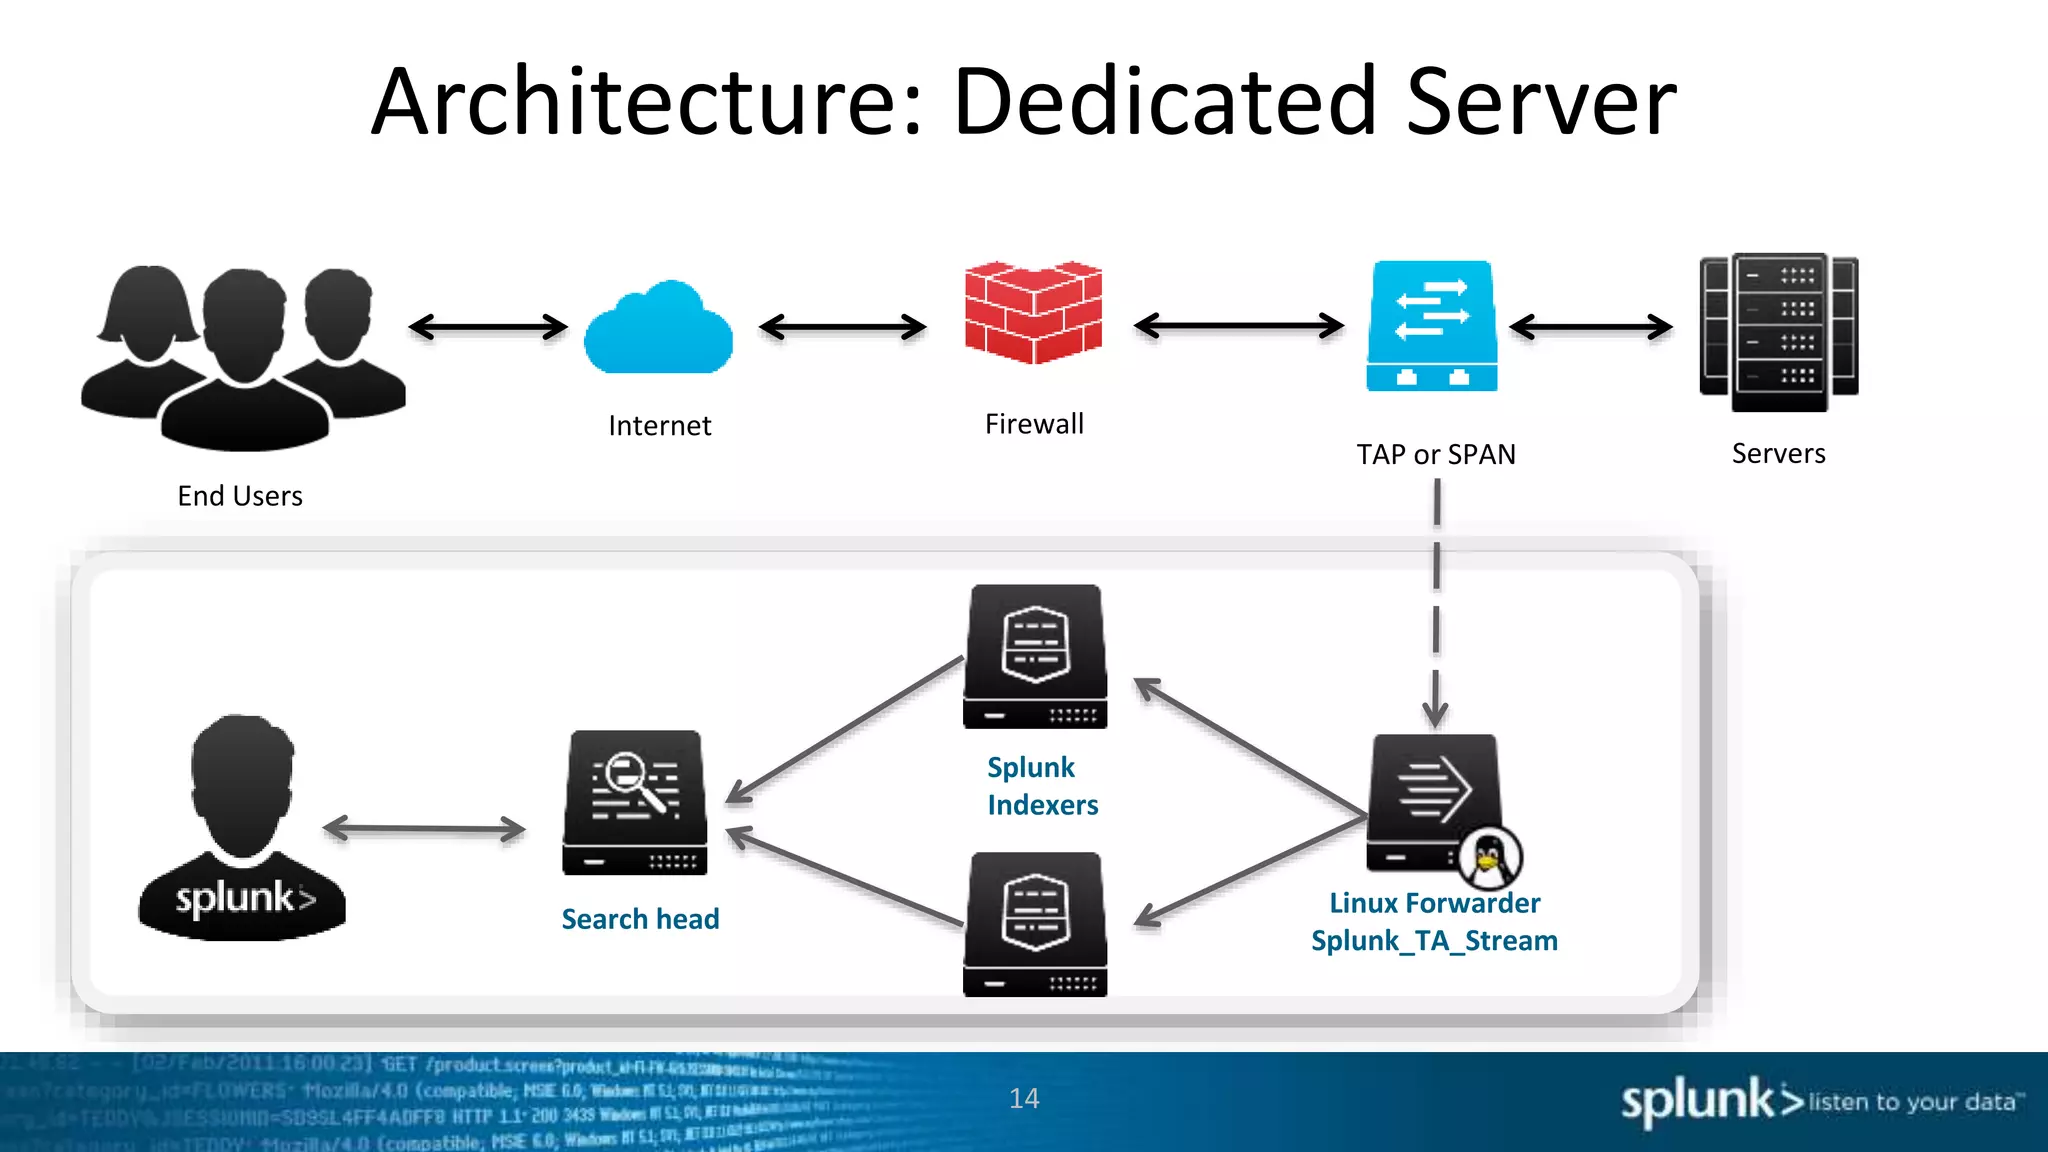
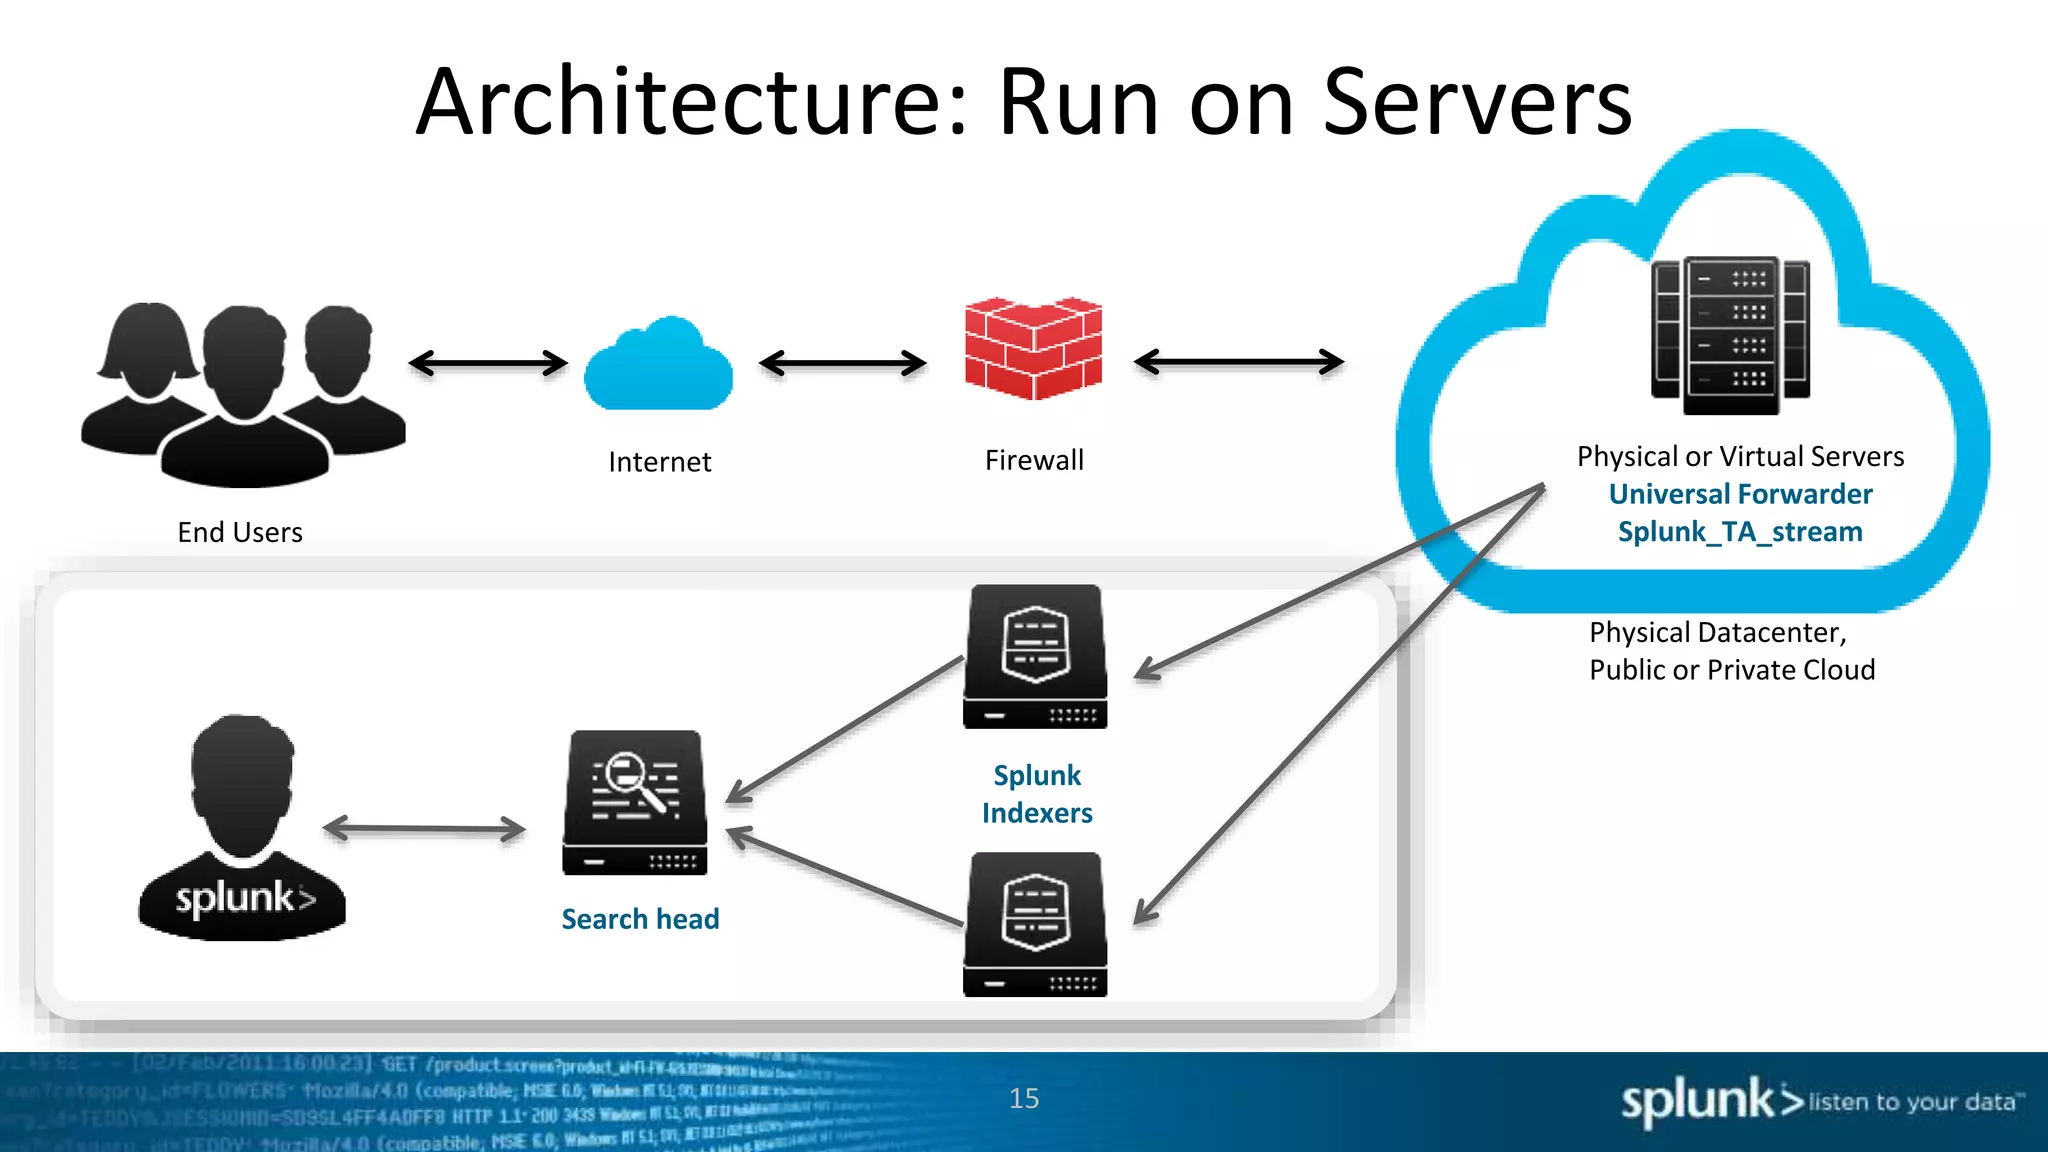
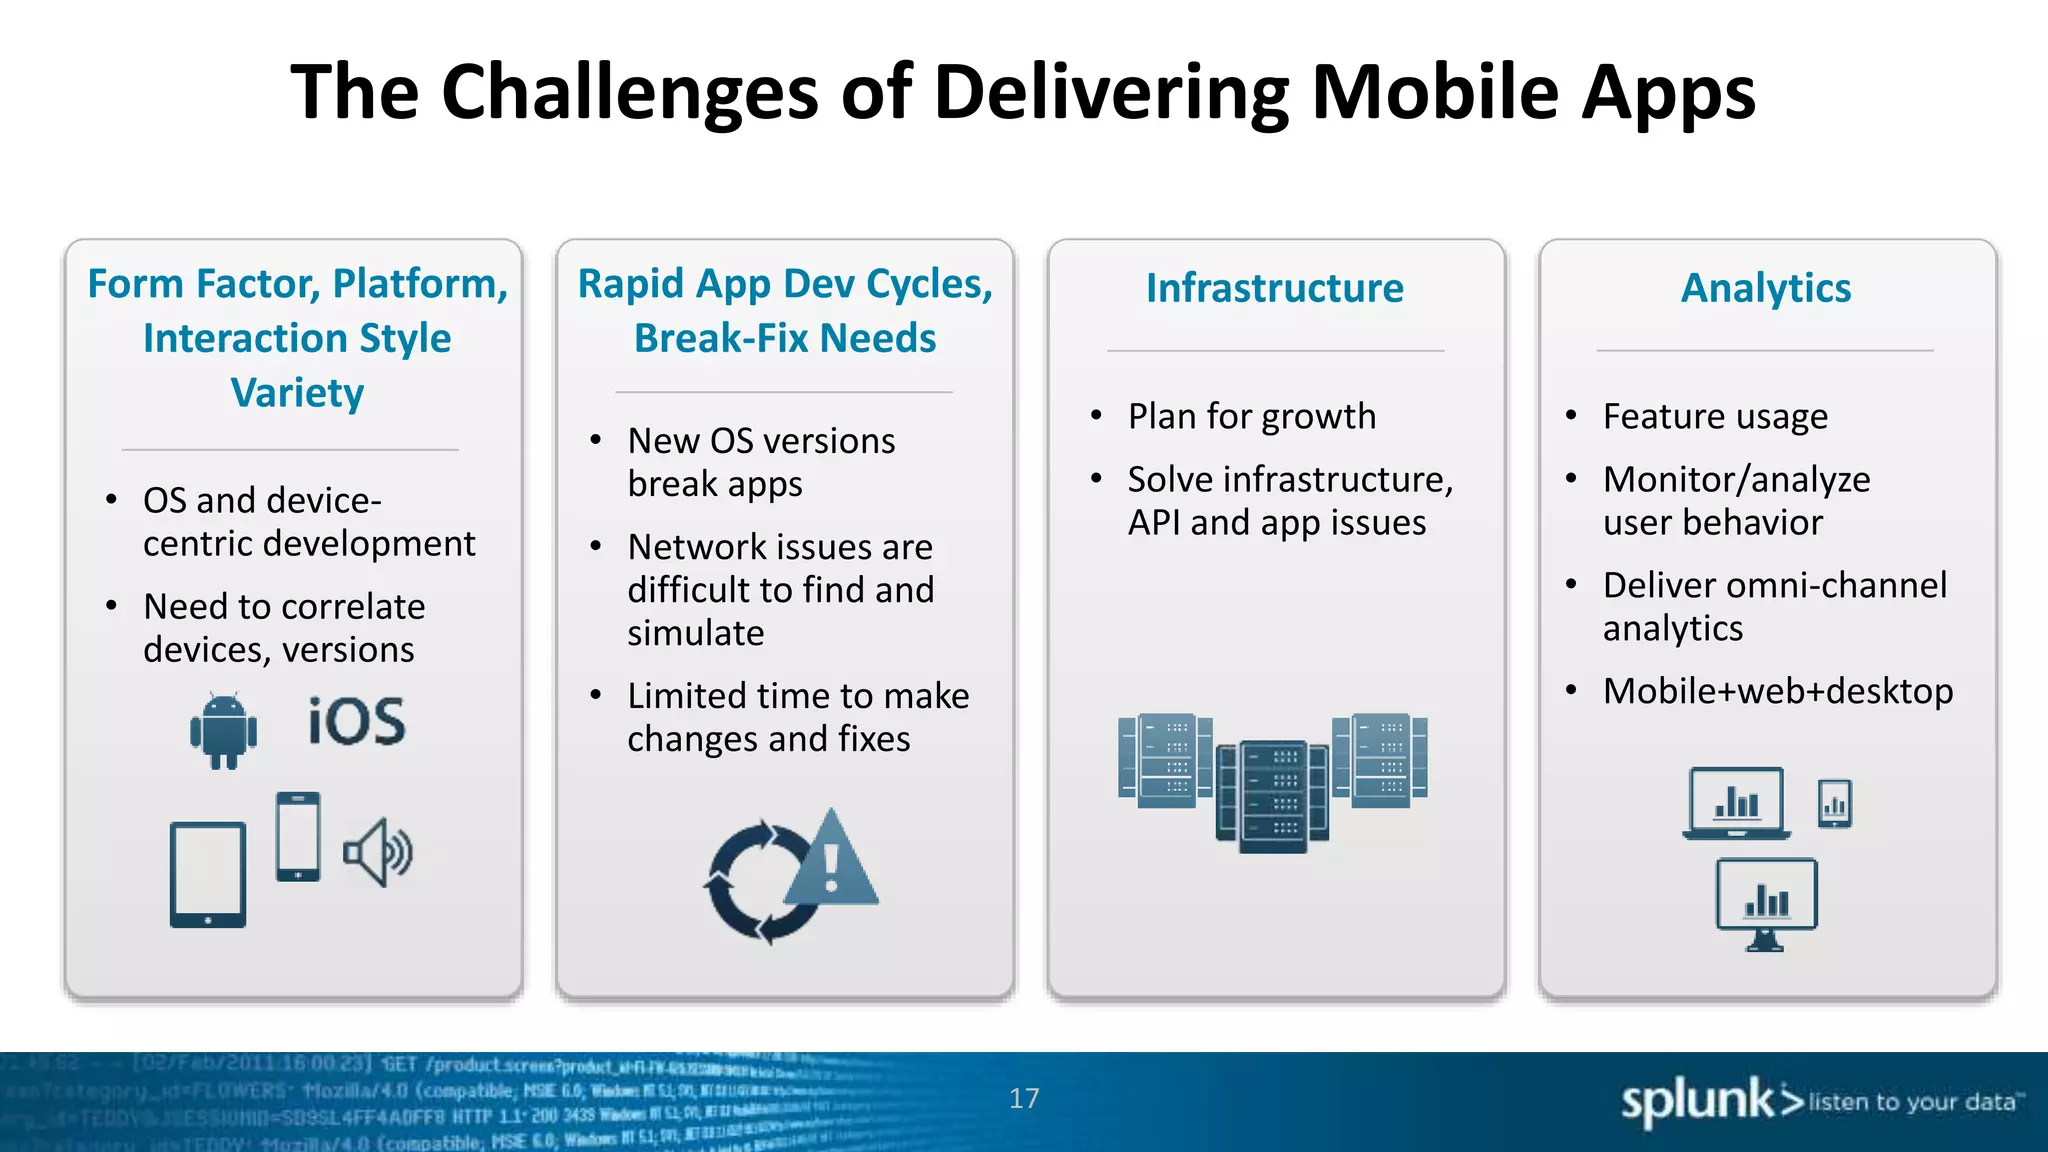
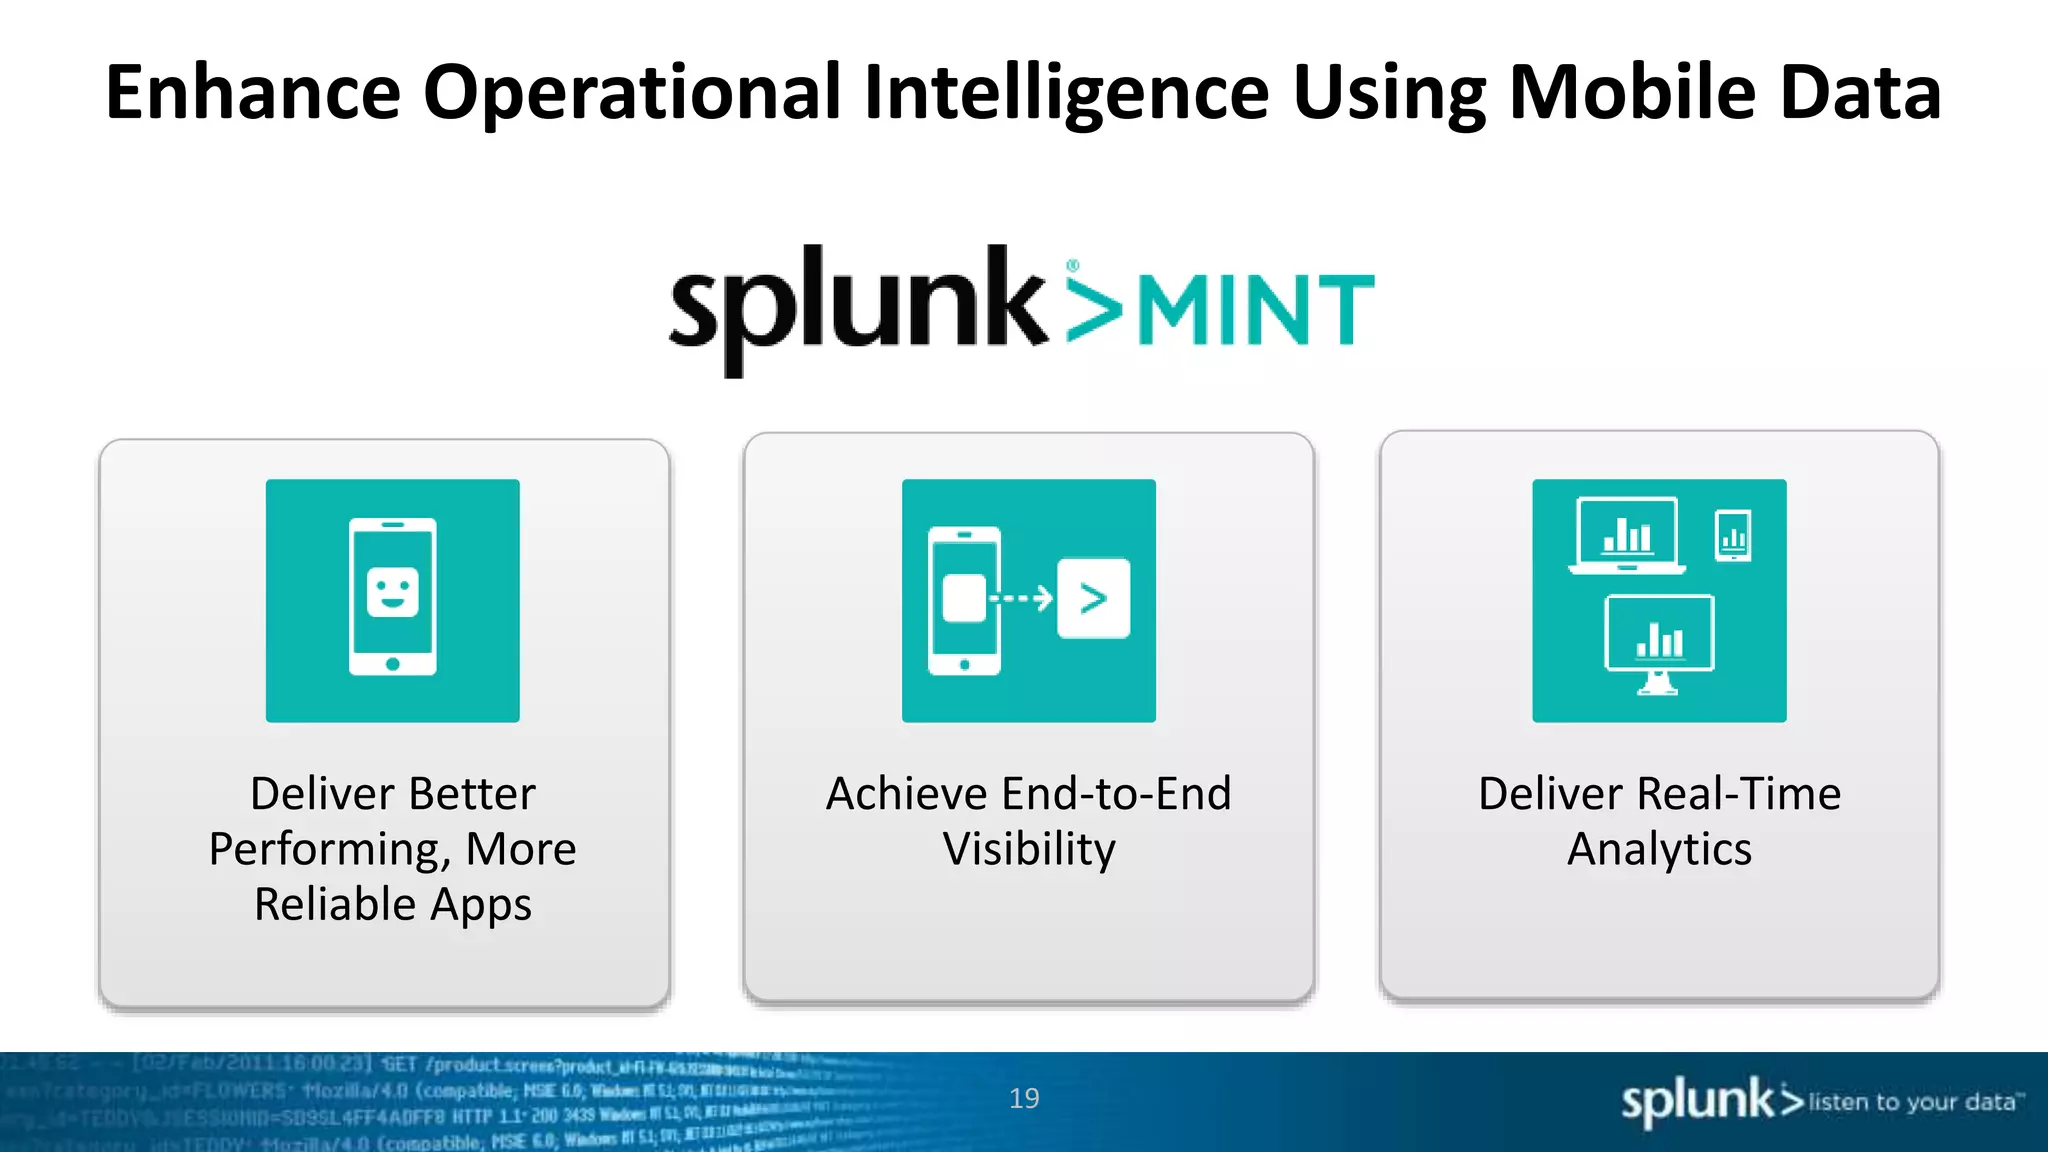
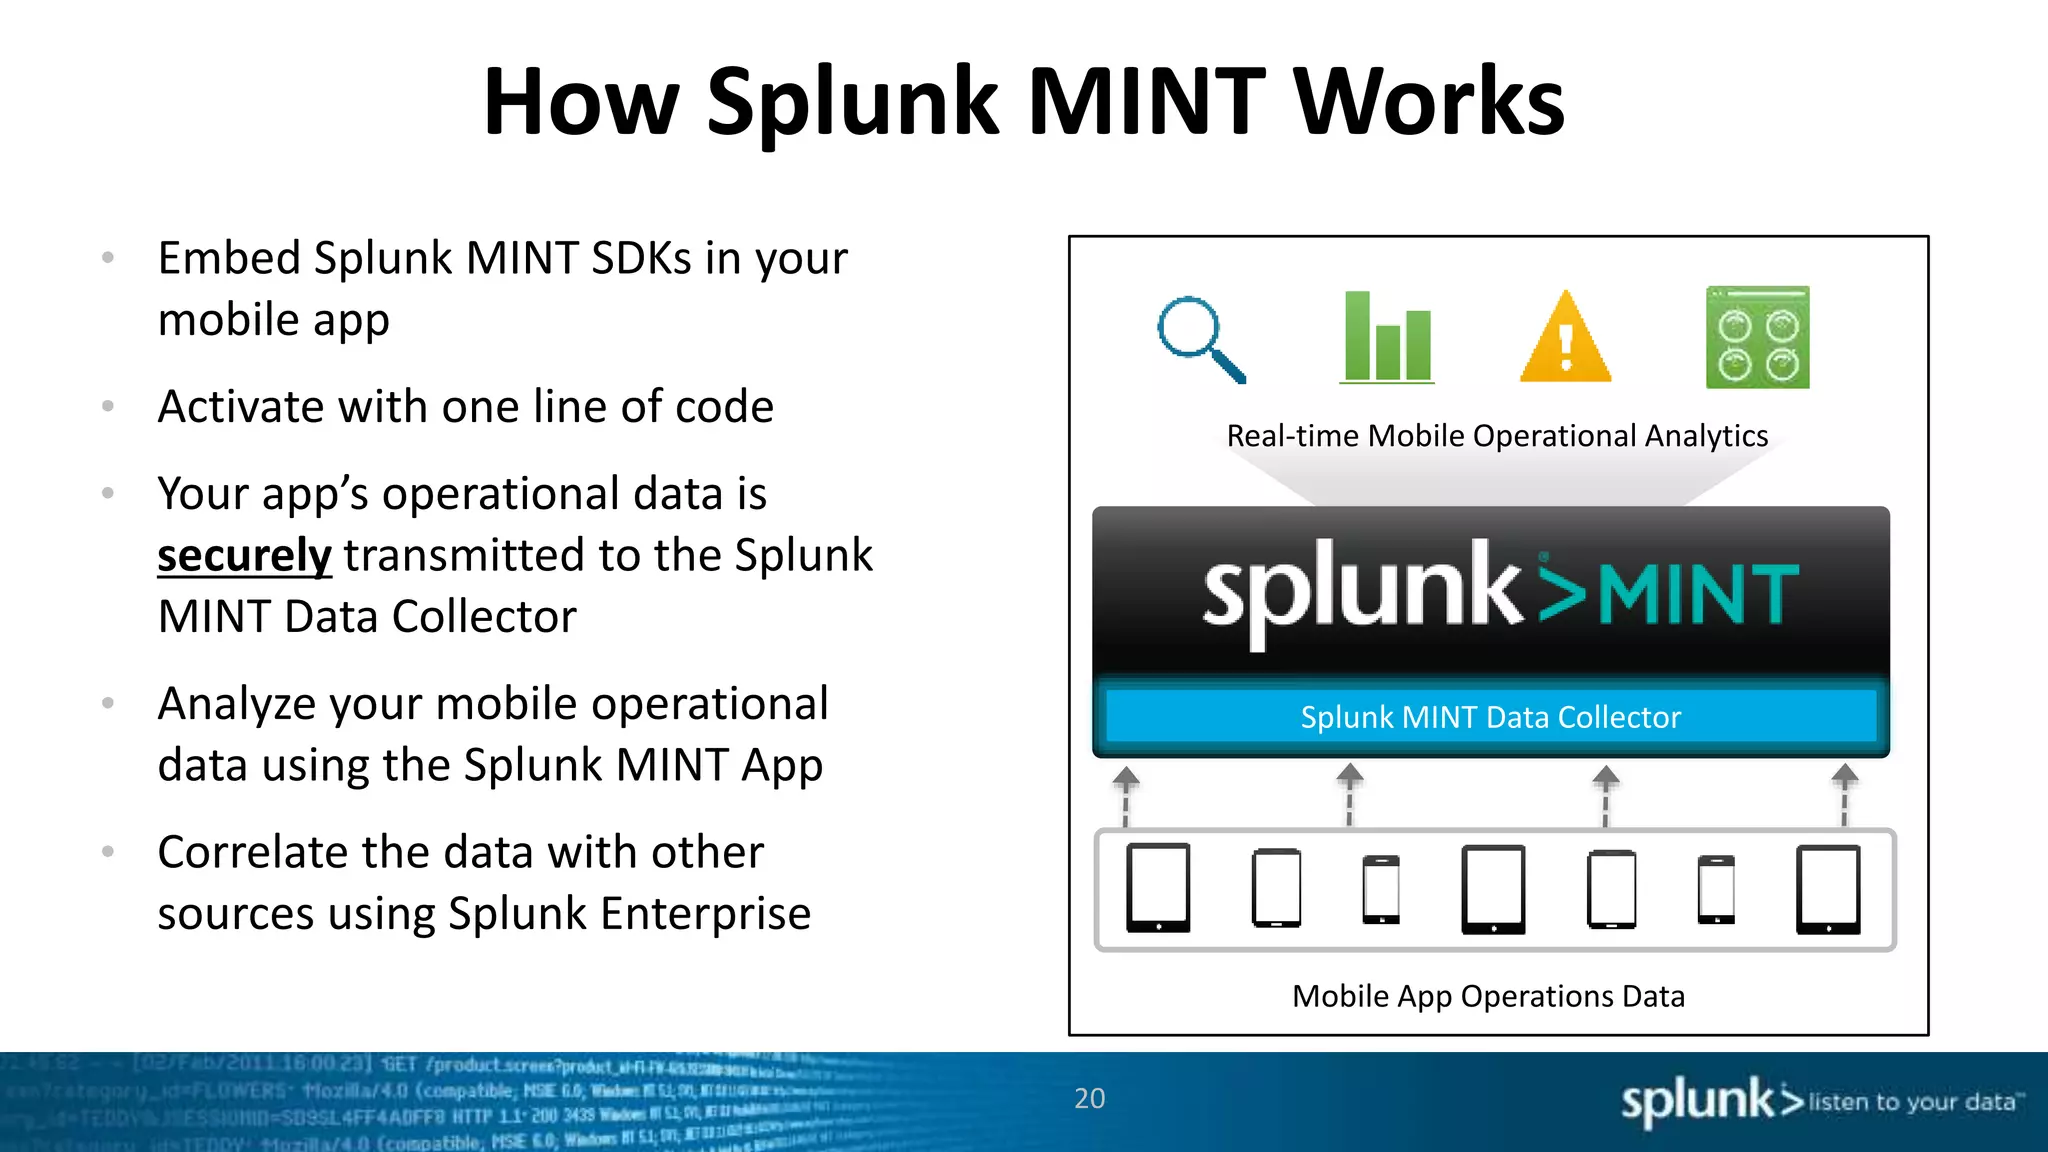
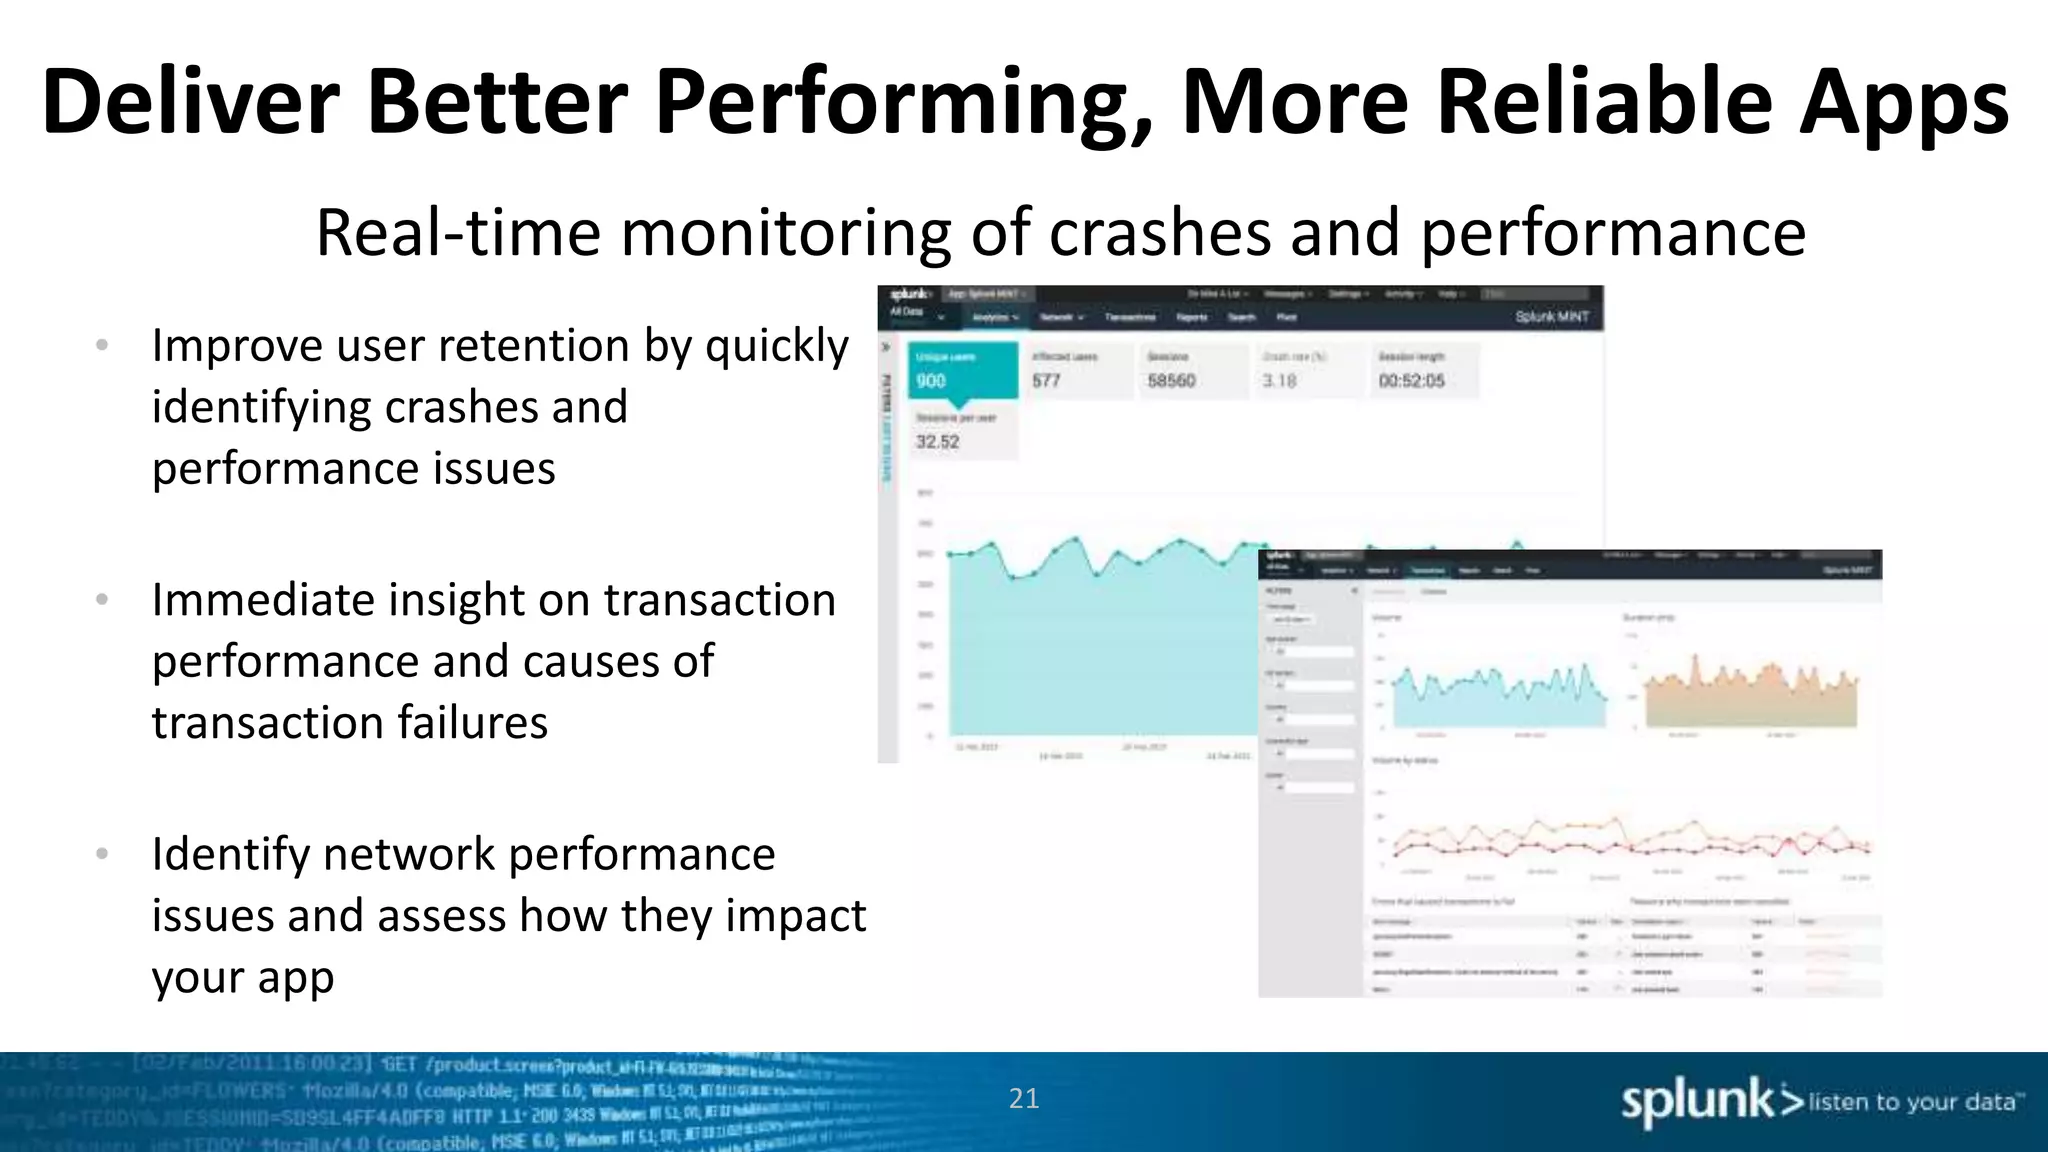
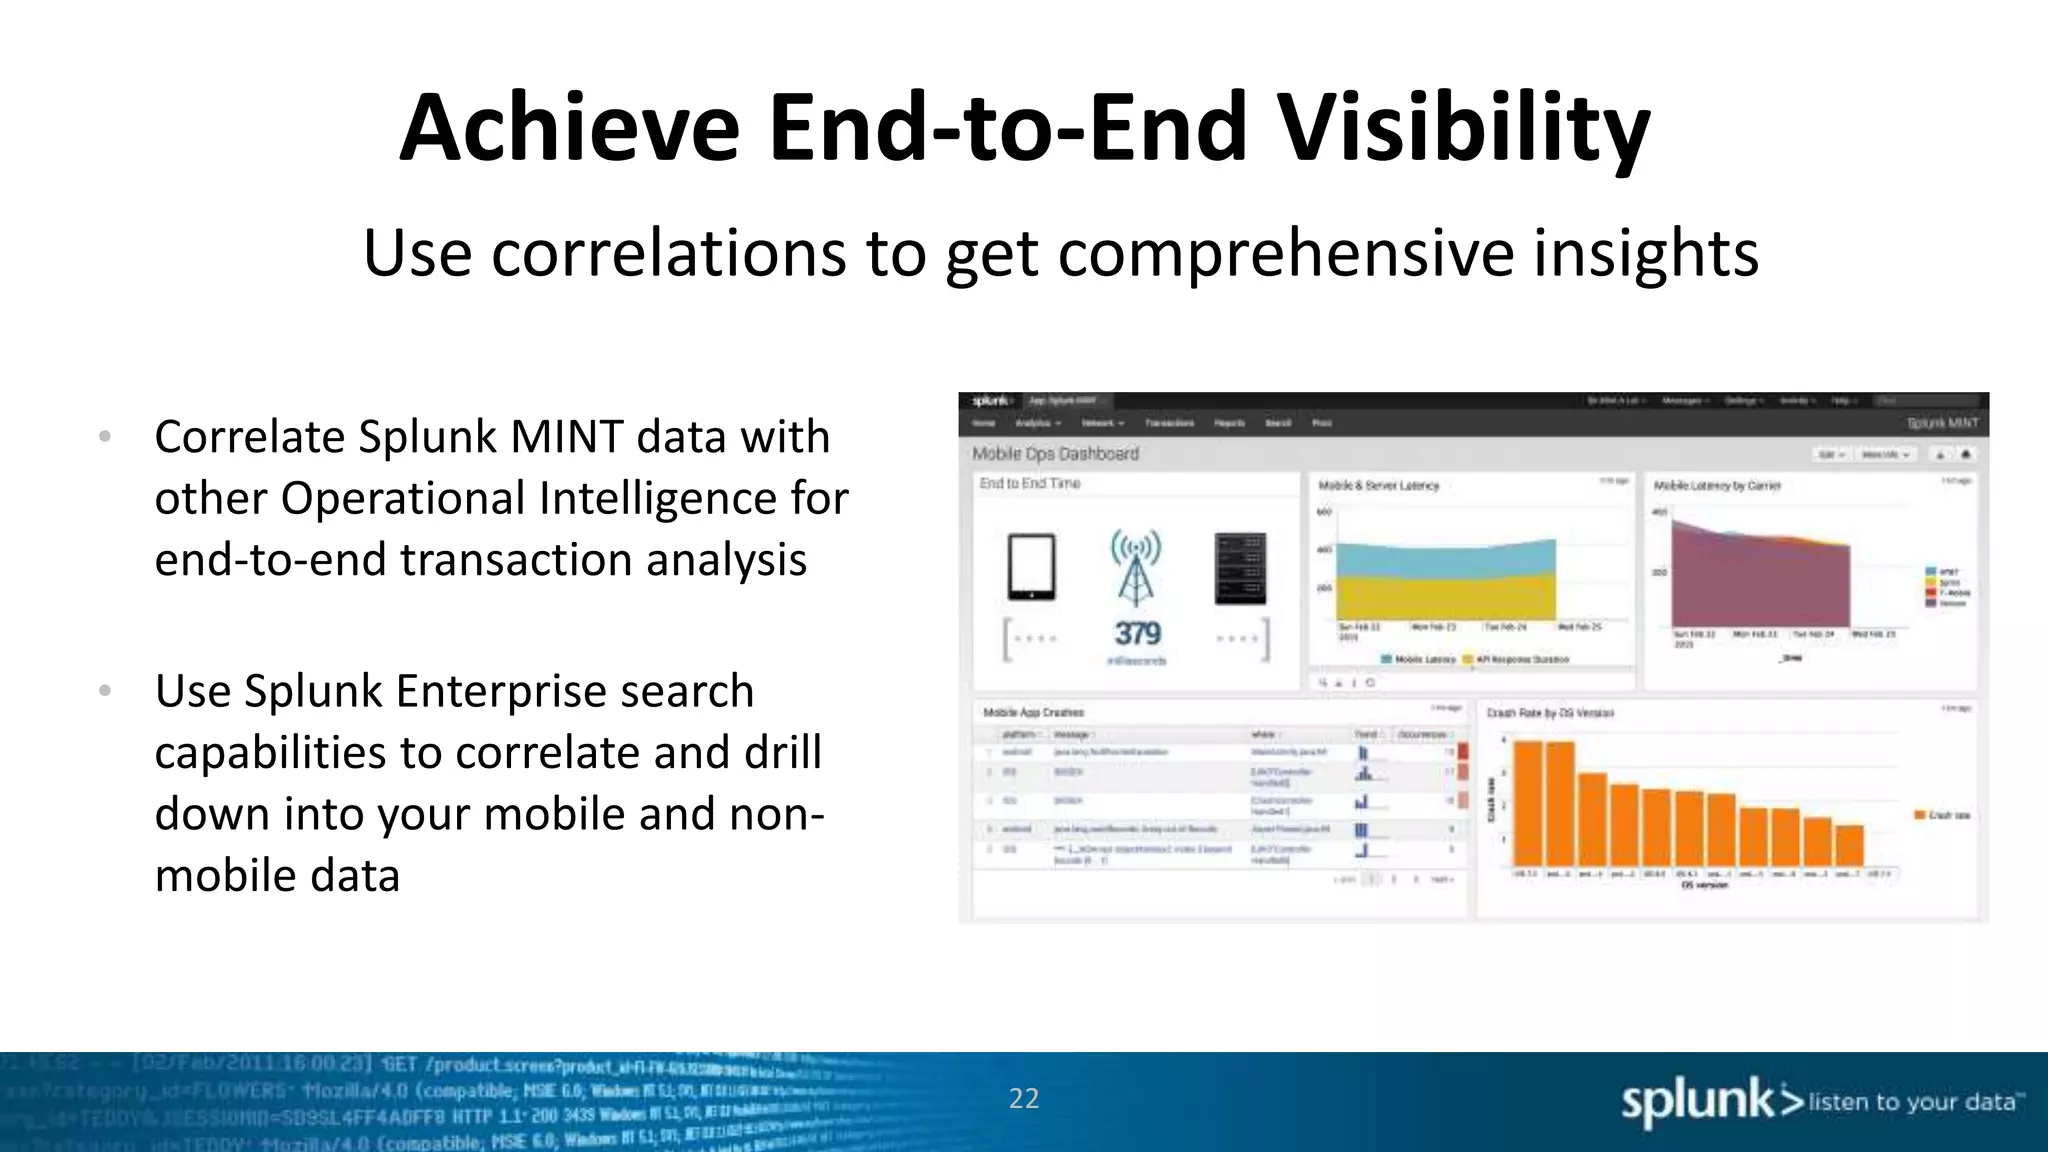
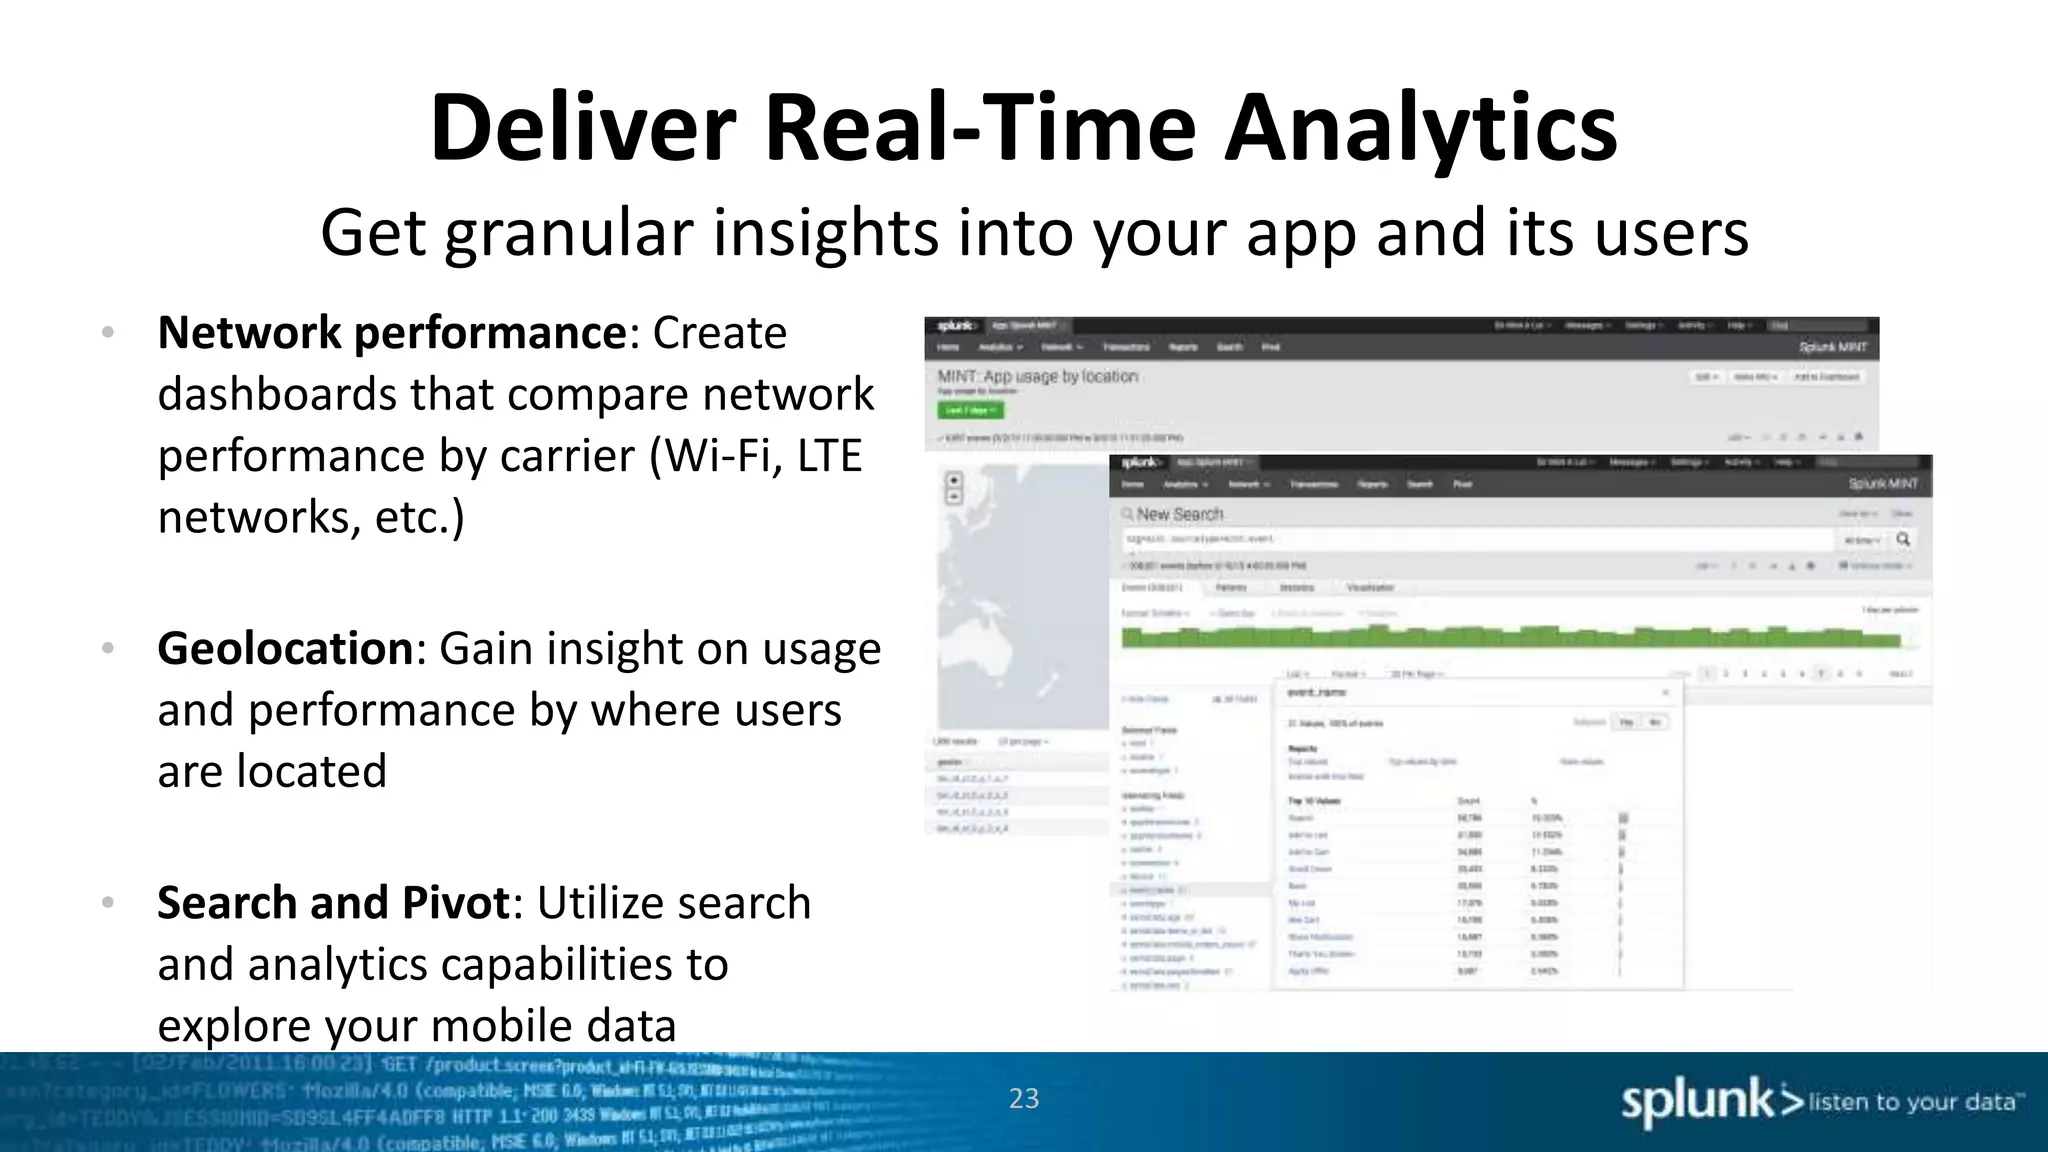
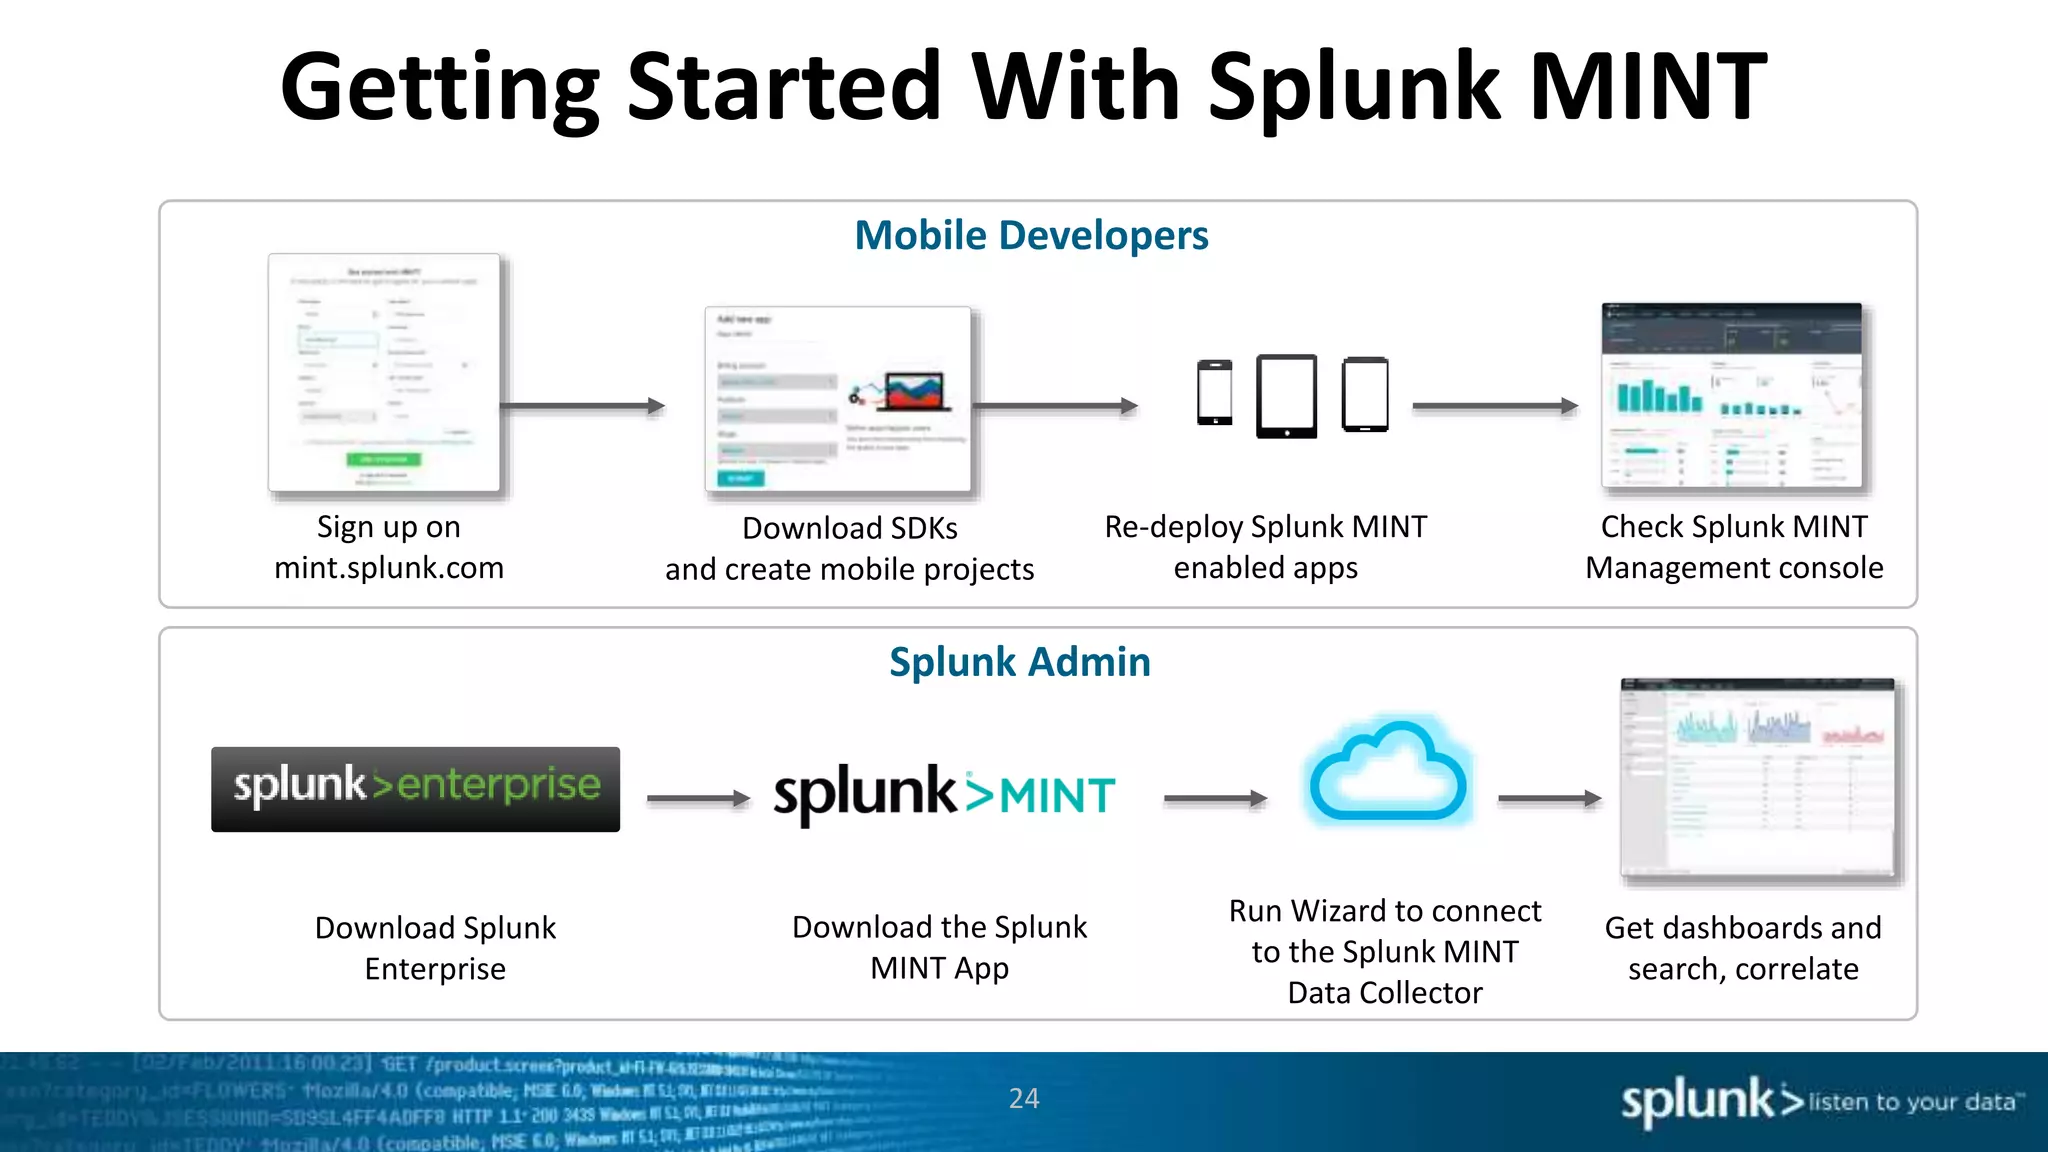
This document discusses new capabilities in Splunk's App for Stream and Splunk MINT products. It begins with an introduction and overview of each product. It then discusses key benefits like real-time insights, efficient cloud data collection, and fast time to value. Example use cases are provided for IT operations, security, and applications visibility. Supported protocols, platforms, and architecture options are also outlined. The document concludes by discussing challenges in mobile app delivery and how Splunk MINT addresses them through mobile data collection and correlation with other data sources.
Splunk MINT for Mobile Intelligence and Splunk App for Stream for Enhanced Op...Splunk
Learn what is new in Splunk App for Stream and how it can help you utilize wire/network data analytics to proactively resolve applications and IT operational issues and to efficiently analyze security threats in real-time, across your cloud and on-premises infrastructures. Additionally, you will learn about Splunk MINT, which allows you to gain operational intelligence on the availability, performance, and usage of your mobile apps. You’ll learn how to instrument your mobile apps for operational insight, and how you can build the dashboards, alerts, and searches you need to gain real-time insight on your mobile apps.
New Splunk Management Solutions Update: Splunk MINT and Splunk App for Stream Splunk
Learn what is new in Splunk App for Stream and how it can help you utilize wire/network data analytics to proactively resolve applications and IT operational issues and to efficiently analyze security threats in real-time, across your cloud and on-premises infrastructures. Additionally, you will learn about Splunk MINT, which allows you to gain operational intelligence on the availability, performance, and usage of your mobile apps. You’ll learn how to instrument your mobile apps for operational insight, and how you can build the dashboards, alerts, and searches you need to gain real-time insight on your mobile apps.
Attend to learn from our experts about ways to improve you IT Operational Intelligence by using Splunk for troubleshooting, monitoring and service-level visibility. In this hands-on session we will cover recommended approaches for end-to-end troubleshooting and monitoring across applications, OSes, and devices to resolve problems faster, reduce downtime and improve user satisfaction and customer retention. Topics will include: monitoring critical services, using commonly deployed apps and TAs to gather data for IT infrastructure uses, and using of pre-made dashboard panels to quickly build dashboards for monitoring your environment.
Splunk conf2014 - Dashboard Fun - Creating an Interactive Transaction ProfilerSplunk
Using Simple XML and Splunk Enterprise, learn how to create easy interactive dashboards to explore data. This demo showcases great tools to put ion the hands of Splunk users, help desk users and IT Operations staff.
Come and learn from our experts on ways to improve you IT Operational Visibility by using Splunk for monitoring environment health. In this hands-on session we will cover recommended approaches for end to end monitoring, across applications, OSes, and devices. Topics will include: critical services to monitor, use of the Splunk Common Information Model (CIM) for cross-dataset normalization, commonly deployed apps and TAs to gather data for IT infrastructure uses, and use of pre-made dashboard panels to quickly build dashboards for monitoring your environment.
Attend to learn from our experts about ways to improve you IT Operational Intelligence by using Splunk for troubleshooting, monitoring and service-level visibility. In this hands-on session we will cover recommended approaches for end-to-end troubleshooting and monitoring across applications, OSes, and devices to resolve problems faster, reduce downtime and improve user satisfaction and customer retention. Topics will include: monitoring critical services, using commonly deployed apps and TAs to gather data for IT infrastructure uses, and using of pre-made dashboard panels to quickly build dashboards for monitoring your environment.
How to Design, Build and Map IT and Business Services in SplunkSplunk
Your IT department supports critical business functions, processes and products. You're most effective when your technology initiatives are closely aligned and measured with specific business objectives. This session covers best practices and techniques for designing and building an effective service model, using the domain knowledge of your experts and capturing and reporting on key metrics that everyone can understand. We will design a sample service model and map them to performance indicators to track operational and business objectives. We will also show you how to make Splunk service-ware with Splunk IT Service Intelligence (ITSI).
Come and learn from our experts on ways to improve you IT Operational Visibility by using Splunk for monitoring environment health. In this hands-on session we will cover recommended approaches for end-to-end monitoring, across applications, OSes, and devices. Topics will include: critical services to monitor, use of the Splunk Common Information Model (CIM) for cross-dataset normalization, commonly deployed apps and TAs to gather data for IT infrastructure uses, and use of pre-made dashboard panels to quickly build dashboards for monitoring your environment.
How to Design, Build and Map IT and Business Services in SplunkSplunk
Your IT department supports critical business functions, processes and products. You're most effective when your technology initiatives are closely aligned and measured with specific business objectives. This session covers best practices and techniques for designing and building an effective service model, using the domain knowledge of your experts and capturing and reporting on key metrics that everyone can understand. We will design a sample service model and map them to performance indicators to track operational and business objectives. We will also show you how to make Splunk service-ware with Splunk IT Service Intelligence (ITSI).
Splunk Enterpise for Information Security Hands-OnSplunk
Splunk is the ultimate tool for the InfoSec hunter. In this unique session, we’ll dive straight into the Splunk search interface, and interact with wire data harvested from various interesting and hostile environments, as well as some web access logs. We’ll show how you can use Splunk Enterprise with a few free Splunk applications to hunt for attack patterns. We’ll also demonstrate some ways to add context to your data in order to reduce false positives and more quickly respond to information. Bring your laptop – you’ll need a web browser to access our demo systems!
What is Splunk? At the end of this session you’ll have a high-level understanding of the pieces that make up the Splunk Platform, how it works, and how it fits in the landscape of Big Data. You’ll see practical examples that differentiate Splunk while demonstrating how to gain quick time to value.
Learn How to Design, Build and Map Services to Quantifiable Measurements in S...Splunk
IT departments are most effective when IT services are measured against business objectives and defined performance indicators. But tracking performance of these services has historically been a challenge.
This webinar explains how you can design, build and map performance of your IT services—improving support of critical business functions, processes and applications.
Topics include:
-Best practices to design and build an effective service model
-Techniques to deconstruct a service into its component parts
-How to build meaningful “glass tables” in Splunk ITSI for real-time insights into service health and key performance indicators
Splunk: How to Design, Build and Map IT ServicesSplunk
Your IT department supports critical business functions, processes and products. You're most effective when your technology initiatives are closely aligned and measured with specific business objectives. This session covers best practices and techniques for designing and building an effective service model, using the domain knowledge of your experts and capturing and reporting on key metrics that everyone can understand.
Webinar: Splunk Enterprise Security Deep Dive: AnalyticsSplunk
Splunk Enterprise Security (ES) ist ein Analytics-getriebenes SIEM, das Security Operations Teams erfolgreich bei der Gefahrenbekämpfung unterstützt. Aber wussten Sie auch schon, dass es aus einem Framework aufgebaut ist, das ganz individuell genutzt werden kann, um spezifische Sicherheitsanforderungen angehen zu können?
In unserem Webinar zeigen wir Ihnen die technischen Details hinter dem ES-Framework:
- Asset- und Identitäts-Korrelationen
- beachtenswerte Events
- Threat intelligence
- Risikoanalyse
- Investigation und Adaptive Response
Wir werden Alltags-Beispiele besprechen und Ihnen anhand einer Demo die Schlüssel-Frameworks zeigen, die Ihnen dabei helfen werden, Securityprobleme zu lösen.
Taking Splunk to the Next Level - ArchitectureSplunk
This session led by Michael Donnelly will teach you how to take your Splunk deployment to the next level. Learn about Splunk high availability architectures with Splunk Search Head Clustering and Index Replication. Additionally, learn how to manage your deployment with Splunk’s operational and management controls to manage Splunk capacity and end user experience
Building a Security Information and Event Management platform at Travis Per...Splunk
Faced with a complex, heterogeneous IT infrastructure and a ‘Cloud First’ instruction from the board, Nick Bleech, Head of Information Security at building supplies giant Travis Perkins, used Splunk Enterprise Security running on Splunk Cloud to deliver enhanced security for 27,000 employees.
Splunk allowed Travis Perkins to provide real-time security monitoring, faster incident resolution and improved data governance while delivering demonstrable business value to the board.
In this webinar, Nick Bleech discusses:
● The business and security drivers of deploying a cloud-based security incident and event management solution
● The overall benefits of the Splunk solution
● The project’s critical success factors
● How stakeholders and the overall project were managed
● The positive impact on the deployment on the IT operations and IT security teams
● The next steps in the development of a lightweight security operations centre
What’s New: Splunk App for Stream and Splunk MINTSplunk
Join us to learn what is new in Splunk App for Stream and how it can help you utilize wire/network data analytics to proactively resolve applications and IT operational issues and to efficiently analyze security threats in real-time, across your cloud and on-premises infrastructures. Additionally, you will learn about Splunk MINT, which allows you to gain operational intelligence on the availability, performance, and usage of your mobile apps. You’ll learn how to instrument your mobile apps for operational insight, and how you can build the dashboards, alerts, and searches you need to gain real-time insight on your mobile apps.
Splunk App for Stream for Enhanced Operational Intelligence from Wire DataSplunk
Join us to learn what is new in Splunk App for Stream and how it can help you utilize wire/network data analytics to proactively resolve applications and IT operational issues and to efficiently analyze security threats in real-time, across your cloud and on-premises infrastructures.
If mobile apps are part of your business, having real-time insight on app performance, crashes, usage and transactions is critical. Data derived directly from mobile app usage—called “mobile data”—can help you deliver better performing apps and increase application visibility. With the massive increase in smartphone and mobile app usage, your app’s performance is more important than ever. Learn how to gain Operational Intelligence from your mobile apps with Splunk MINT.
Splunk for Industrial Data and the Internet of Thingsaliciasyc
The IoT is a natural evolution of the world’s networks. Just as people became more connected by devices and applications during the explosion of the social media revolution, devices, sensors and industrial equipment are also becoming more connected—and are consuming and generating data at an unprecedented pace. Disparate and deployed connected devices can provide a unique touchpoint to real-world operations and conditions. Only few architectures and applications are designed to handle the constant streams of real-time events, sensor readings, user interactions and application data produced by massive numbers of connected devices. Use Splunk to collect, index and harness the power of the machine data generated by connected devices and machines deployed on your local network or around the world.
Here’s your chance to get hands-on with Splunk for the first time! Bring your modern Mac, Windows, or Linux laptop and we’ll go through a simple install of Splunk. Then, we’ll load some sample data, and see Splunk in action – we’ll cover searching, pivot, reporting, alerting, and dashboard creation. At the end of this session you’ll have a hands-on understanding of the pieces that make up the Splunk Platform, how it works, and how it fits in the landscape of Big Data. You’ll experience practical examples that differentiate Splunk while demonstrating how to gain quick time to value.
Learn about Splunk MINT, which allows you to gain operational intelligence on the availability, performance, and usage of your mobile apps. You’ll learn how to instrument your mobile apps for operational insight, and how you can build the dashboards, alerts, and searches you need to gain real-time insight on your mobile apps.
What is Splunk? At the end of this session you’ll have a high-level understanding of the pieces that make up the Splunk Platform, how it works, and how it fits in the landscape of Big Data. You’ll see practical examples that differentiate Splunk while demonstrating how to gain quick time to value.
An overview of Splunk Enterprise 6.3. Presented by Splunk's Jim Viegas at GTRI's Splunk Tech Day, December 8, 2015.
Visit http://www.gtri.com/ for more information.
Here’s your chance to get hands-on with Splunk for the first time! Bring your modern Mac, Windows, or Linux laptop and we’ll go through a simple install of Splunk. Then, we’ll load some sample data, and see Splunk in action – we’ll cover searching, pivot, reporting, alerting, and dashboard creation. At the end of this session you’ll have a hands-on understanding of the pieces that make up the Splunk Platform, how it works, and how it fits in the landscape of Big Data. You’ll experience practical examples that differentiate Splunk while demonstrating how to gain quick time to value.
.conf Go 2023 - Das passende Rezept für die digitale (Security) Revolution zu...Splunk
.conf Go 2023 presentation:
"Das passende Rezept für die digitale (Security) Revolution zur Telematik Infrastruktur 2.0 im Gesundheitswesen?"
Speaker: Stefan Stein -
Teamleiter CERT | gematik GmbH M.Eng. IT-Sicherheit & Forensik,
doctorate student at TH Brandenburg & Universität Dresden
.conf Go 2023 presentation:
De NOC a CSIRT
Speakers:
Daniel Reina - Country Head of Security Cellnex (España) & Global SOC Manager Cellnex
Samuel Noval - Global CSIRT Team Leader, Cellnex
Splunk - BMW connects business and IT with data driven operations SRE and O11ySplunk
BMW is defining the next level of mobility - digital interactions and technology are the backbone to continued success with its customers. Discover how an IT team is tackling the journey of business transformation at scale whilst maintaining (and showing the importance of) business and IT service availability. Learn how BMW introduced frameworks to connect business and IT, using real-time data to mitigate customer impact, as Michael and Mark share their experience in building operations for a resilient future.
Data foundations building success, at city scale – Imperial College LondonSplunk
Universities have more in common with modern cities than traditional places of learning. This mini city needs to empower its citizens to thrive and achieve their ambitions. Operationalising data is key to building critical services; from understanding complex IT estates for smarter decision-making to robust security and a more reliable, resilient student experience. Juan will share his experience in building data foundations for a resilient future whilst enabling digital transformation at Imperial College London.
Splunk: How Vodafone established Operational Analytics in a Hybrid Environmen...Splunk
Learn how Vodafone has provided end-to-end visibility across services by building an Operational Analytics Platform. In this session, you will hear how Stefan and his team manage legacy, on premise, hybrid and public cloud services, and how they are providing a platform for complex triage and debugging to tackle use cases across Vodafone’s extensive ecosystem.
.italo operates an Essential Service by connecting more than 100 million people annually across Italy with its super fast and secure railway. And CISO Enrico Maresca has been on a whirlwind journey of his own.
Formerly a Cyber Security Engineer, Enrico started at .italo as an IT Security Manager. One year later, he was promoted to CISO and tasked with building out – and significantly increasing the maturity level – of the SOC. The result was a huge step forward for .italo.
So how did he successfully achieve this ambitious ask? Join Enrico as he reveals the key insights and lessons learned in his SOC journey, including:
Top challenges faced in improving security posture
Key KPIs implemented in order to measure success
Strategies and approaches applied in the SOC
How MITRE ATT&CK and Splunk Enterprise Security were utilised
Next steps in their maturity journey ahead
LF Energy Webinar: Electrical Grid Modelling and Simulation Through PowSyBl -...DanBrown980551
Do you want to learn how to model and simulate an electrical network from scratch in under an hour?
Then welcome to this PowSyBl workshop, hosted by Rte, the French Transmission System Operator (TSO)!
During the webinar, you will discover the PowSyBl ecosystem as well as handle and study an electrical network through an interactive Python notebook.
PowSyBl is an open source project hosted by LF Energy, which offers a comprehensive set of features for electrical grid modelling and simulation. Among other advanced features, PowSyBl provides:
- A fully editable and extendable library for grid component modelling;
- Visualization tools to display your network;
- Grid simulation tools, such as power flows, security analyses (with or without remedial actions) and sensitivity analyses;
The framework is mostly written in Java, with a Python binding so that Python developers can access PowSyBl functionalities as well.
What you will learn during the webinar:
- For beginners: discover PowSyBl's functionalities through a quick general presentation and the notebook, without needing any expert coding skills;
- For advanced developers: master the skills to efficiently apply PowSyBl functionalities to your real-world scenarios.
Smart TV Buyer Insights Survey 2024 by 91mobiles.pdf91mobiles
91mobiles recently conducted a Smart TV Buyer Insights Survey in which we asked over 3,000 respondents about the TV they own, aspects they look at on a new TV, and their TV buying preferences.
UiPath Test Automation using UiPath Test Suite series, part 4DianaGray10
Welcome to UiPath Test Automation using UiPath Test Suite series part 4. In this session, we will cover Test Manager overview along with SAP heatmap.
The UiPath Test Manager overview with SAP heatmap webinar offers a concise yet comprehensive exploration of the role of a Test Manager within SAP environments, coupled with the utilization of heatmaps for effective testing strategies.
Participants will gain insights into the responsibilities, challenges, and best practices associated with test management in SAP projects. Additionally, the webinar delves into the significance of heatmaps as a visual aid for identifying testing priorities, areas of risk, and resource allocation within SAP landscapes. Through this session, attendees can expect to enhance their understanding of test management principles while learning practical approaches to optimize testing processes in SAP environments using heatmap visualization techniques
What will you get from this session?
1. Insights into SAP testing best practices
2. Heatmap utilization for testing
3. Optimization of testing processes
4. Demo
Topics covered:
Execution from the test manager
Orchestrator execution result
Defect reporting
SAP heatmap example with demo
Speaker:
Deepak Rai, Automation Practice Lead, Boundaryless Group and UiPath MVP
Dev Dives: Train smarter, not harder – active learning and UiPath LLMs for do...UiPathCommunity
💥 Speed, accuracy, and scaling – discover the superpowers of GenAI in action with UiPath Document Understanding and Communications Mining™:
See how to accelerate model training and optimize model performance with active learning
Learn about the latest enhancements to out-of-the-box document processing – with little to no training required
Get an exclusive demo of the new family of UiPath LLMs – GenAI models specialized for processing different types of documents and messages
This is a hands-on session specifically designed for automation developers and AI enthusiasts seeking to enhance their knowledge in leveraging the latest intelligent document processing capabilities offered by UiPath.
Speakers:
👨🏫 Andras Palfi, Senior Product Manager, UiPath
👩🏫 Lenka Dulovicova, Product Program Manager, UiPath
Encryption in Microsoft 365 - ExpertsLive Netherlands 2024Albert Hoitingh
In this session I delve into the encryption technology used in Microsoft 365 and Microsoft Purview. Including the concepts of Customer Key and Double Key Encryption.
The Art of the Pitch: WordPress Relationships and SalesLaura Byrne
Clients don’t know what they don’t know. What web solutions are right for them? How does WordPress come into the picture? How do you make sure you understand scope and timeline? What do you do if sometime changes?
All these questions and more will be explored as we talk about matching clients’ needs with what your agency offers without pulling teeth or pulling your hair out. Practical tips, and strategies for successful relationship building that leads to closing the deal.
Neuro-symbolic is not enough, we need neuro-*semantic*Frank van Harmelen
Neuro-symbolic (NeSy) AI is on the rise. However, simply machine learning on just any symbolic structure is not sufficient to really harvest the gains of NeSy. These will only be gained when the symbolic structures have an actual semantics. I give an operational definition of semantics as “predictable inference”.
All of this illustrated with link prediction over knowledge graphs, but the argument is general.
Connector Corner: Automate dynamic content and events by pushing a buttonDianaGray10
Here is something new! In our next Connector Corner webinar, we will demonstrate how you can use a single workflow to:
Create a campaign using Mailchimp with merge tags/fields
Send an interactive Slack channel message (using buttons)
Have the message received by managers and peers along with a test email for review
But there’s more:
In a second workflow supporting the same use case, you’ll see:
Your campaign sent to target colleagues for approval
If the “Approve” button is clicked, a Jira/Zendesk ticket is created for the marketing design team
But—if the “Reject” button is pushed, colleagues will be alerted via Slack message
Join us to learn more about this new, human-in-the-loop capability, brought to you by Integration Service connectors.
And...
Speakers:
Akshay Agnihotri, Product Manager
Charlie Greenberg, Host
GDG Cloud Southlake #33: Boule & Rebala: Effective AppSec in SDLC using Deplo...James Anderson
Effective Application Security in Software Delivery lifecycle using Deployment Firewall and DBOM
The modern software delivery process (or the CI/CD process) includes many tools, distributed teams, open-source code, and cloud platforms. Constant focus on speed to release software to market, along with the traditional slow and manual security checks has caused gaps in continuous security as an important piece in the software supply chain. Today organizations feel more susceptible to external and internal cyber threats due to the vast attack surface in their applications supply chain and the lack of end-to-end governance and risk management.
The software team must secure its software delivery process to avoid vulnerability and security breaches. This needs to be achieved with existing tool chains and without extensive rework of the delivery processes. This talk will present strategies and techniques for providing visibility into the true risk of the existing vulnerabilities, preventing the introduction of security issues in the software, resolving vulnerabilities in production environments quickly, and capturing the deployment bill of materials (DBOM).
Speakers:
Bob Boule
Robert Boule is a technology enthusiast with PASSION for technology and making things work along with a knack for helping others understand how things work. He comes with around 20 years of solution engineering experience in application security, software continuous delivery, and SaaS platforms. He is known for his dynamic presentations in CI/CD and application security integrated in software delivery lifecycle.
Gopinath Rebala
Gopinath Rebala is the CTO of OpsMx, where he has overall responsibility for the machine learning and data processing architectures for Secure Software Delivery. Gopi also has a strong connection with our customers, leading design and architecture for strategic implementations. Gopi is a frequent speaker and well-known leader in continuous delivery and integrating security into software delivery.
Transcript: Selling digital books in 2024: Insights from industry leaders - T...BookNet Canada
The publishing industry has been selling digital audiobooks and ebooks for over a decade and has found its groove. What’s changed? What has stayed the same? Where do we go from here? Join a group of leading sales peers from across the industry for a conversation about the lessons learned since the popularization of digital books, best practices, digital book supply chain management, and more.
Link to video recording: https://bnctechforum.ca/sessions/selling-digital-books-in-2024-insights-from-industry-leaders/
Presented by BookNet Canada on May 28, 2024, with support from the Department of Canadian Heritage.
2. Disclaimer
During the course of this presentation, we may make forward looking statements regarding future events or the
expected performance of the company. We caution you that such statements reflect our current expectations and
estimates based on factors currently known to us and that actual events or results could differ materially. For important
factors that may cause actual results to differ from those contained in our forward-looking statements, please review
our filings with the SEC. The forward-looking statements made in the this presentation are being made as of the time
and date of its live presentation. If reviewed after its live presentation, this presentation may not contain current or
accurate information. We do not assume any obligation to update any forward looking statements we may make. In
addition, any information about our roadmap outlines our general product direction and is subject to change at any
time without notice. It is for informational purposes only and shall not, be incorporated into any contract or other
commitment. Splunk undertakes no obligation either to develop the features or functionality described or to include
any such feature or functionality in a future release.
4. Ad-hoc Analysis On Wire Data Is Challenging
Volume, velocity
and variety
make it difficult to collect,
explore, analyze and
visualize wire data
Distributed
datacenters
introduce challenges in
accessing wire data from
public and hybrid clouds
Complex network
environments
make installation and
management of probes
and appliances laborious
5. See Everything with Splunk App for Stream
Enables real-time
insights into private,
public and hybrid
cloud infrastructures
Delivers rapid
deployment, easy
scale out and efficient
wire data capture
Capture and analyze
critical events not
found in logs or with
other collection
methods.
1 2 3
Enhance Operational Intelligence With Wire Data Capture
6. Example: What Is Available From The Wire
Performance Metrics
Round Trip Time
Client Request Time
Server Reply Time
Server Send Time
Total Time Taken
Base HTML Load Time
Page Content Load Time
Total Page Load Time
Application Data
POST Content
AJAX Data
Section
Sub-Section
Page Title
Session Cookie
Proxied IP Address
Error Message
Business Data
Product ID
Customer ID
Shopping Cart ID
Cart Items
Cart Values
Discounts
Order ID
Abandoned?
7. 7
Enable New Operational Insights
• Add information about application, infrastructure, security and
business activity, without needing instrumentation
• Support new and extends existing Splunk use cases across IT, security
and the business with wire data capture
Enhanced Operational
Intelligence
Efficient, Cloud-Ready Wire
Data Collection
Fast Time to Value
• Gain visibility into any public, private or hybrid cloud infrastructures
with a software solution
• Control data collection volumes with fine-grained protocol and
attribute filtering
• Deploy quickly from interface-driven install
• Enable rapid incident response
• Easily scale out with centralized management
8. Better Insights for IT Operations
• Get real-time granular insights to
reduce MTTR without costly
appliances
• Analyze all applications and user
behavior, measure application
response times and trace
transaction paths
• Identify infrastructure performance
issues, capacity constraints,
changes and establish baselines
Value
+
Contextual
Data
Application logs,
infrastructure (storage,
network, server) logs,
performance metrics,
events
8
SQL queries, DNS records, IP
conversations,
transaction traces, ICA
latency, response times
Wire Data
9. Better Insights for Security
• Real-time DPI of wire data backed with
analytics enables easier forensics
analyses and quicker incident response
• Analyze all user and applications
behavior and respond timely to threats
with cost efficient real-time header
and payload field extraction
• Baseline network traffic and
understand anomalies associated with
advanced and insider threats
• Quick software install at end points,
network infrastructures and cloud
without expensive appliances
Value
+
Contextual
Data
Firewall logs, application
logs, IDS logs, network logs,
perf. metrics, events
9
User and application traffic,
protocol identification (TCP,
DNS, HTTP, etc.), protocol
headers & payload
extraction, SSL decryption
Wire Data
10. Applications Visibility for Easy Capacity Planning
AVP of Networks and Communications,
Large National Bank
“I enjoyed using the Splunk App for Stream as it's
giving us a bunch of different perspectives on
our traffic and better granularity compared to
some of the other tools we used. Stream is
unique because Splunk analytics are tied to a
network monitoring tool.”
• Granular application and network visibility drives
easy remediation
• Proactive applications and network traffic
monitoring enables better capacity reporting and
planning
• Powerful analytical engine enables data analyses by
novice users
Key Customer Benefits
Deployment
• Quick host-based deployment at critical network
segments
– Ability to observe both client and server traffic
10
11. Stream at CanDeal: Breaking the Silos
Kris Laxdal,
IT Manager & Security Analyst
“Stream allows our IT Ops, security and
developers teams to get relevant data quickly.”
“You cannot show up with traditional packet
captures tool in the boardroom. Stream and
Splunk help us understand issues at the high
level and if exec team wants to see the details
we can drill down easily. That is what's great
about Stream! ”
IT Operations
• High level view with contextual drill-down ability
• Easy access and visibility into production MySQL
environment helps application developers troubleshoot
issues and roll out releases quicker
• Improved collaboration between teams: IT Operations,
QA (pre-production testing), security and development
• Improved customer response times due to real-time
visibility into application issues
Security
• Correlation against indicators of compromise helps
investigate and mitigate Advanced Persistent Threats
(APTs), potential data exfiltration & other risks
Key Customer Benefits
11
12. Wire Data Speeds Up Forensics
Security Engineer,
Financial Services Institution
“The biggest value of Stream is how fast can we
resolve and close security cases. Before Stream,
I had to collect data from multiple systems and
it would take me an hour. With Stream,
information is already there and I can get
answers within 5 minutes. It is much easier to
get data now.”
• 90% reduction in incident triage and investigation time
• Deeper, quicker and easier understanding of traffic and
user activity for forensic purposes
• Immediate insights and improved data collection:
– Elimination of moving pcap files around between
several tools
Key Customer Benefits
Deployment
• Flexible and easy deployment on key network
locations
12
13. Supported Protocols and Platforms
• UDP
• TCP
• HTTP
• IMAP
• MySQL
(login/cmd/query)
• Oracle (TNS)
• PostgreSQL
• Sybase/SQL Server
(TDS)
• FTP
• SMB
• NFS
• POP3
• SMTP
• LDAP/AD
• SIP
• XMPP
• AMQP
• MAPI
• IRC
Supports Windows 7 (64-bit), Windows 2008 R2 (64 bit), Linux (32-bit/64-bit) and Mac OSX (64-bit)
• DNS
• DHCP
• RADIUS
• Diameter
• BitTorrent
• SMPP
13
Improved performance requiring less compute/memory power!
15. Architecture: Run on Servers
15
End Users
Firewall
Splunk
Indexers
Search head
Physical or Virtual Servers
Universal Forwarder
Splunk_TA_stream
Internet
Physical Datacenter,
Public or Private Cloud
17. • New OS versions
break apps
• Network issues are
difficult to find and
simulate
• Limited time to make
changes and fixes
The Challenges of Delivering Mobile Apps
17
• Plan for growth
• Solve infrastructure,
API and app issues
• Feature usage
• Monitor/analyze
user behavior
• Deliver omni-channel
analytics
• Mobile+web+desktop
Form Factor, Platform,
Interaction Style
Variety
Rapid App Dev Cycles,
Break-Fix Needs
Infrastructure Analytics
• OS and device-
centric development
• Need to correlate
devices, versions
18. Mobile App Delivery: Different Challenges for Different Roles
18
• How do I find the root cause of app crashes/poor performance?
• What were users doing when the issue happened?
• How do I get more insight into transaction paths?
• Is the problem with the app, the network or the backend system?
• Do I have the right capacity in place to handle transaction volume?
• How does performance compare mobile vs. web vs. desktop?
• How are customers using my app?
• Which features should I prioritize for future versions?
• How does customer behavior compare across channels?
APP MANAGERS/
OPERATIONS
PRODUCT MANAGERS/
BUSINESS OWNERS
MOBILE APP
DEVELOPERS
19. Enhance Operational Intelligence Using Mobile Data
19
Deliver Better
Performing, More
Reliable Apps
Deliver Real-Time
Analytics
Achieve End-to-End
Visibility
20. How Splunk MINT Works
• Embed Splunk MINT SDKs in your
mobile app
• Activate with one line of code
• Your app’s operational data is
securely transmitted to the Splunk
MINT Data Collector
• Analyze your mobile operational
data using the Splunk MINT App
• Correlate the data with other
sources using Splunk Enterprise
20
Mobile App Operations Data
Splunk MINT Data Collector
Real-time Mobile Operational Analytics
21. Deliver Better Performing, More Reliable Apps
• Improve user retention by quickly
identifying crashes and
performance issues
• Immediate insight on transaction
performance and causes of
transaction failures
• Identify network performance
issues and assess how they impact
your app
21
Real-time monitoring of crashes and performance
22. Achieve End-to-End Visibility
• Correlate Splunk MINT data with
other Operational Intelligence for
end-to-end transaction analysis
• Use Splunk Enterprise search
capabilities to correlate and drill
down into your mobile and non-
mobile data
22
Use correlations to get comprehensive insights
23. Deliver Real-Time Analytics
• Network performance: Create
dashboards that compare network
performance by carrier (Wi-Fi, LTE
networks, etc.)
• Geolocation: Gain insight on usage
and performance by where users
are located
• Search and Pivot: Utilize search
and analytics capabilities to
explore your mobile data
23
Get granular insights into your app and its users
24. Getting Started With Splunk MINT
24
Mobile Developers
Sign up on
mint.splunk.com
Download SDKs
and create mobile projects
Download Splunk
Enterprise
Splunk Admin
Re-deploy Splunk MINT
enabled apps
Check Splunk MINT
Management console
Download the Splunk
MINT App
Run Wizard to connect
to the Splunk MINT
Data Collector
Get dashboards and
search, correlate
25. MINT Benefits Developers and the Business
25
• Immediate quality insights
• User, usage, transaction, network visibility
• Fast time-to-value with lightweight SDK
• Find bottlenecks across app, network, backend, APIs
• Right size capacity for transaction volumes
• Ensure performance across all channels
• User behavior, user experience insights
• Faster, more valuable improvements
• Omni-channel analytics
APP MANAGERS/
OPERATIONS
PRODUCT MANAGERS/
BUSINESS OWNERS
MOBILE APP
DEVELOPERS
27. Three Takeaways
Splunk App for Stream
helps you see
everything!
Splunk MINT helps
you deliver more
reliable and better
performing mobile
apps!
Use Splunk software
for an end-to-end
view of your critical
applications!
1 2 3
29. The 6th Annual Splunk Worldwide Users’ Conference
September 21-24, 2015 The MGM Grand Hotel, Las Vegas
• 50+ Customer Speakers
• 50+ Splunk Speakers
• 35+ Apps in Splunk Apps Showcase
• 65 Technology Partners
• 4,000+ IT & Business Professionals
• 2 Keynote Sessions
• 3 days of technical content (150+ Sessions)
• 3 days of Splunk University
– Get Splunk Certified
– Get CPE credits for CISSP, CAP, SSCP, etc.
– Save thousands on Splunk education!
29
Register at: conf.splunk.com
30. We Want to Hear your Feedback!
After the Breakout Sessions conclude
Text Splunk SLC to 878787
And be entered for a chance to win a $100 AMEX gift card!
Editor's Notes
While wire data is a golden source of operational performance information, it is very challenging to deal with. It is high-volume, running to petabytes of raw data a day; it is high-velocity, with higher speed interfaces such as 10 GBps and 40 GBps becoming the new standard capacity in datacenters and ever increasing capacity in the cloud; it is high-variety, with a multitude of application protocols and styles of transactions in use. Wire data can also be difficult to harvest in a scalable manner. There is typically dozens of potential instrumentation points on the wire within a single data center where valuable application and operational data can be obtained. This easily extends to hundreds of instrumentation points distributed across a global enterprise. As well, an accurate representation of the wire data is required to maximize its operational value.
Splunk App for Stream is a free App that enables you to capture, visualize and analyze data in much more granular way then ever before. You can see everything – ALL user and applications behavior ],response times from every layer, DNS information, storage traffic, network traffic, your websites content, connections. Once this data is in Splunk you can correlate it with other data for much more comprehensive visibility. First Splunk App for Stream is a way of get wire data into Splunk Enterprise. By adding this comprehensive source of machine data, it enables you to extend Operational Intelligence use cases across IT security and the business. It is a software only solution with the ability that can be installed on VM on any host, it enables real-time insights into multi-cloud environments. And as such, it is easy to install anywhere on most of standard machines, it is a passive very efficient way to capture data.
What can you get out of wire data that you don’t already get from other machine data? Many different things as shown here much more than what specific application chose to log. Anything from data that appeal to the admin level user – the things as how long it takes for this page to load or round trip time. Than application owners can get information valuable for them, what are the error messages we are getting from particular application so that they can further investigate the applications issues. Finally, wire data contains information relevent for business users, what are customers buying, are they abandoning carts, where are this purchases coming from. And this is just a small example….there is way more. There is a small amount of overlap between wire data and other data that we’ve captured so far but it requires deeper and more intrusive instrumentation
Optional text
For example, web server logs typically record status codes such as HTTP 200 response, indicating whether a web page was rendered properly to a client. However, what is missing is transaction payload information – that means, it will not be able to show which of these HTTP 200 responses were for pages with a “service unavailable” message. This information is contained in wire data or transaction payload and is not logged by the server. Can you get this from log data – yes, if you instrument the code. And that is the beauty of wire data – it does not require any instrumentation of the application.
With this app users can capture application transaction times, transaction paths, network performance, and even database queries. Correlating wire data with other application and infrastructure data in Splunk software such as logs, metrics and events, As a result users are getting insights about app, service or network availability, performance and usage of their services. IT admins can pinpoint root-cause, proactively monitor the performance and availability of their individual technology silos, map dependencies of infrastructure to applications and trend performance to establish baselines. For security, wire data extends itself into rapid incident investigation. more complete threat detection, expanded monitoring and compliance. For business, wire data also captures user interactions and process insights for a deeper understanding of the user experience to support multiple business analytics use cases.
The Splunk App for stream enables efficient, cloud-ready wire data collection with a single software solution. This provides real-time visibility into any public, private or hybrid cloud infrastructure through insights from wire data. Additionally, customers can now securely decrypt SSL encrypted data for data completeness. Capture only the relevant wire data for analytics, through filters and aggregation rules. The app provides the ability to control and manage wire data volumes with fine-grained precision by selecting or deselecting protocols and associated attributes within the App interface
Lastly, can be rapidly deployed to collect wire data in real time to gain network visibility that is otherwise unavailable from cloud implementations and hard to achieve with traditional datacenters. Now, customers can quickly respond to any issue with a simple interface-driven installation, centralized deployment and configuration across IT environments of all sizes.
So let’s start with IT Operations – You can capture IT relevant data set from network and enrich it with existing data in Splunk such as infrastructure and application logs and events .You capture the content of database queries, granular IP conversations, transaction traces, applications response times. As a result, they will have granular visibility into infrastructure performance, resources utilization, or solve capacity bottlenecks. They can have visibility into applications availability, performance and usage and relation of it to underlying infrastructure components. IT admins can establish better baselines and trending for application performance and usage, and enable better IT and business decision making. This all results in faster resolutions of problems with fewer people.
Stream brings huge benefits for your security practitioners.. It is particularly interesting as you are most likely used to packet sniffing for forensic and real time analysis. Data captured contains all user activity and behavior as well as applications behavior. With Stream security customers can perform deep protocol inspection understanding at a very granular level what is going in. This can be used both in real time to understand risks or to perform response to an incident. In addition, security investigators can observe daily or seasonal traffic patterns so that they can immediately react when these become anomalous– they can respond to insider threats. See when someone is emailing IP out or if someone is trying to mimic the database queries to trying to gain access to your internal databases. Stream extracts both header and payload information for very deep granular insights for incident response and threat prevention. It is very important to mention that it can be deployed anywhere into end points, without you need to buy having to by expensive appliances. Very important when customer is a breach conditions.
Backup
Protocol header and data decoding: HTTP, DNS and email protocols (e.g. IMAP, POP3 and SMTP) are the dominant attack and exfiltration vectors for some of the most damaging breaches. Streams can be deployed to acquire header information (HTTP and email) and payload information (DNS) to drive sophisticated analytics for threat detection, incident response, intelligence gathering and threat prevention.
Rapid deployment and response: When incident investigation or analysis or tracking down malware requires additional real-time information from network traffic, threat responders can leverage Stream’s simple and rapid deployment via Splunk to start getting wire data from the system of interest to Splunk. This is useful under breach conditions – where a known infiltration may be in progress.
In this example, the Stream is deployed in of the large national banks out of Texas. They had acquired branches around the country and in the process integrating them with the hq datacenters. They have several months to do the integration. They are using Stream to better understand the traffic that is going across key links not only within the country but also international. Stream gives them very granular visibilty into any traffic, they can understadn top talkers vs top communicators. They can apply analysis to trigger an alert if the traffic utilization is over specific threshold. And the data is used by new IT personnel. What they are getting from Stream that they cannot get from these other tools Is Splunk analytics behind. With other tools they can get some data but the granularity is not there. And many of the tools don’t look at client perspective.
Example: With Stream and Splunk this customer can perform granular analytics they could not do with other tools. “ With other tools I can look at my conversations or all my bytes coming across are, you know, 50 percent of that is, you know, one host, you have thrown a load on that. I can alert when the bandwidth is 85 percent, right? I can do that all day long with other tools But I can't necessarily go look at the traffic and alert on, "Hey, this is I.P. address is taking all the bandwidth. That and much more I can do with Stream”.
Let me go over Splunk Stream utilization in CanDeal. CanDeal is a Canadian online exchange for Canadian dollar debt securities. They provides their investors access to liquidity for Canadian Government Bonds and money market instruments. Stream is deployed at CanDeal across variety of different use cases – security, IT operations even application development. Their teams can collaborate together at CanDeal – in the past, due to strict restriction to who has access to financial data, developers could not get to production MySQL environment as raw visibility for packet data was something they never had access before. Now security team gives them visibility and they can control and they can access any time without the need to wait which significantly improves turnaround times and visibility into issues. preprod testing can also be quickly done. As a result they have improved collaboration among all different teams. In the past, they spent hours just collecting data, shuttling pcap files which created tremendous lag time.
Customer satisfaction: In real time they can detect proxy issues, SSL mismatching, misconfigured routes,
[Security]Splunk Stream helps Candeal to get huge value in their security practice. They now able to get indicators of compromise by bringing data from STIX into Splunk (utilizing Splice) and cross-correlate against data they are getting from Stream (HTTP, DNS, etc).Since they have a full user and applications behavior, they are now able to quickly investigate and mitigate ATS, analyze potential data exfiltration and other risks in their environment. In the past it was very hard and time consuming to grab data from various pcap and it was fragmented and further it was not indexed in Splunk.
[Executive] They are able to create executive reports and present to executives which they could not do with tools they had in practice in the past.
This is a customer from one of the banking institutions in US. They have deployed Stream to monitor data on DMZ and on egress at the points where there is visibility across all the traffic. They wanted to simplify the data collection for forensics purposes. They did not want to search multiple tools to get the data they are looking for. The value for Stream is how fast can they resolve and close security cases. They got Stream because they wanted to get to the so called “higher level” data. For example, logs from firewalls offered them a very basic info example such as this user tried to connect to this or that external website or that external user wanted to connect to this resource from the outside. They get IP destination port and that is it. From Stream we are getting better understanding of the traffic. Now they can answer these question: This user from the outside tried to issue an SQL injection. Once they have the IP address from firewall they can search the Stream and they can get the better view of what the user did. [The way they did it before was to get the pcap from the user based on the firewall log IP information. Now they don’t need to go and get the pcap to get into very minor detail. We can just look into Splunk and see that is actually what happened.] They are looking into lots of things from their IDS including alerts and things . SQL injection, exploit attempt, etc. If it is something new, we go and check Stream out for more details.
Before Stream one example would be as we would be going into IDS alert and bring that into a pcap and then look at pcap into another tool to see what happened, it would take me an hour. With Stream, if get data, enter source and destination IP the get this instantly. Then they can further determine whether I need to investigate more or not. With Stream it goes down to 5 min which is 90% reduction. It is much easier to get data now. ”
For them the ability to look at meta data for HTTP level data, and see the things such as the user agent, the response is valuable and very useful for someone in security domain
Here is the current list of protocols that are supported. We also now support Windows OS and also have improved performance. Here we see currently supported protocols and platforms. Talk with your customers and them if there is any other protocol they find extremely useful that they would like to be added. And also ask them why would need particular protocol to be added.
We can get wire data directly from the “wire” by installing our wire data collector (the TA) on a dedicated, physical server. This server then receives a passive network copy from a SPAN/(TAP) or packet broker which would transport the “real” wire data of interest to the software.
Alternatively, the data collector can live directly on the systems of interest as a lightweight agent, where the systems can be either physical or virtual. In both cases the data collectors are actually TAs and therefore need to cohabitate with a forwarder.
There are specific challenges in managing mobile apps which are different than traditional applications. Traditional apps are delivered to the user over a browser, and most of the magic is happening with the web, application and database servers. For mobile apps it is different: There are variety of form factors, tablets, smart phones, etc., and you have multiple OSs and interaction styles.
Mobile apps often have large number of releases in production. If you multiply the number of handset types by OS by specific versions of applications based on when users last updated them, there’s a huge number for mutations of potential mobile app clients to account for. Mobile operation, app owners, and mobile developers need to be able to determine if a certain application experience is unique to a particular release of the app.
Second, mobile apps are leaner, they’re easier to develop, and through “app stores” it is easy to push out new updates to users. But with every change, there’s risk of errors and issues that weren’t caught in development. Developers need to immediately know what went wrong so they can push better code in the next rev of an app. They have short window to make changes and fixes.
Third, unlike most enterprise apps, mobile devices and apps don’t generate a log file. As a result, if you want information about errors, exceptions, and so on, you have to instrument mobile apps with an SDK, identify what you want to measure, and where to send that information to.
Since app owners and developers are preoccupied with the first three areas I just mentioned, they are lacking analytics that would give them insights into feature usage and user behavior. Also, the experience that mobile apps provide needs to be correlated and compared with other application channels. Not only that, it’s important to understand how mobile applications influence application infrastructures for capacity planning and other reasons.
Mobile initiatives are new, and there’s no consistent model we’ve seen so far and how it’s organized. But we do find three kinds of stakeholders responsible for better mobile Operational Intelligence. App Operations, as the people who first get frustrated calls from end users, need to better isolate what’s going on and perform basic triage. App Developers need to understand the source of application crashes so they can quickly push better releases out to mobile users. Application Owners know that persistent problems will mean people abandon their app, so they want to know how people are using the application what experience they are receiving.
To address the needs of developers, operations and product management, you need Operational Intelligence for your mobile apps. This is what we call mobile intelligence. Mobile intelligence provides real-time insight on how your mobile apps are performing, and can correlate with and enhance Operational Intelligence.
Splunk software enables organizations to search, monitor, analyze and visualize machine-generated data from websites, applications, servers, networks, sensors and mobile devices. Splunk MINT helps organizations monitor mobile app usage and performance, gain deep visibility into mobile app transactions and accelerate development
Deliver better performing, more reliable apps
When a user has a problem with a mobile app, the issue could be isolated or spread across all app versions, handsets and OS types. With Splunk MINT, you can see issues with app performance or availability in real time. Bugs can be addressed quickly, and app developers can gain a head start in creating and delivering valuable app updates.
Achieve End-to-End visibility
When mobile apps fail, there are many potential sources of failure. With Splunk MINT, you can analyze overall transaction performance. And using Splunk MINT, you can correlate this data with information from back-end apps to gain detailed insight on transaction problems. As a result, operations can reduce MTTR and better anticipate future mobile app back-end requirements.
Deliver real-time analytics
Mobile apps give enterprises new ways of conducting digital business. With mobile app information in Splunk Enterprise, you can correlate usage and performance information— some call this omni-channel analytics—to better understand how users are engaging all aspects of your organization.
Unlike backend systems whose operational metrics are easily accessible, mobile applications require us to gain insight from all the mobile end points that use the app. There are three major components that make this work
First, mobile app developers embed Splunk MINT SDKs into the mobile apps they track. They can get the SDKs at mint.splunk.com. For basic app crash, performance, and user session insights, this requires as little as one line of code, which is well documented on mint.splunk.com. Once they redeploy their Splunk MINT apps, they are off and running.
Once applications are in production, information is automatically gathered and sent from each mobile endpoint to the Splunk MINT Data Collector. This information is encrypted, so there’s low security risk. Also, there is very low bandwidth and overhead required on the mobile endpoints to make this happen.
Information moves from this data collector to the customers instance of Splunk enterprise, thanks to a Splunk add-on. That is enabled with a token that uniquely identifies their information. Information transfer between the Splunk MINT data collector in each customers instances Splun kenterprise is secured with the public key.
Once that information is in Splunk Enterprise, you can search, correlate, and analyze your mobile data. Also with the Splunk MINT app, you get a range of dashboards, over 40 reports, and a data model that helps you accelerate searches and correlations.
Now let’s talk about how Splunk MINT enables better performing, more reliable apps…
First, Splunk MINT captures information about the app crashes in real time, and provide that information back to you. Additionally, information on performance bottlenecks, Such as those that are caused by a slow API can be identified and visualized..
What makes this valuable is that this information is all being done in real time. Before Splunk MINT, developers had to rely on belated reports from iTunes, Google Play, etc. By the time they got notification of poorly performing apps , many people have abandoned the app, rated it poorly, and so on. With Splunk MINT, developers will get this information in a matter of seconds.
That’s most important, you can use Splunk MINT to correlate data from your mobile intelligence source type with other source types. Not only does this give you the ability to create a transaction analysis that is inclusive of the mobile app, it also allows you to start to think omni-channel – how the mobile experience is compared to and add value to other channels your organization is using.
Splunk Enterprise allows additional ways of visualizing your information. One great example of this is using geolocation information to get better insight on where mobile users are using your applications from, what you can see here.
Additionally, information on network performance is more granular. You can create dashboards that compare network performance by different mobile carriers, and you can also get more detailed information on user sessions.
Getting Splunk MINT up and running is rather straightforward, but does require action from both mobile developers as well as the person responsible for the Splunk deployment.
Mobile developers have a few key steps to follow. First, they go to mint.splunk.com and sign-up. This takes as little as two minutes, and give them access to SDKs and other resources required to easily integrate the SDKs into their mobile apps. Once they have embedded the Splunk MINT SDKs into their mobile apps, they redeploy the apps, and can quickly check to ensure mobile Operational Intelligence data coming in by checking the Splunk MINT Management Console.
Splunk administrators connect mobile data with their implementation of Splunk in a few easy steps. First, they download the Splunk MINT app and get a token from their sales person/fulfillment team that uniquely identifies them to the Splunk Data Collector. Then run the connection wizard (part of the app) and provide that token. Mobile data starts coming to that instance of Splunk – securely via PKI.
Across stakeholders, MINT provides tremendous benefits. For the mobile app developers, they are able to build better performing before reliable apps by getting immediate insights into performance and availability. They also know how their applications are being used, and can apply that information in subsequent releases.
Application operations benefit from MINT through immediate awareness at mobile app failures. They can quickly identify the source of issues, engaging the right organization so MTTR is decreased. Additionally, operations can better plan for Mobile growth I spotting usage patterns.
Product managers and business owners can benefit getting better insights into user behavior. Additionally, they can begin to think omni-channel of a better understanding mobile apps are used, and how they are used in context of non-mobile channels.
Thank you. Open up for Questions
First Splunk App for Stream is a way of get wire data into Splunk Enterprise. By adding this comprehensive source of machine data, it enables you to extend Operational Intelligence use cases across IT security and the business. It is a software only solution with the ability that can be installed on VM on any host, it enables real-time insights into multi-cloud environments. And as such, it is easy to install anywhere on most of standard machines, it is a passive very efficient way to capture data.
And finally, I would like to encourage all of you to attend our user conference in September.
The energy level and passion that our customers bring to this event is simply electrifying.
Combined with inspirational keynotes and 150+ breakout session across all areas of operational intelligence,
It is simply the best forum to bring our Splunk community together, to learn about new and advanced Splunk offerings, and most of all to learn from one another.