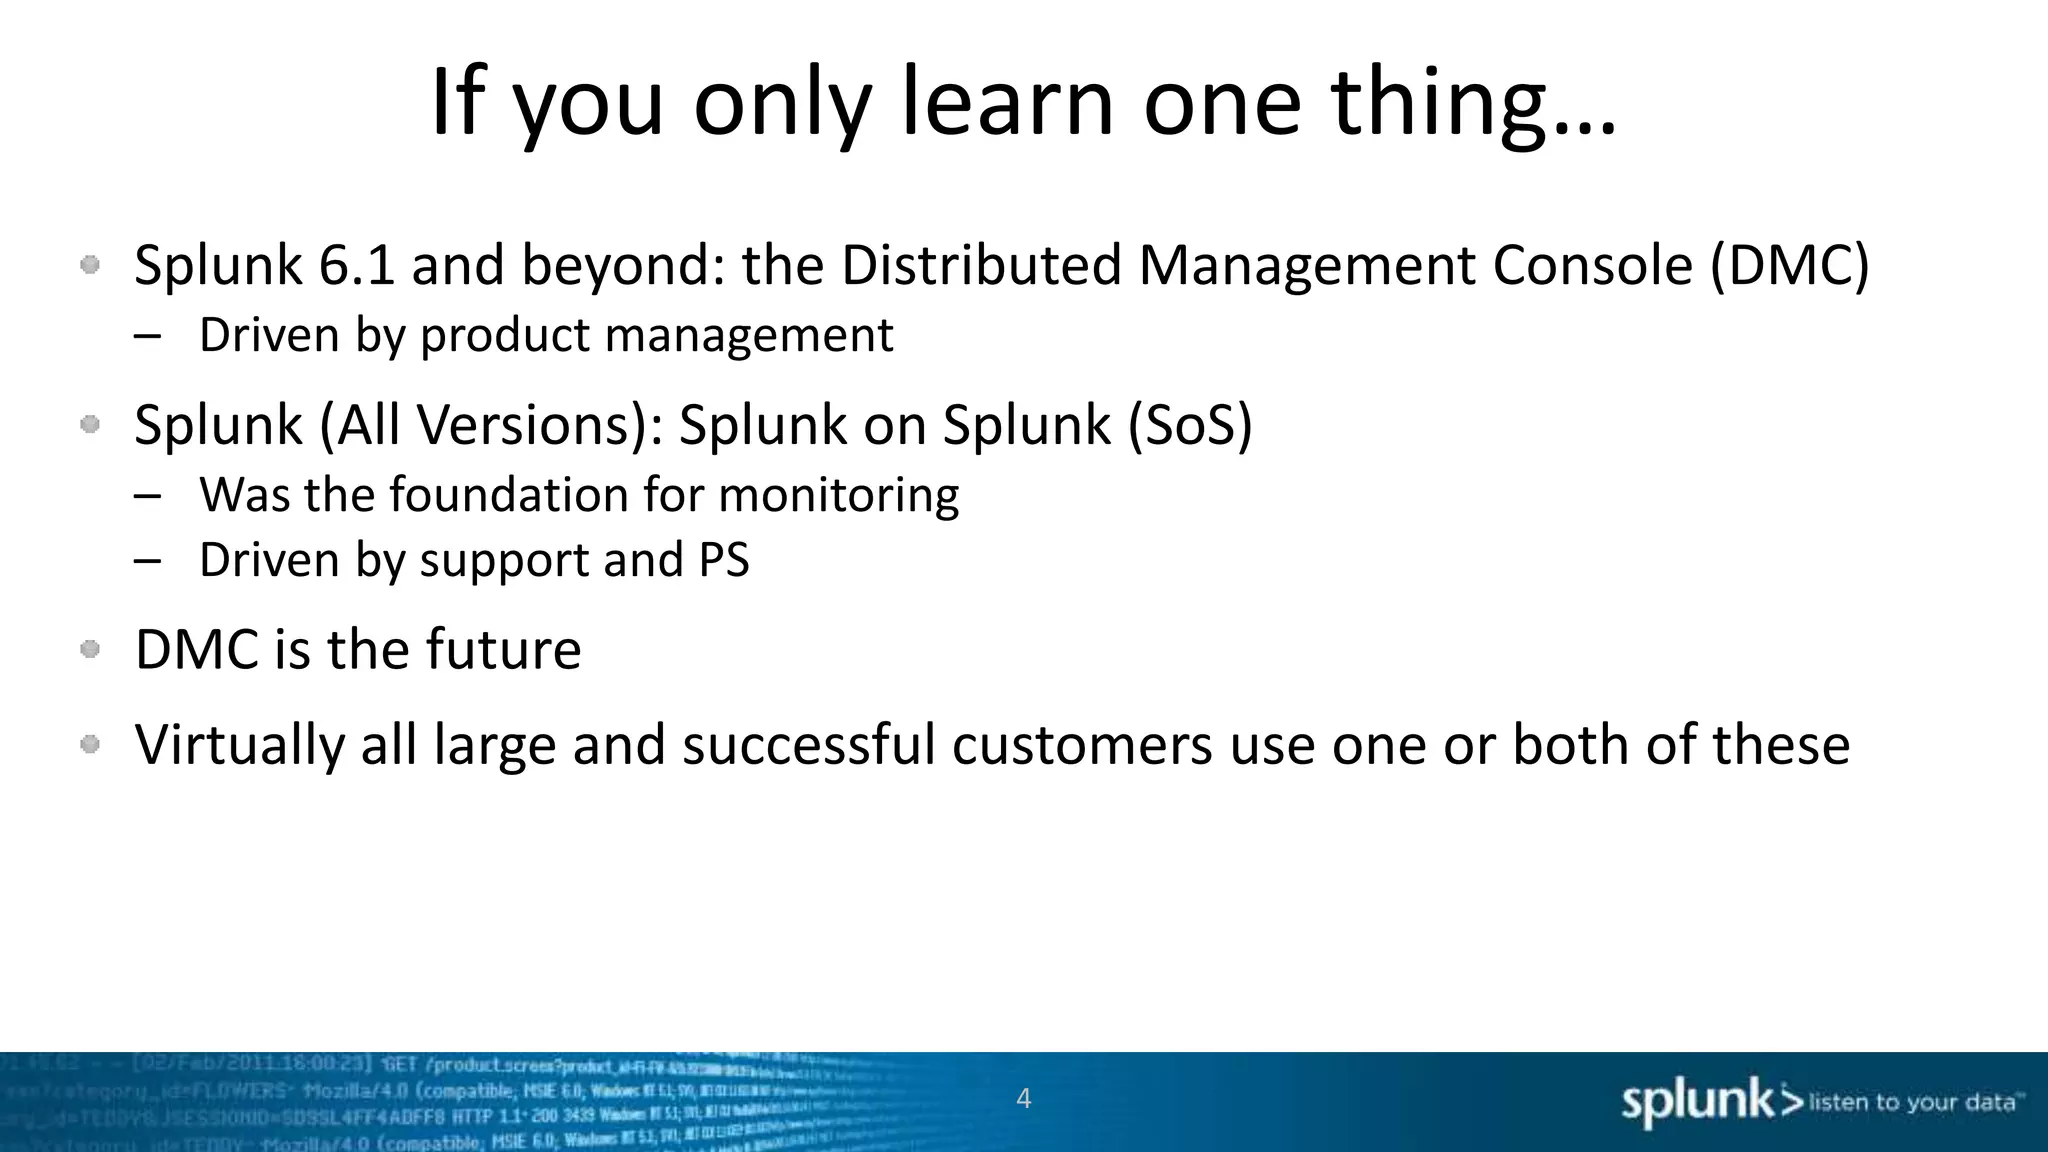
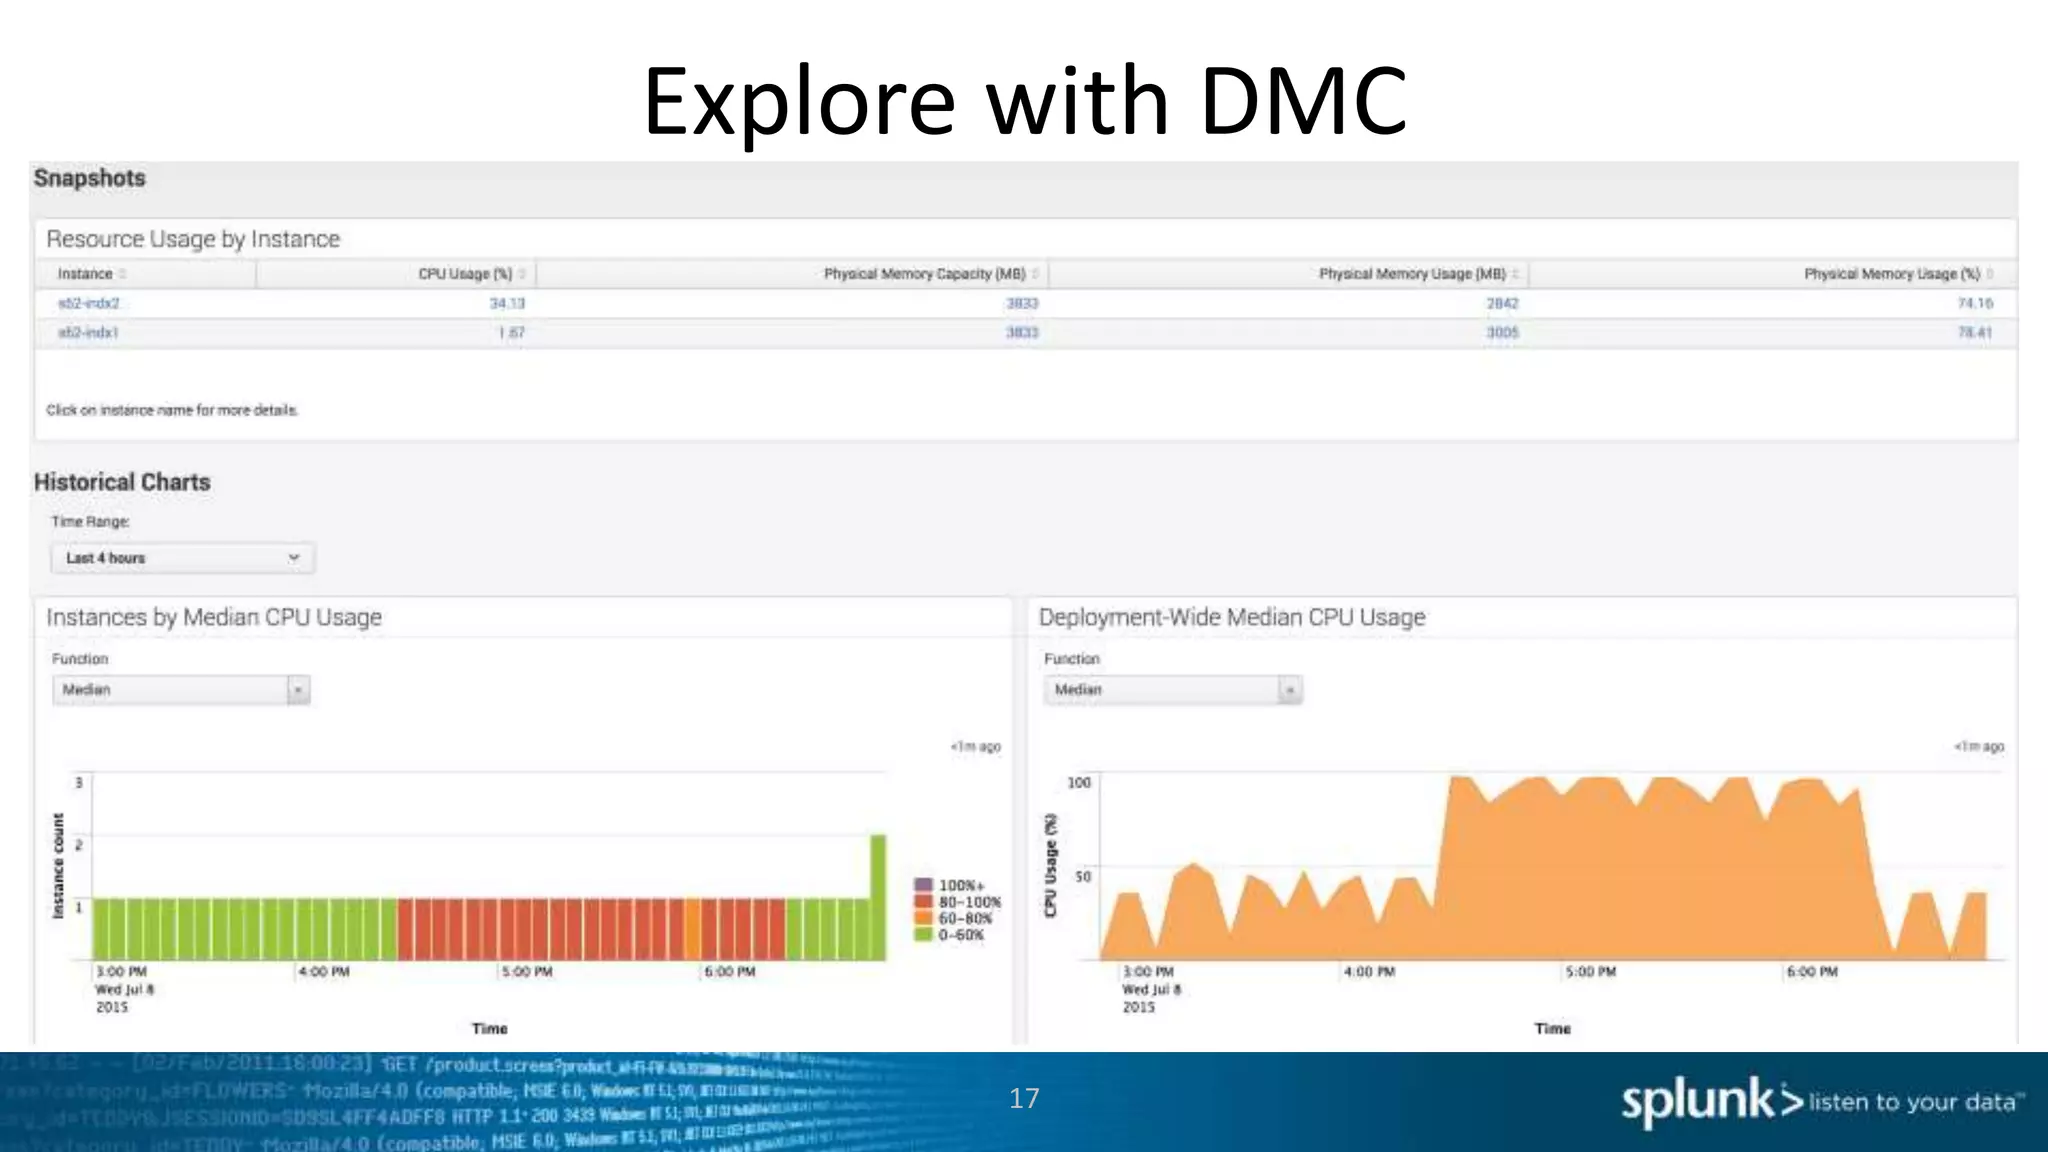
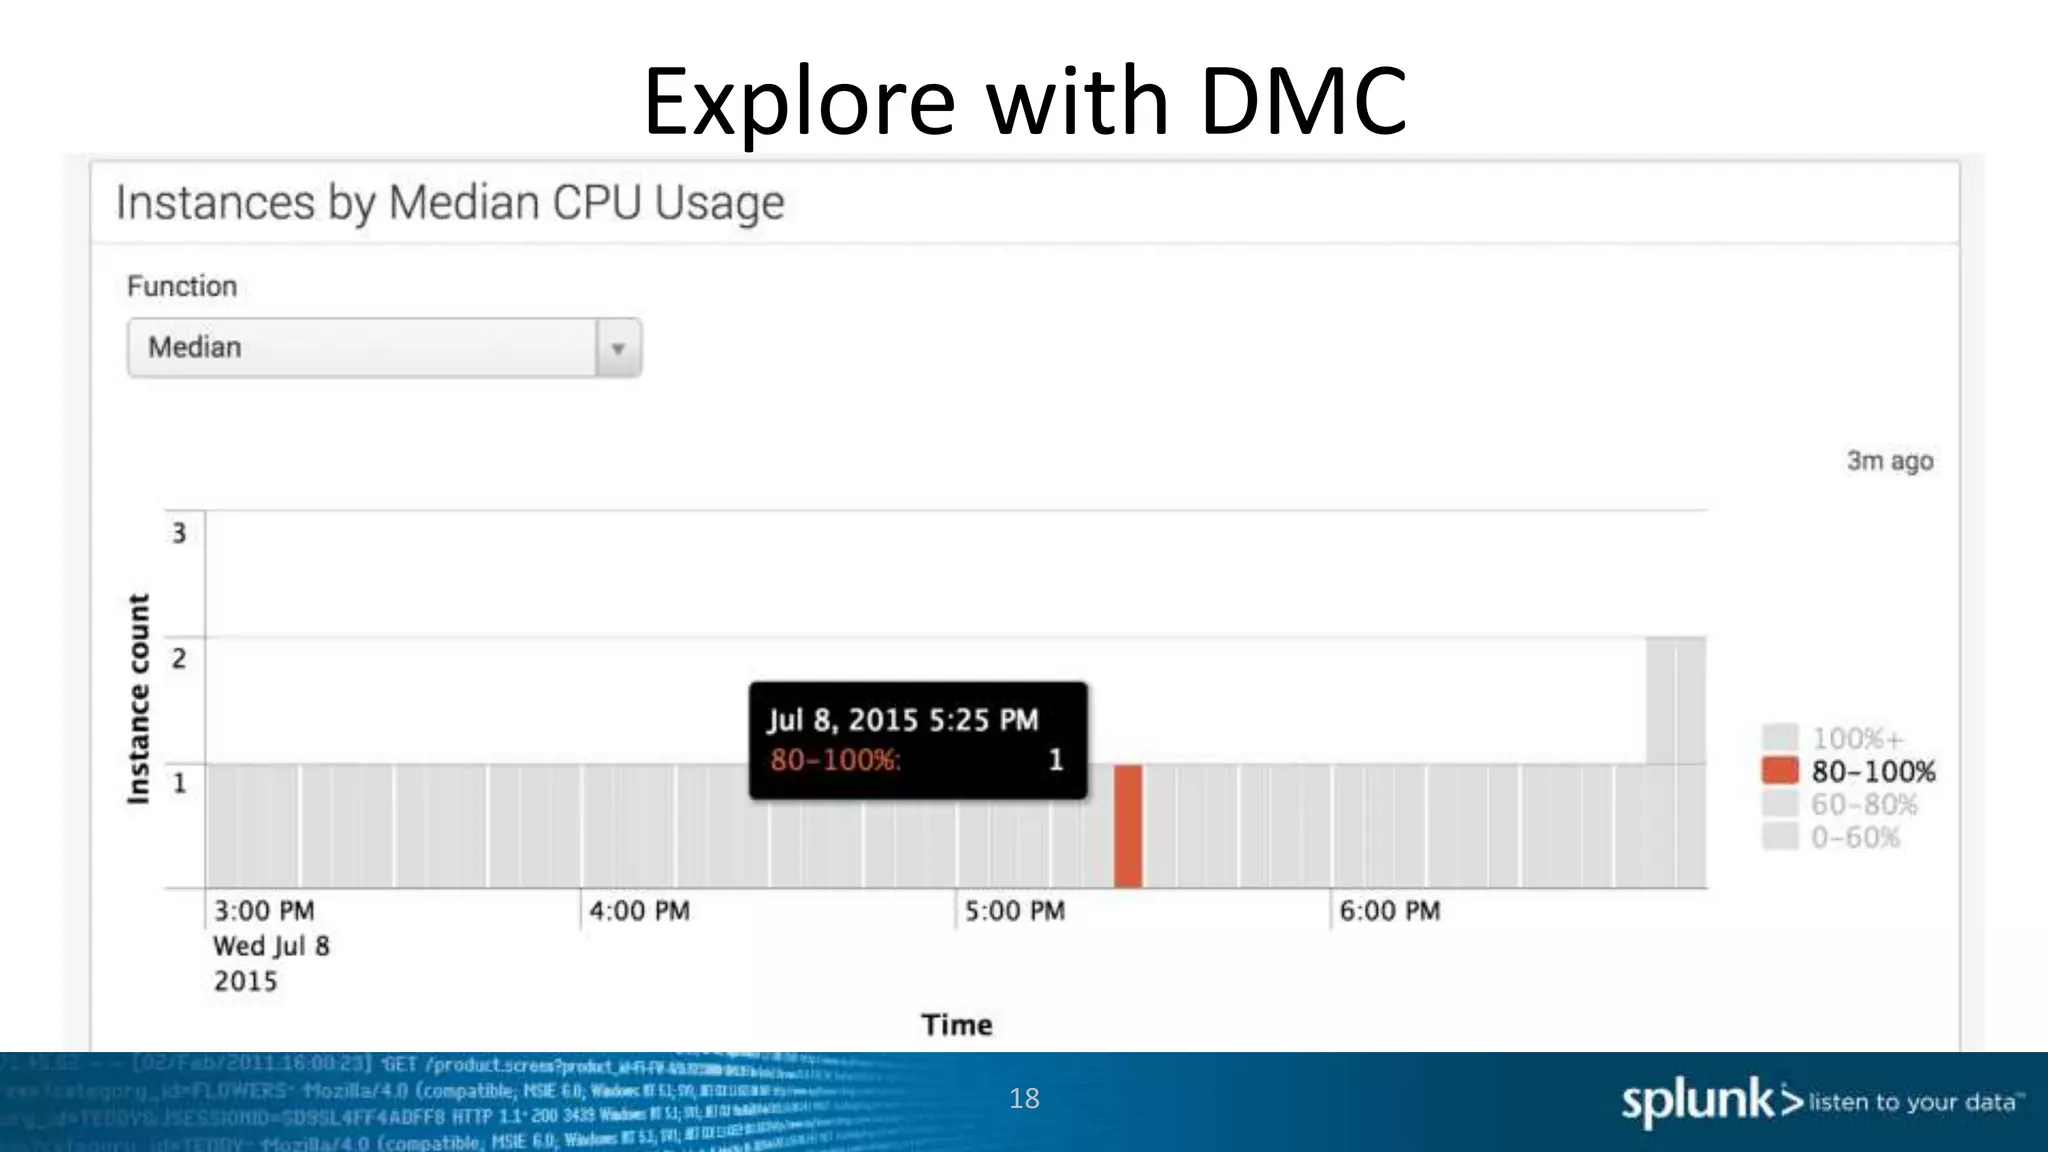
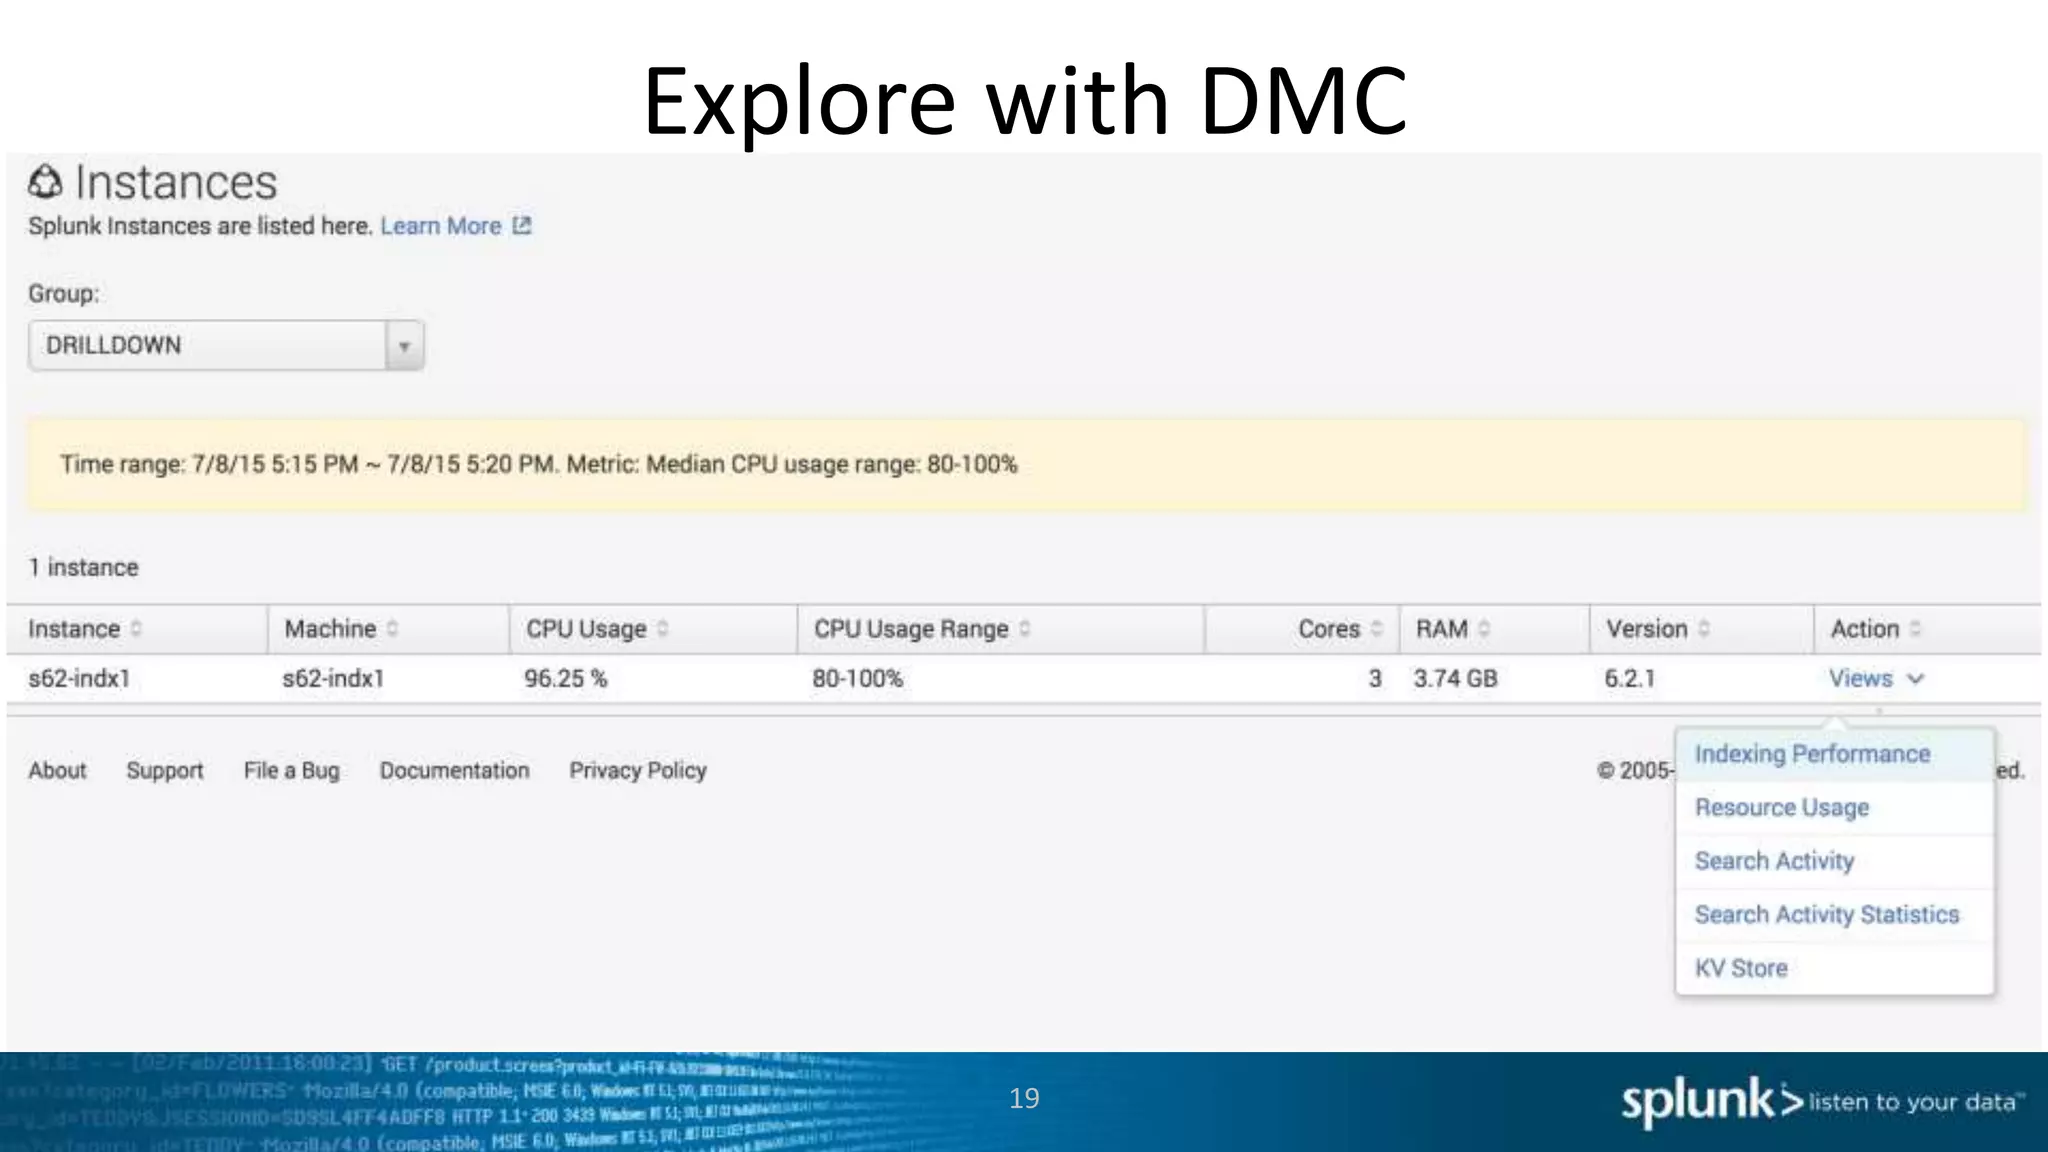
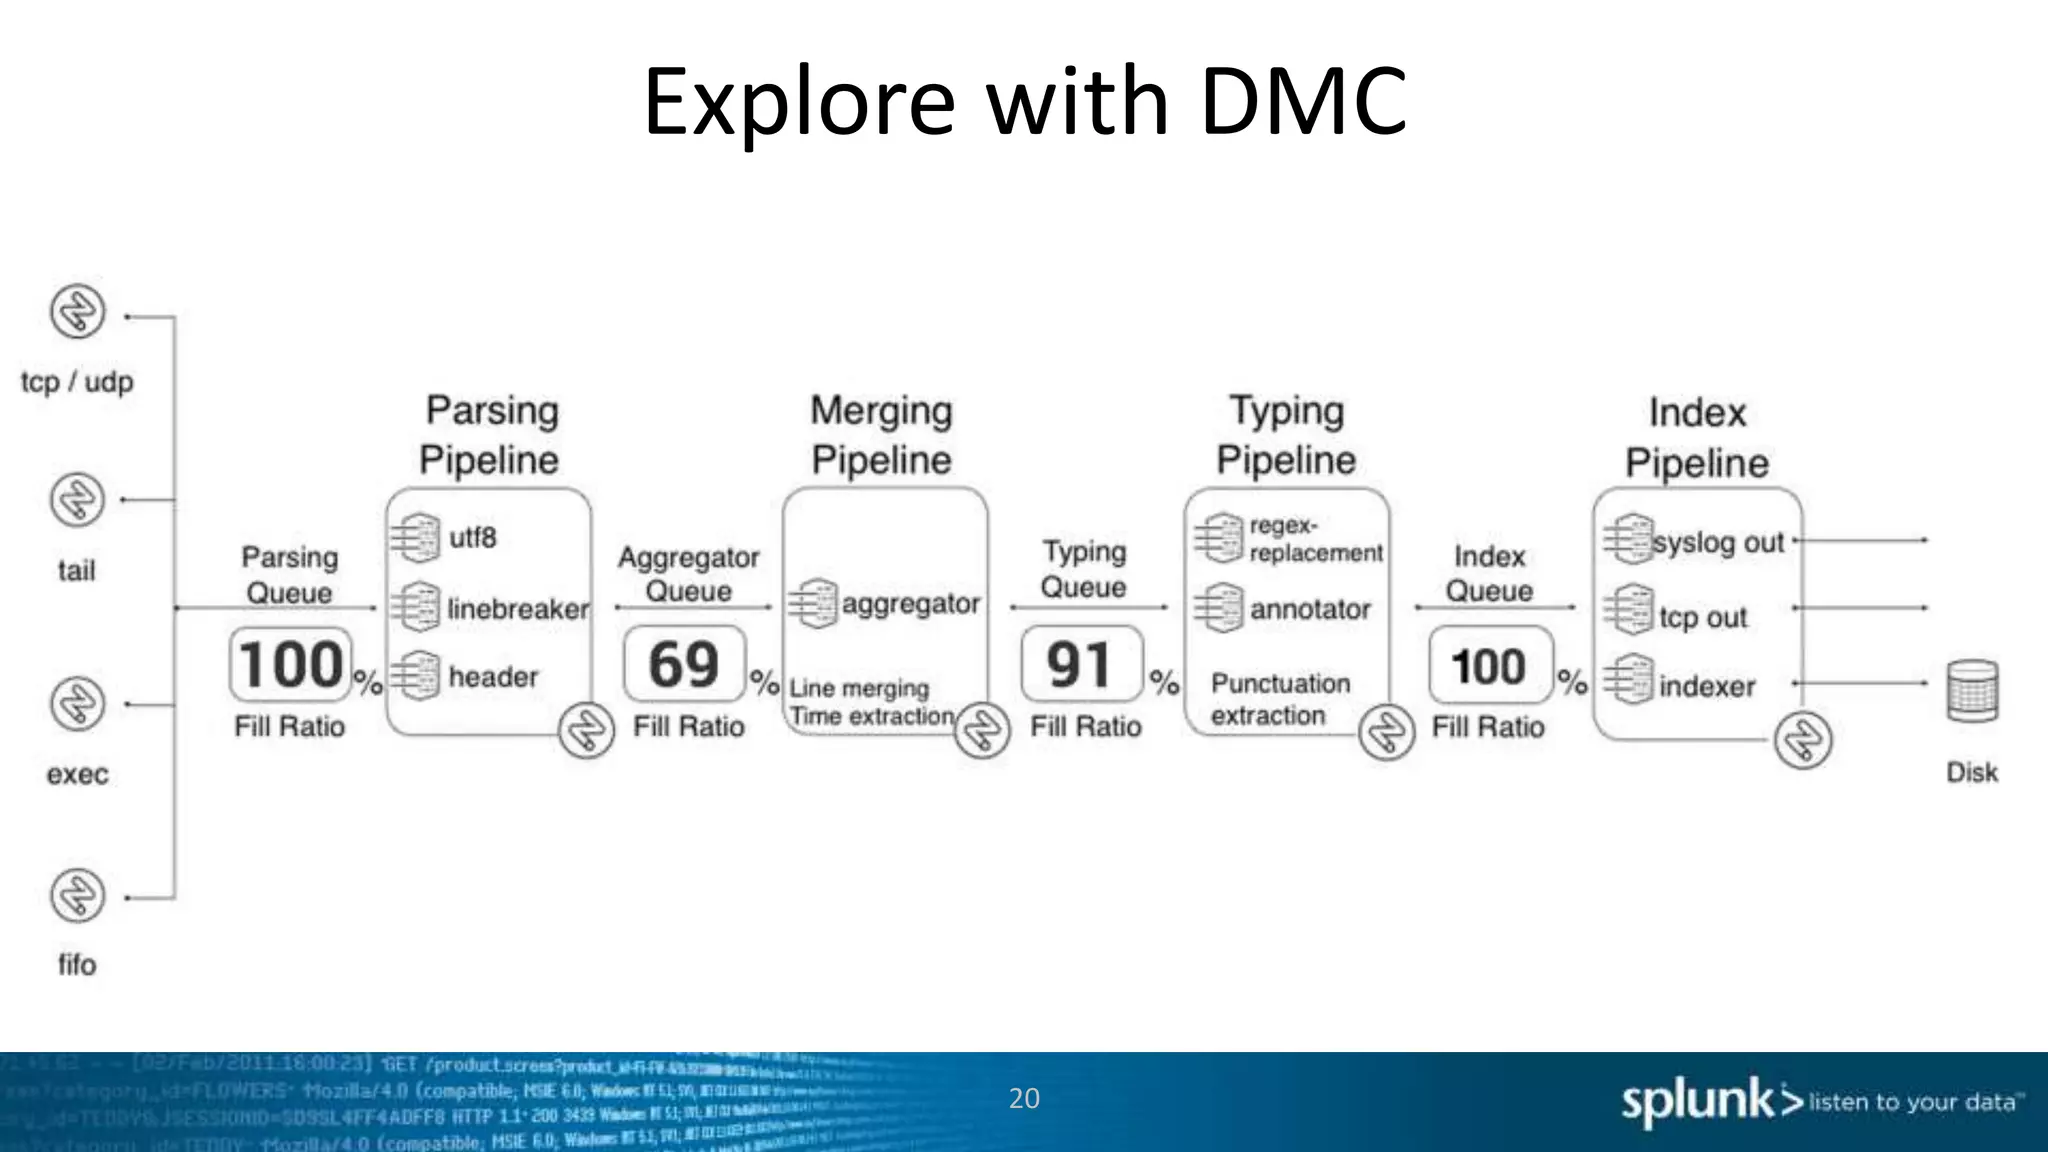
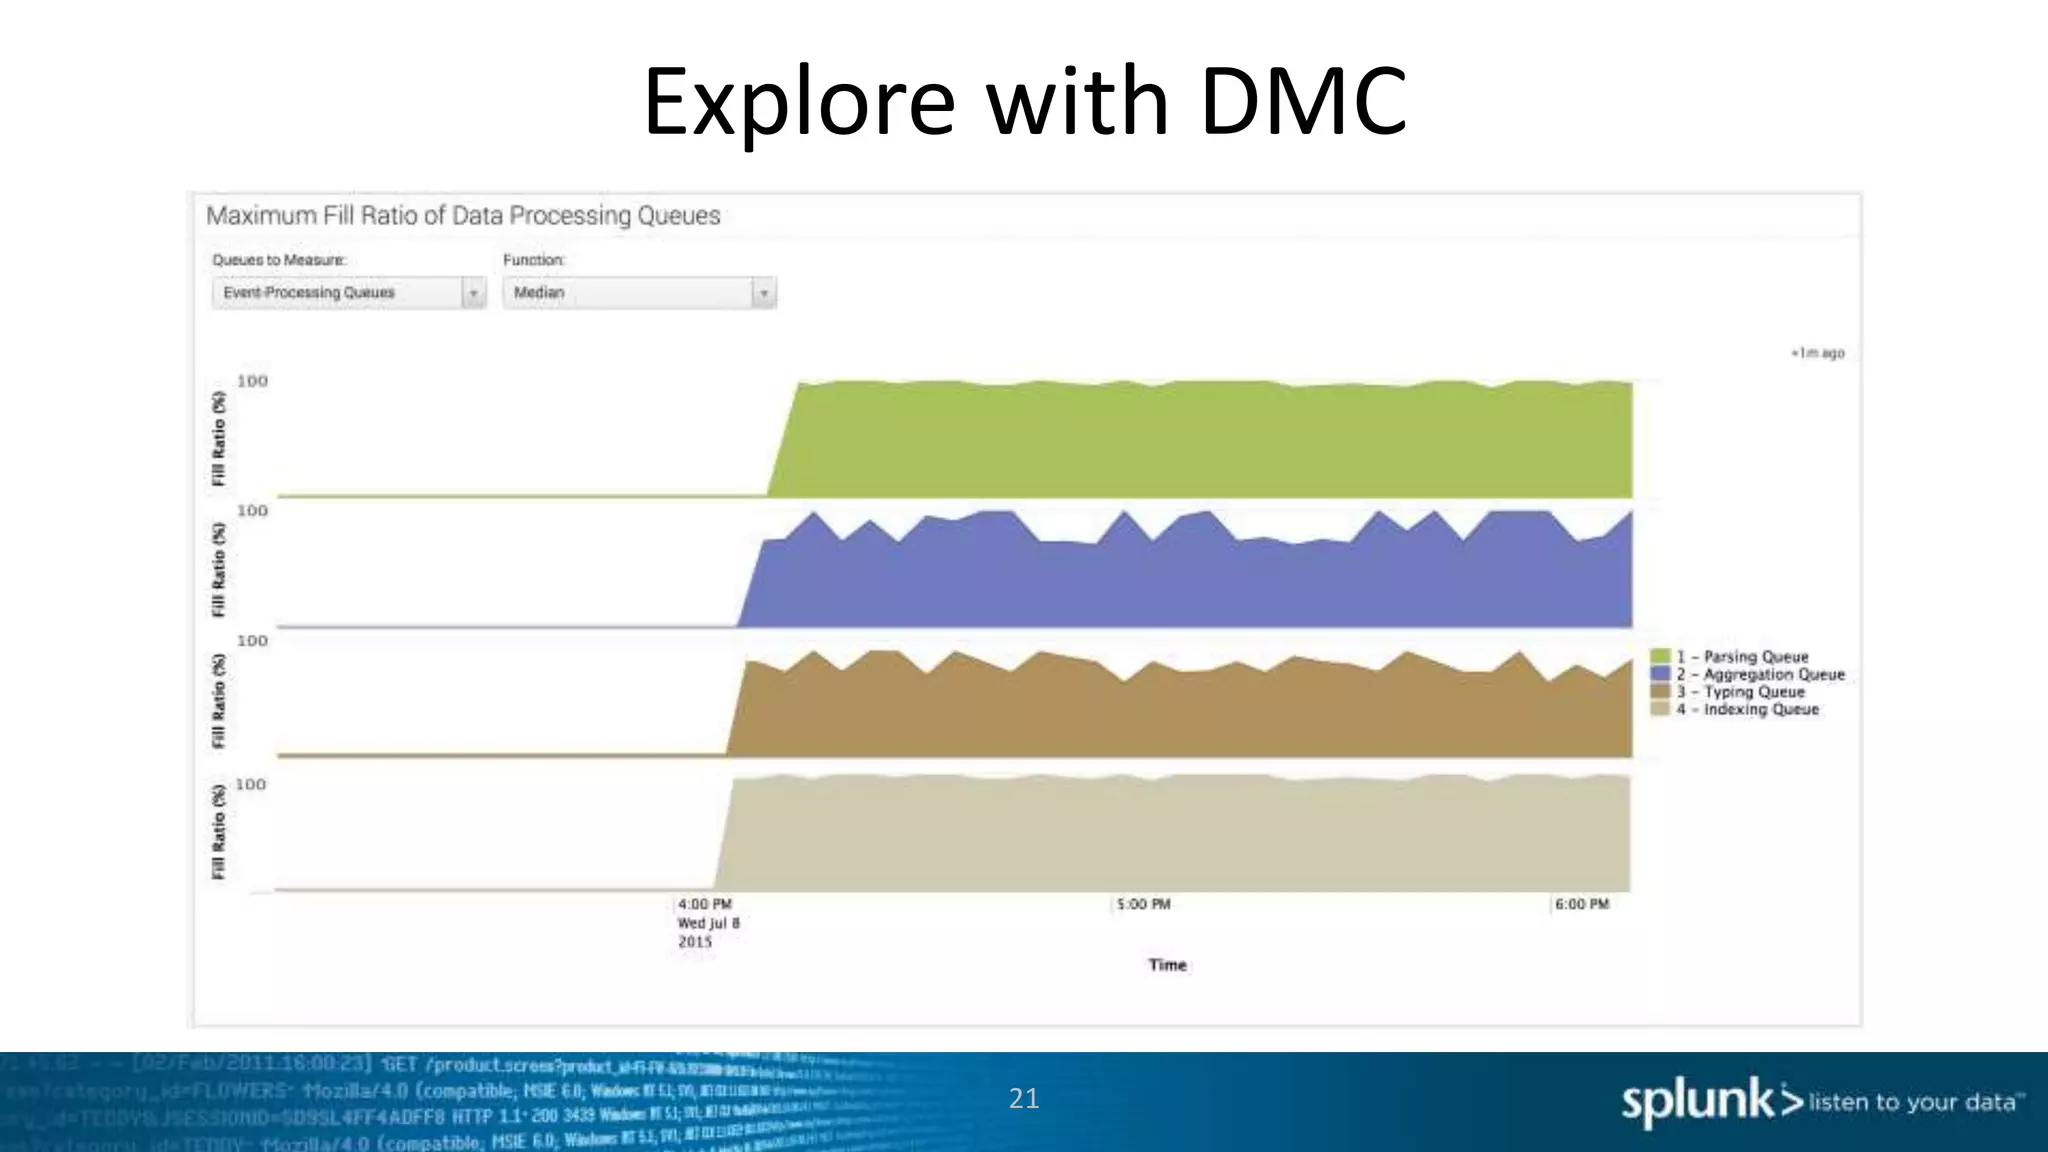
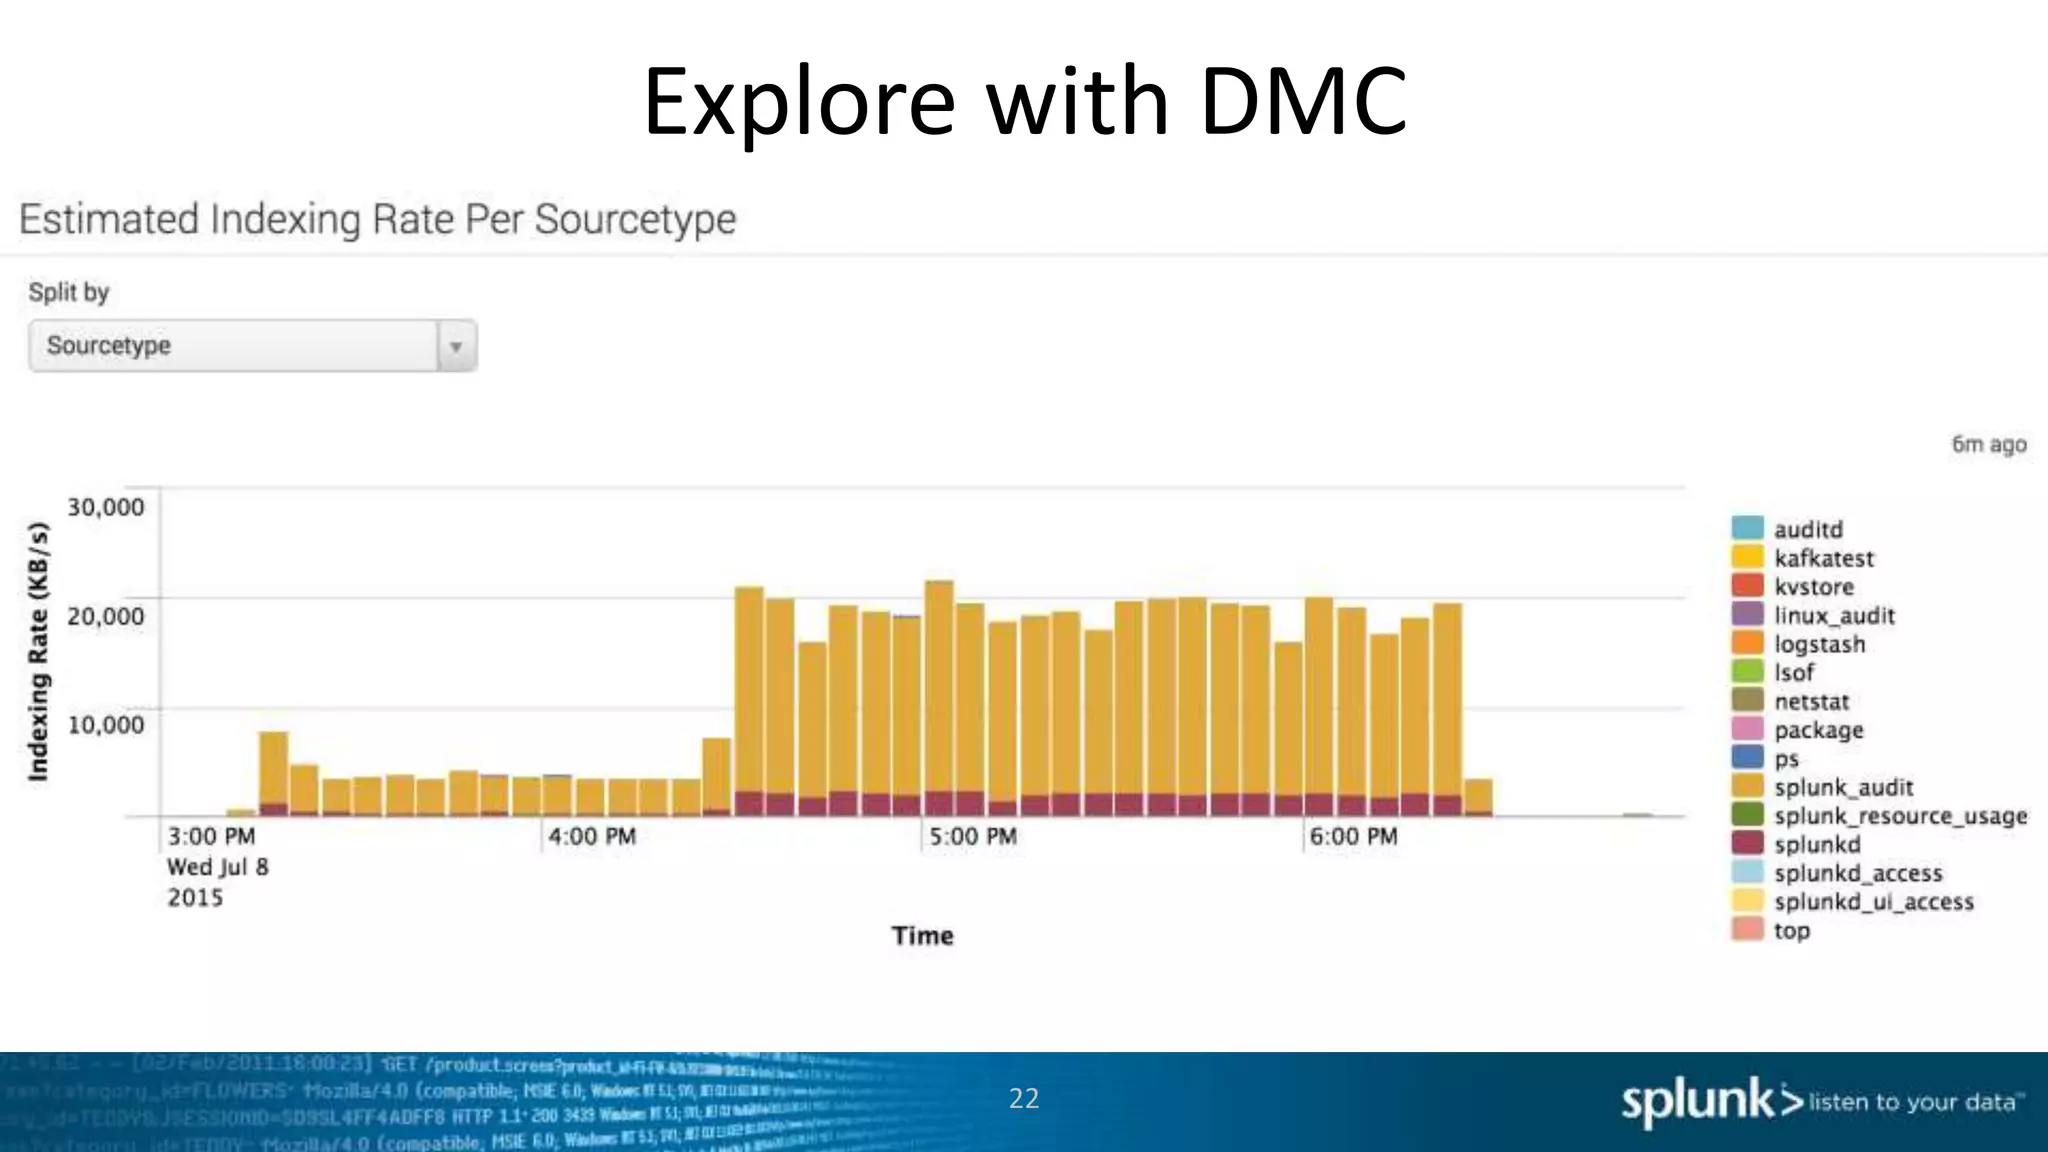
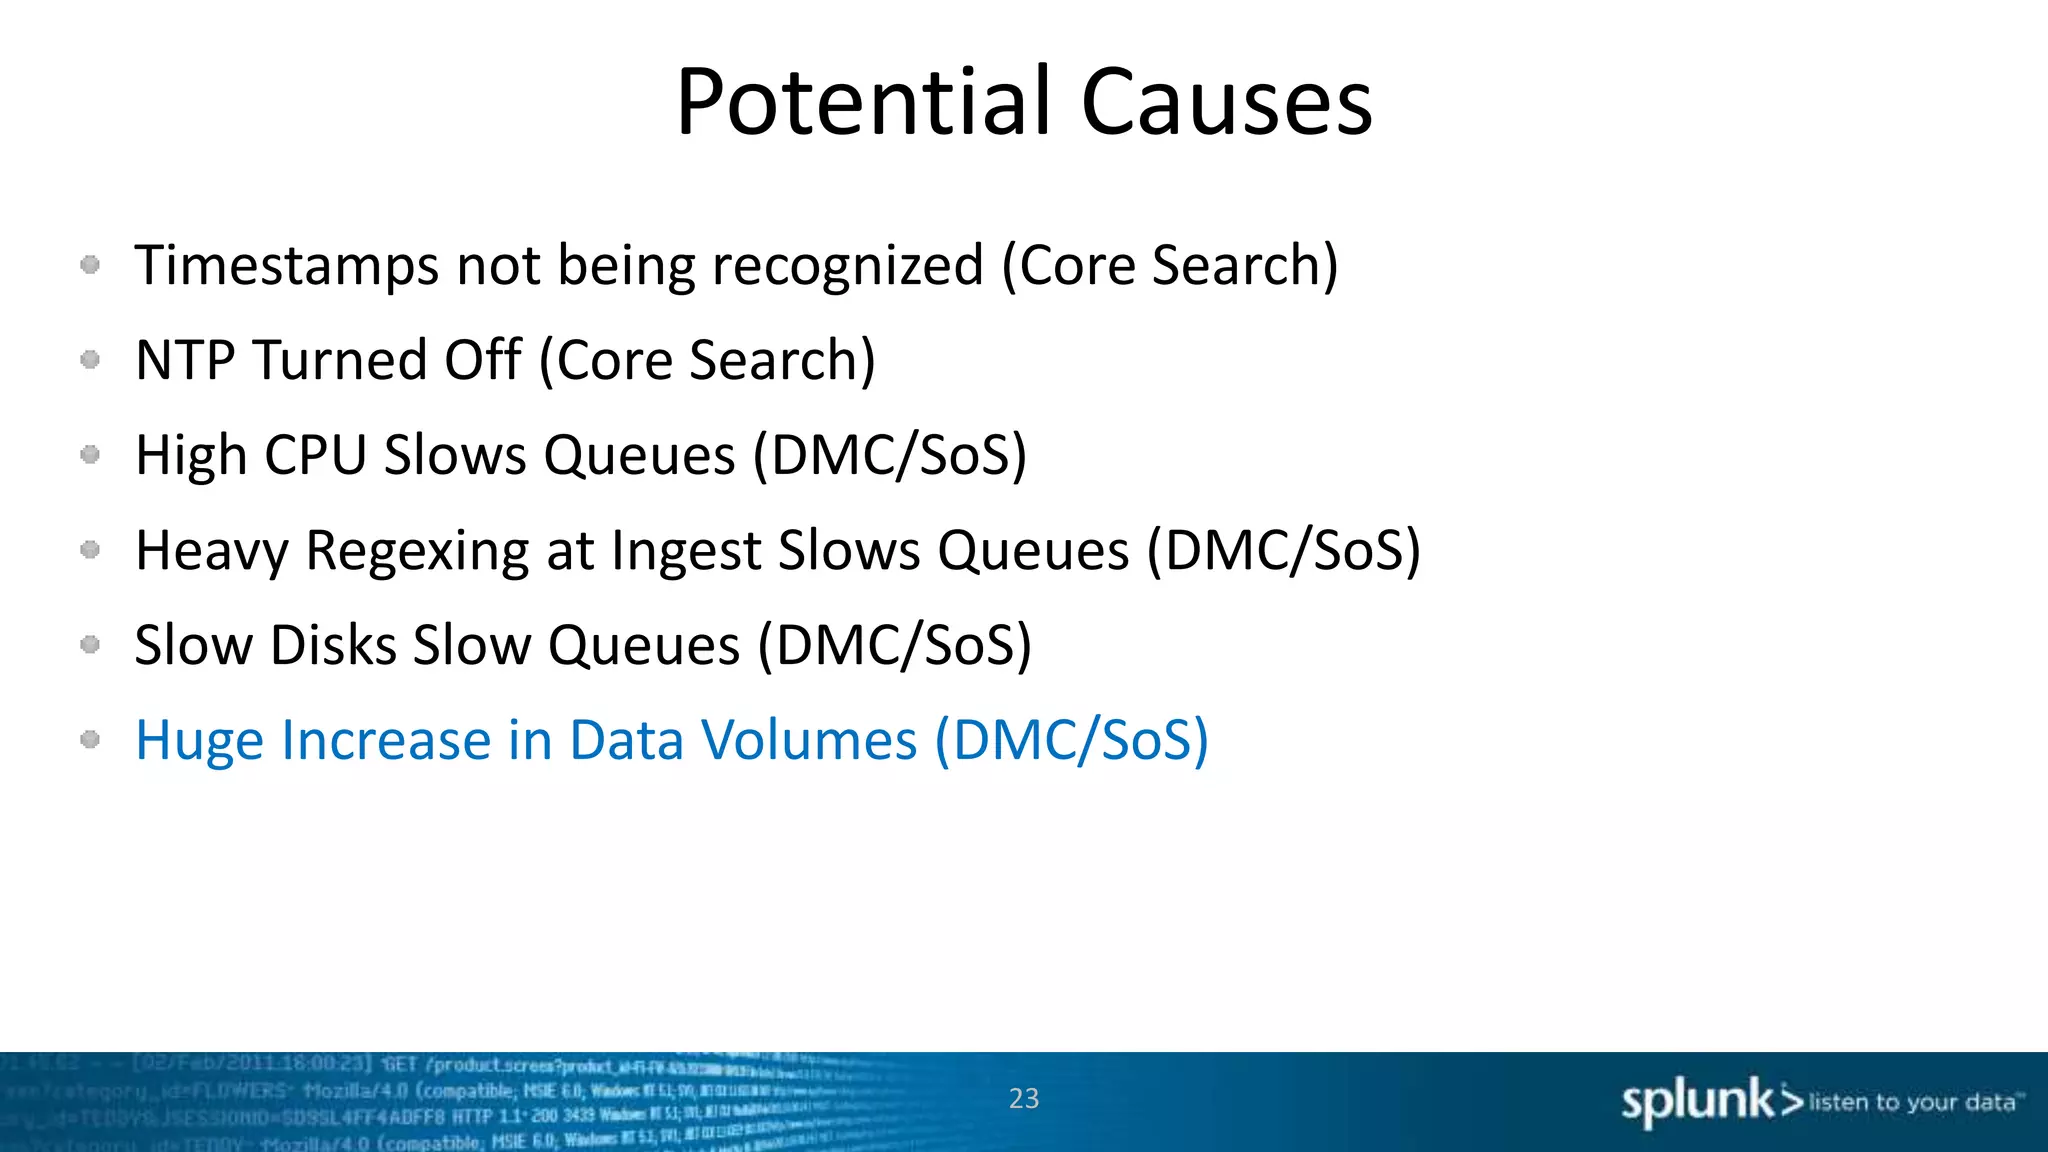
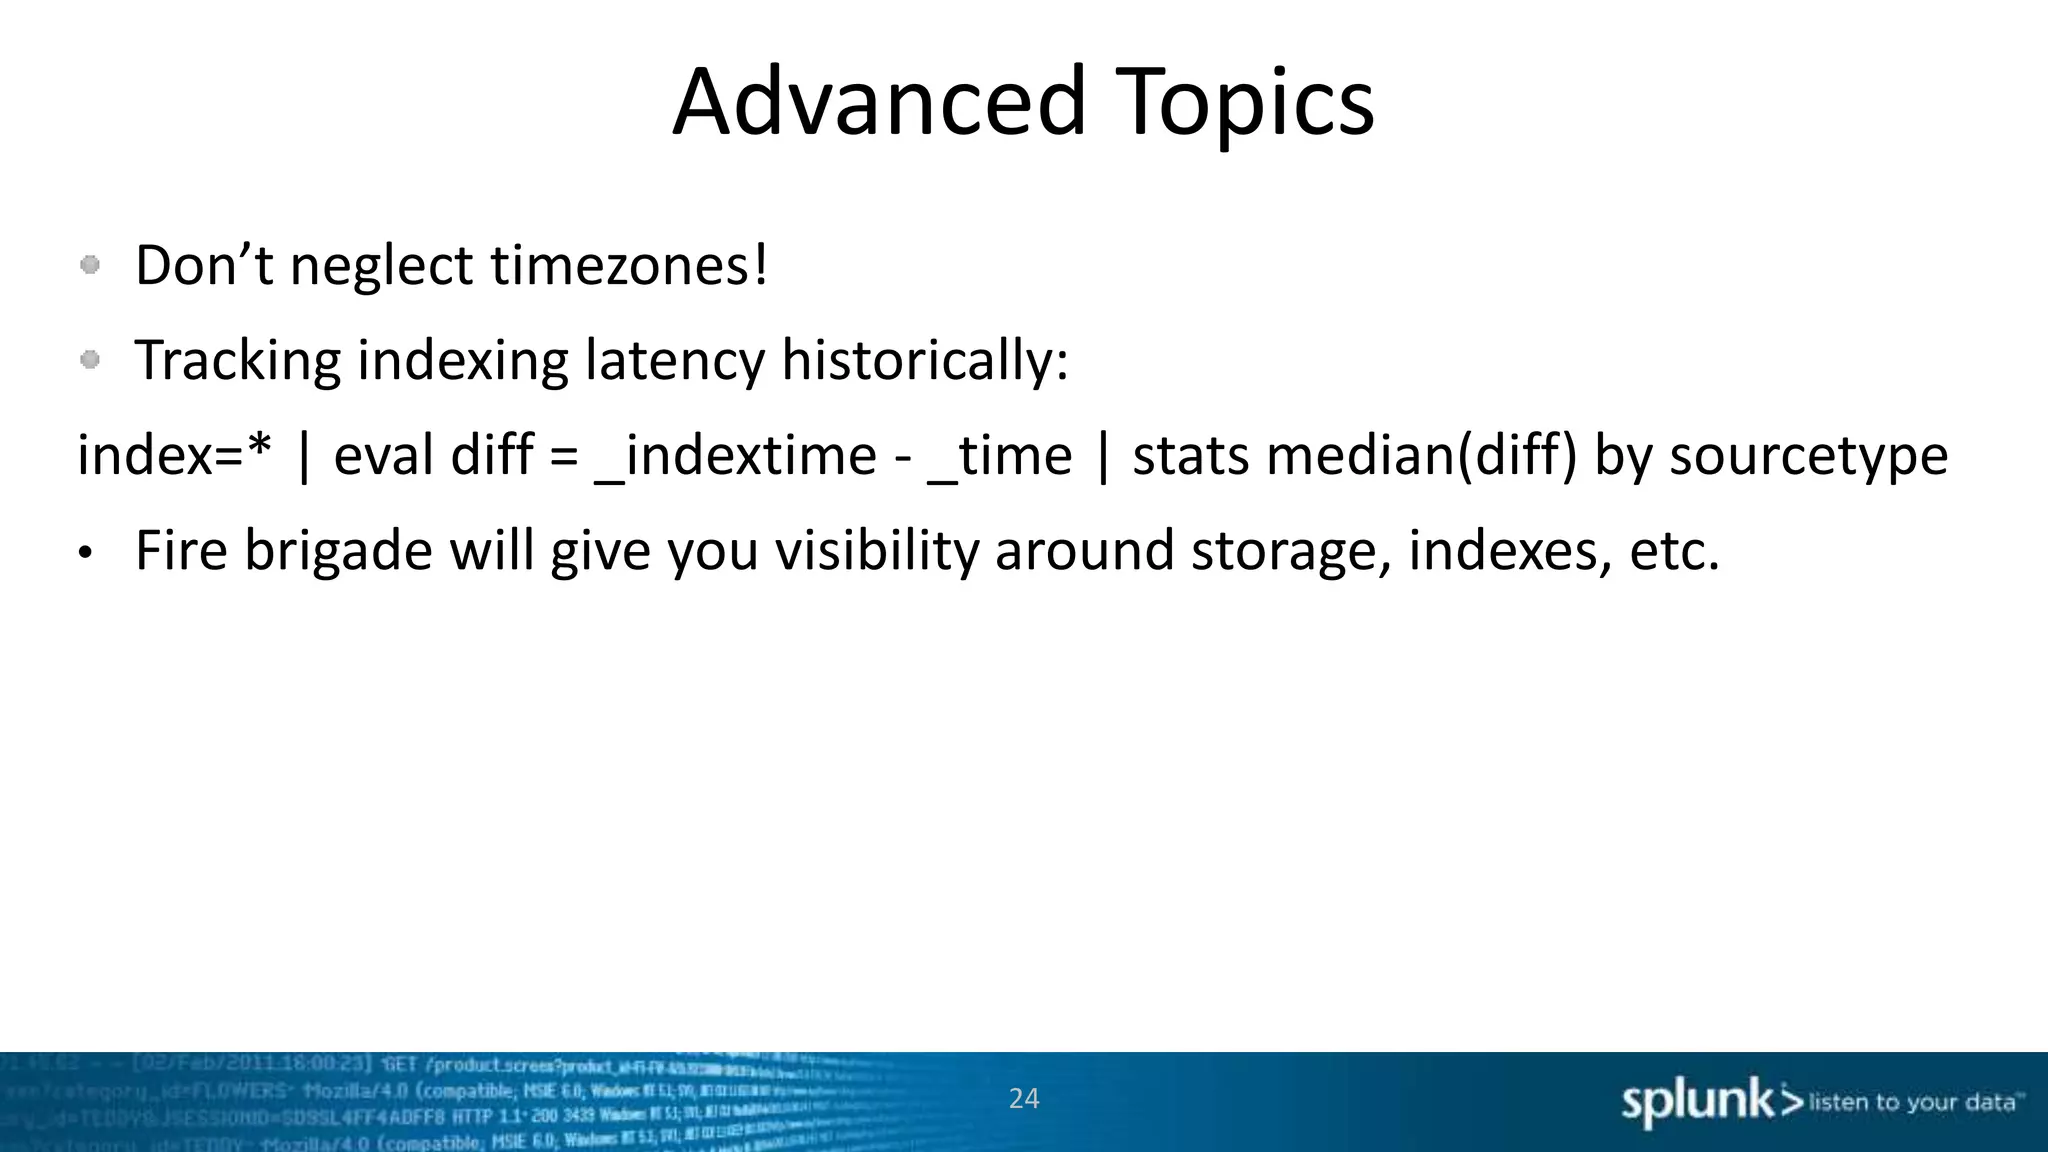
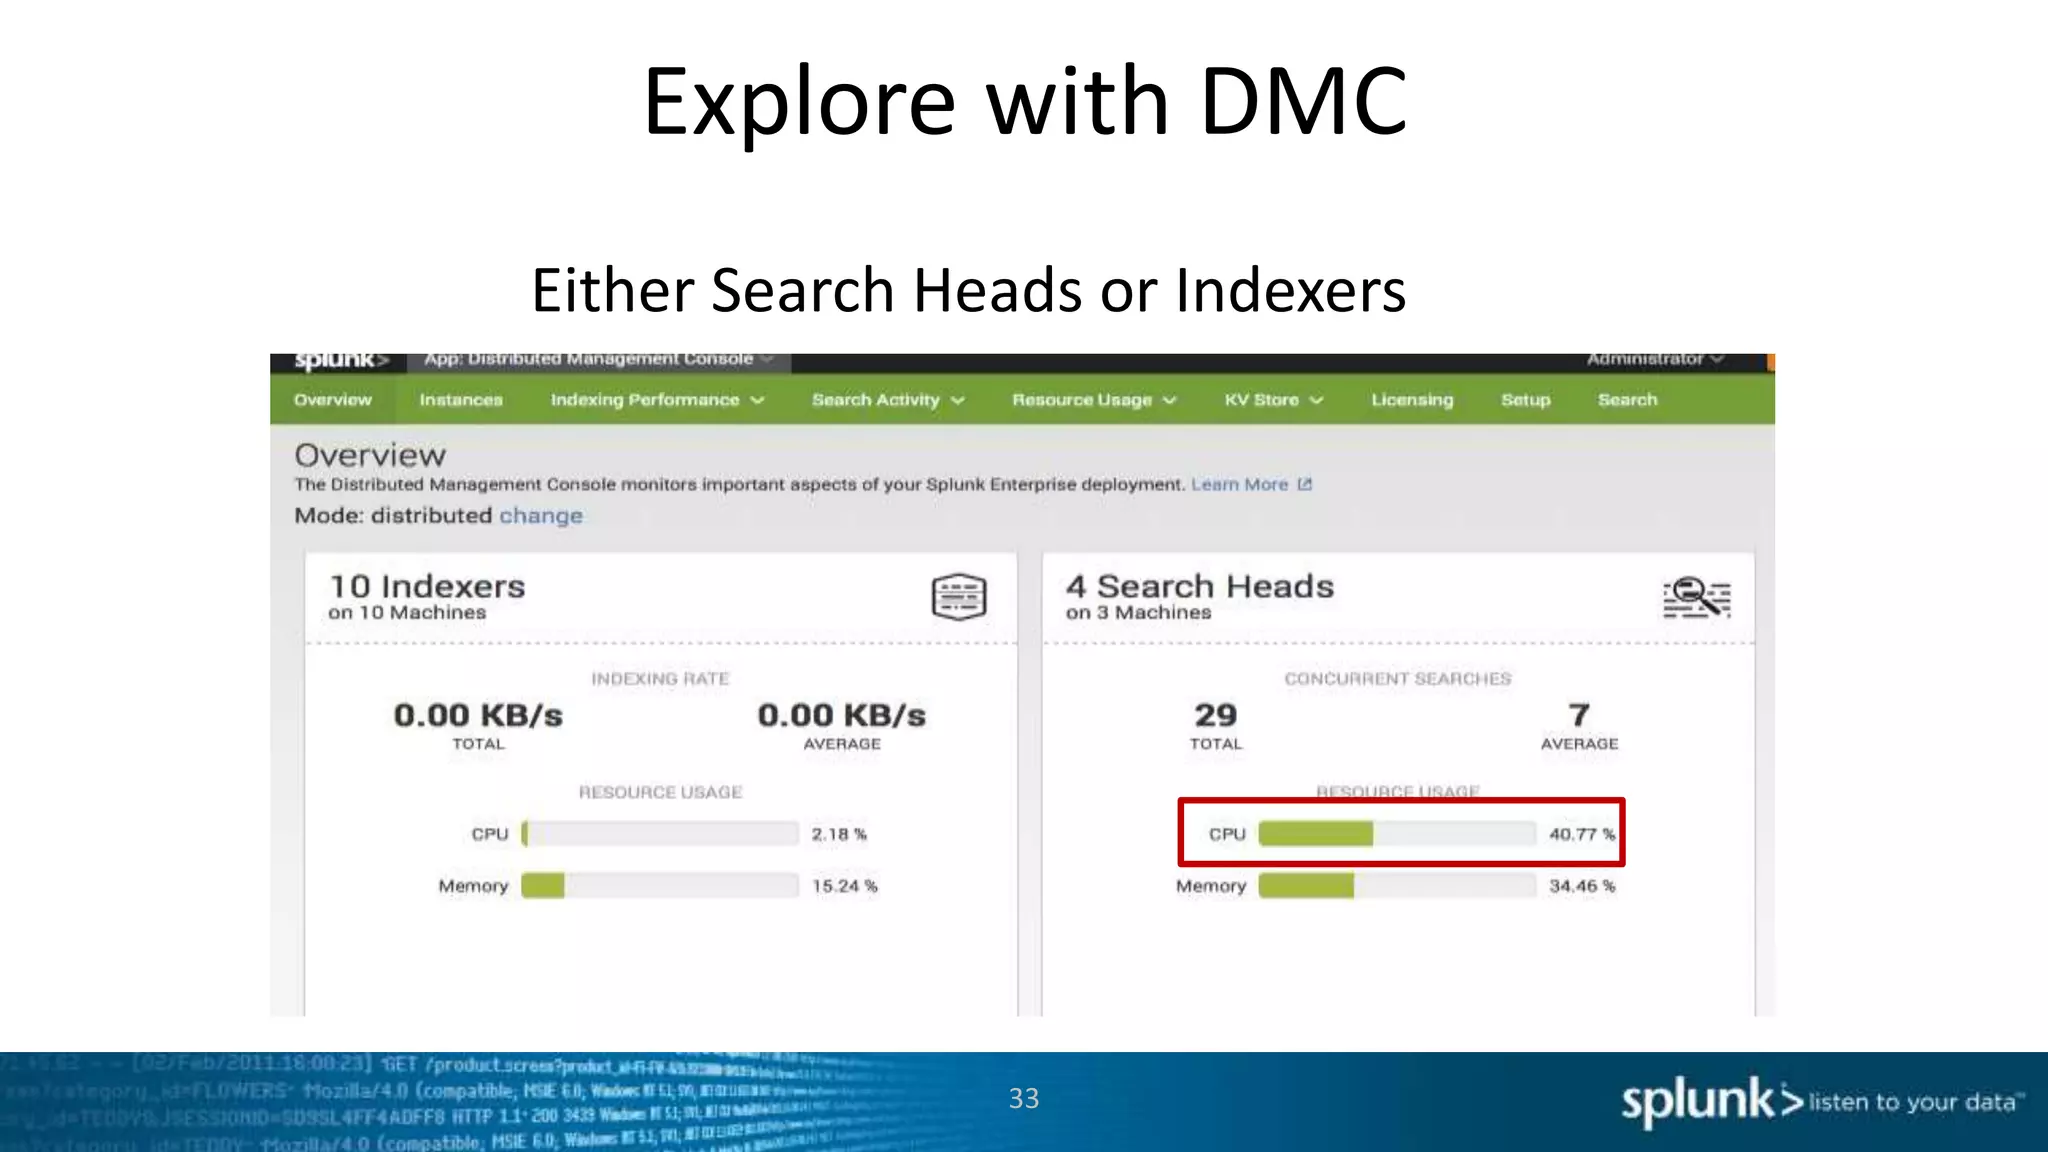
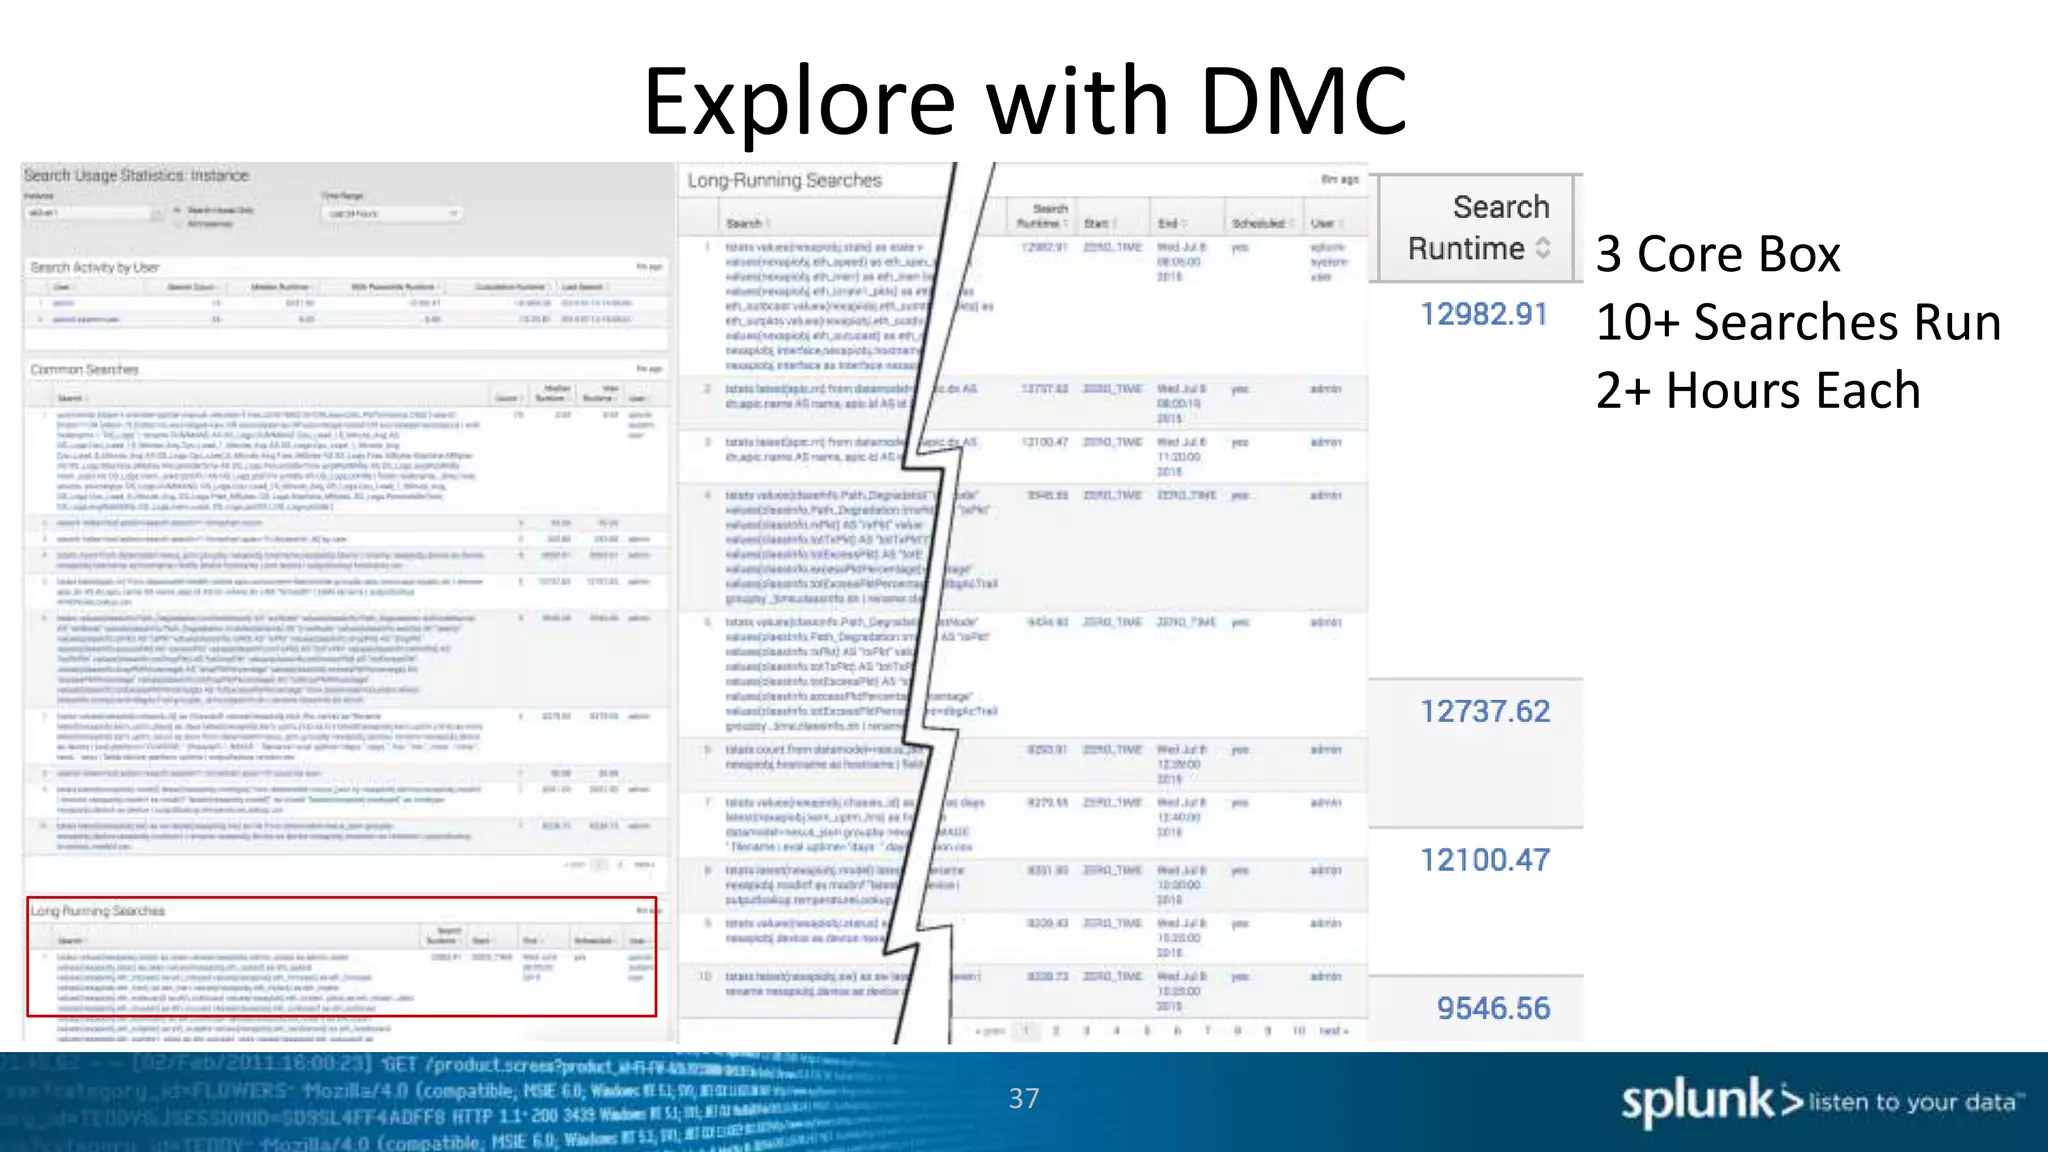
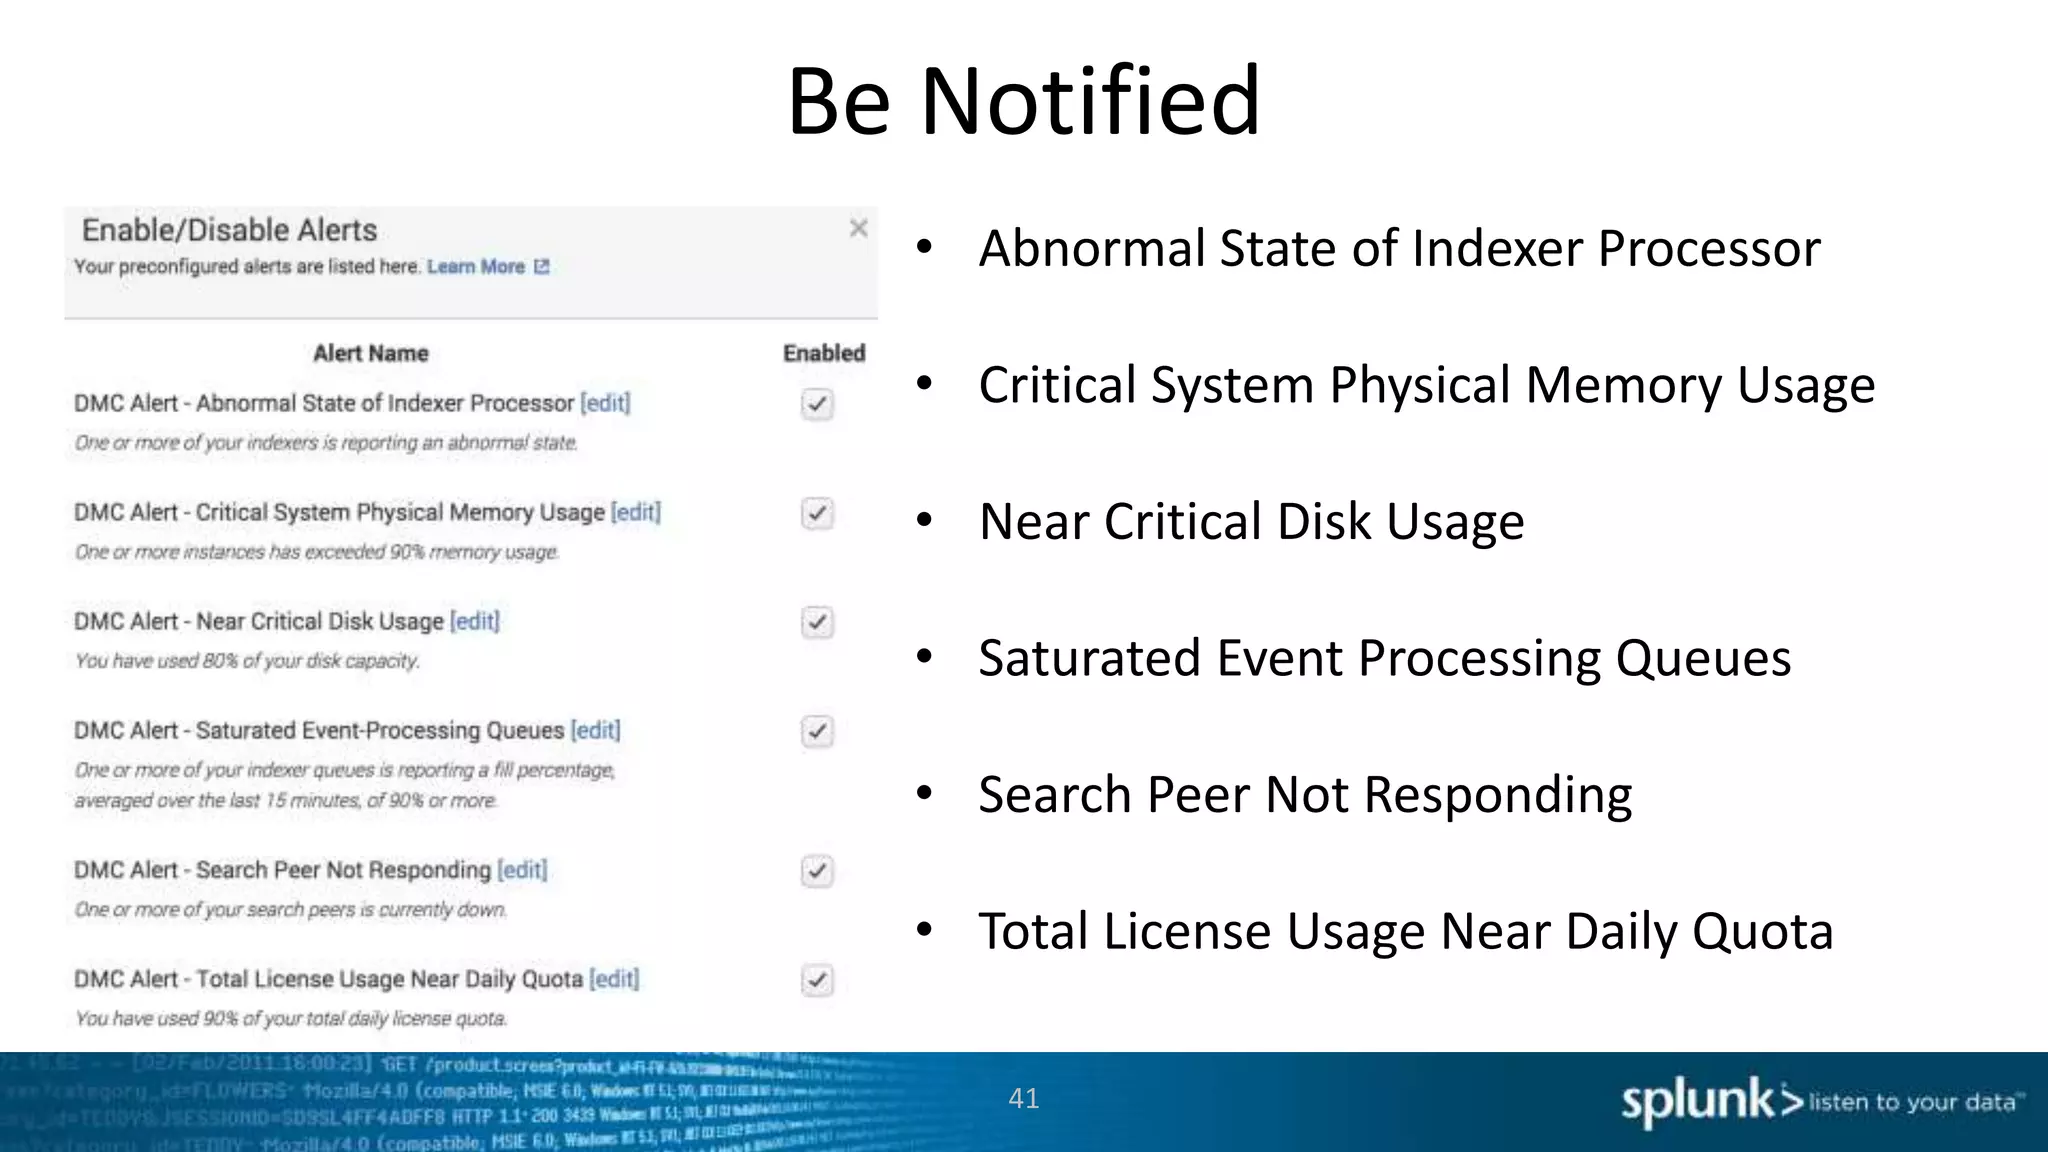


This document provides an overview of tools for monitoring Splunk environments, including the Distributed Management Console (DMC) and Splunk on Splunk (SoS). It discusses how to use these tools to diagnose issues related to data acquisition latency, slow search performance, and platform alerts. The document demonstrates exploring the DMC and SoS to identify potential causes such as high CPU, slow disks, incorrect timestamping, or an increase in data volumes. It emphasizes that virtually all large customers use one or both of these monitoring tools.