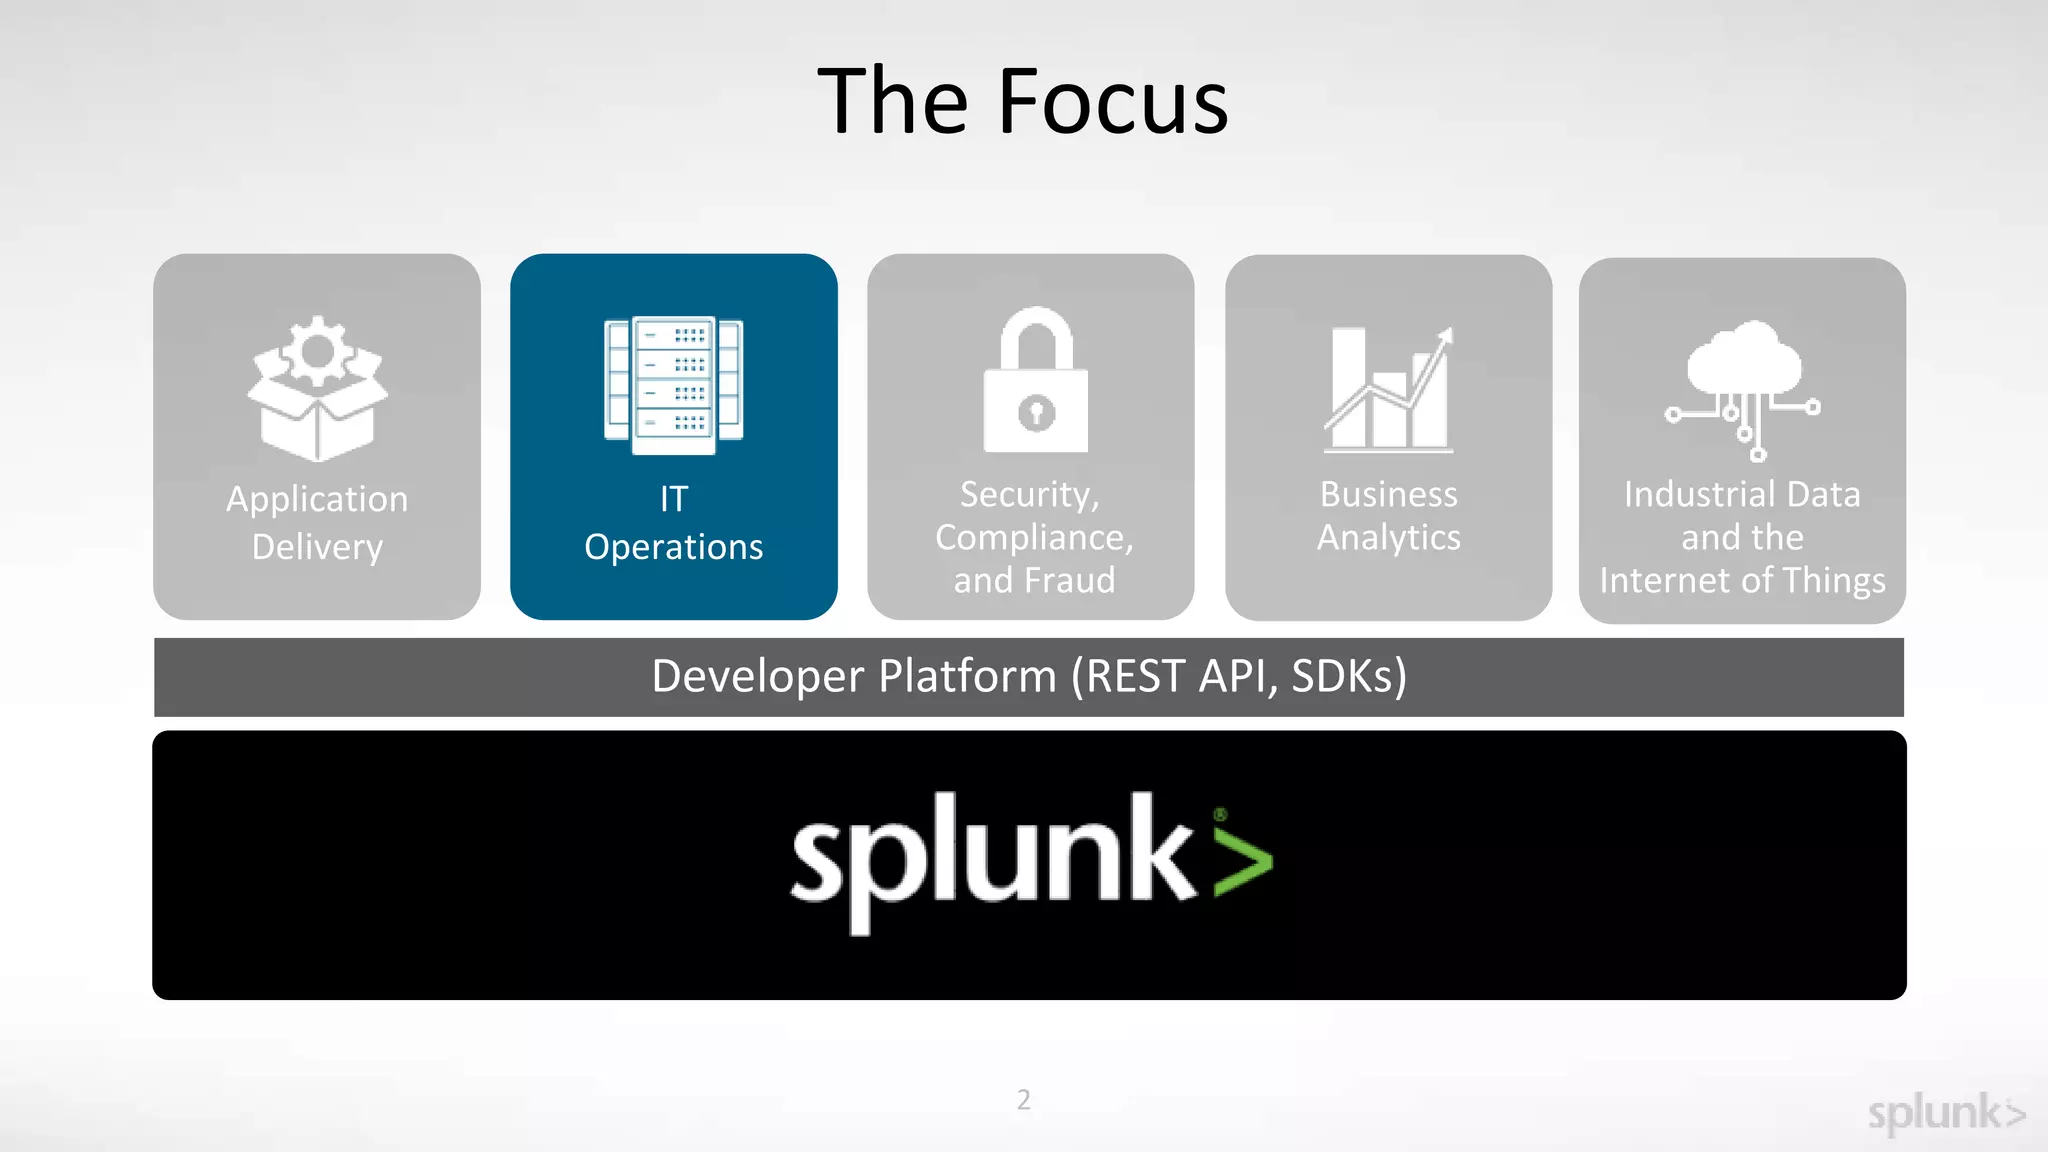
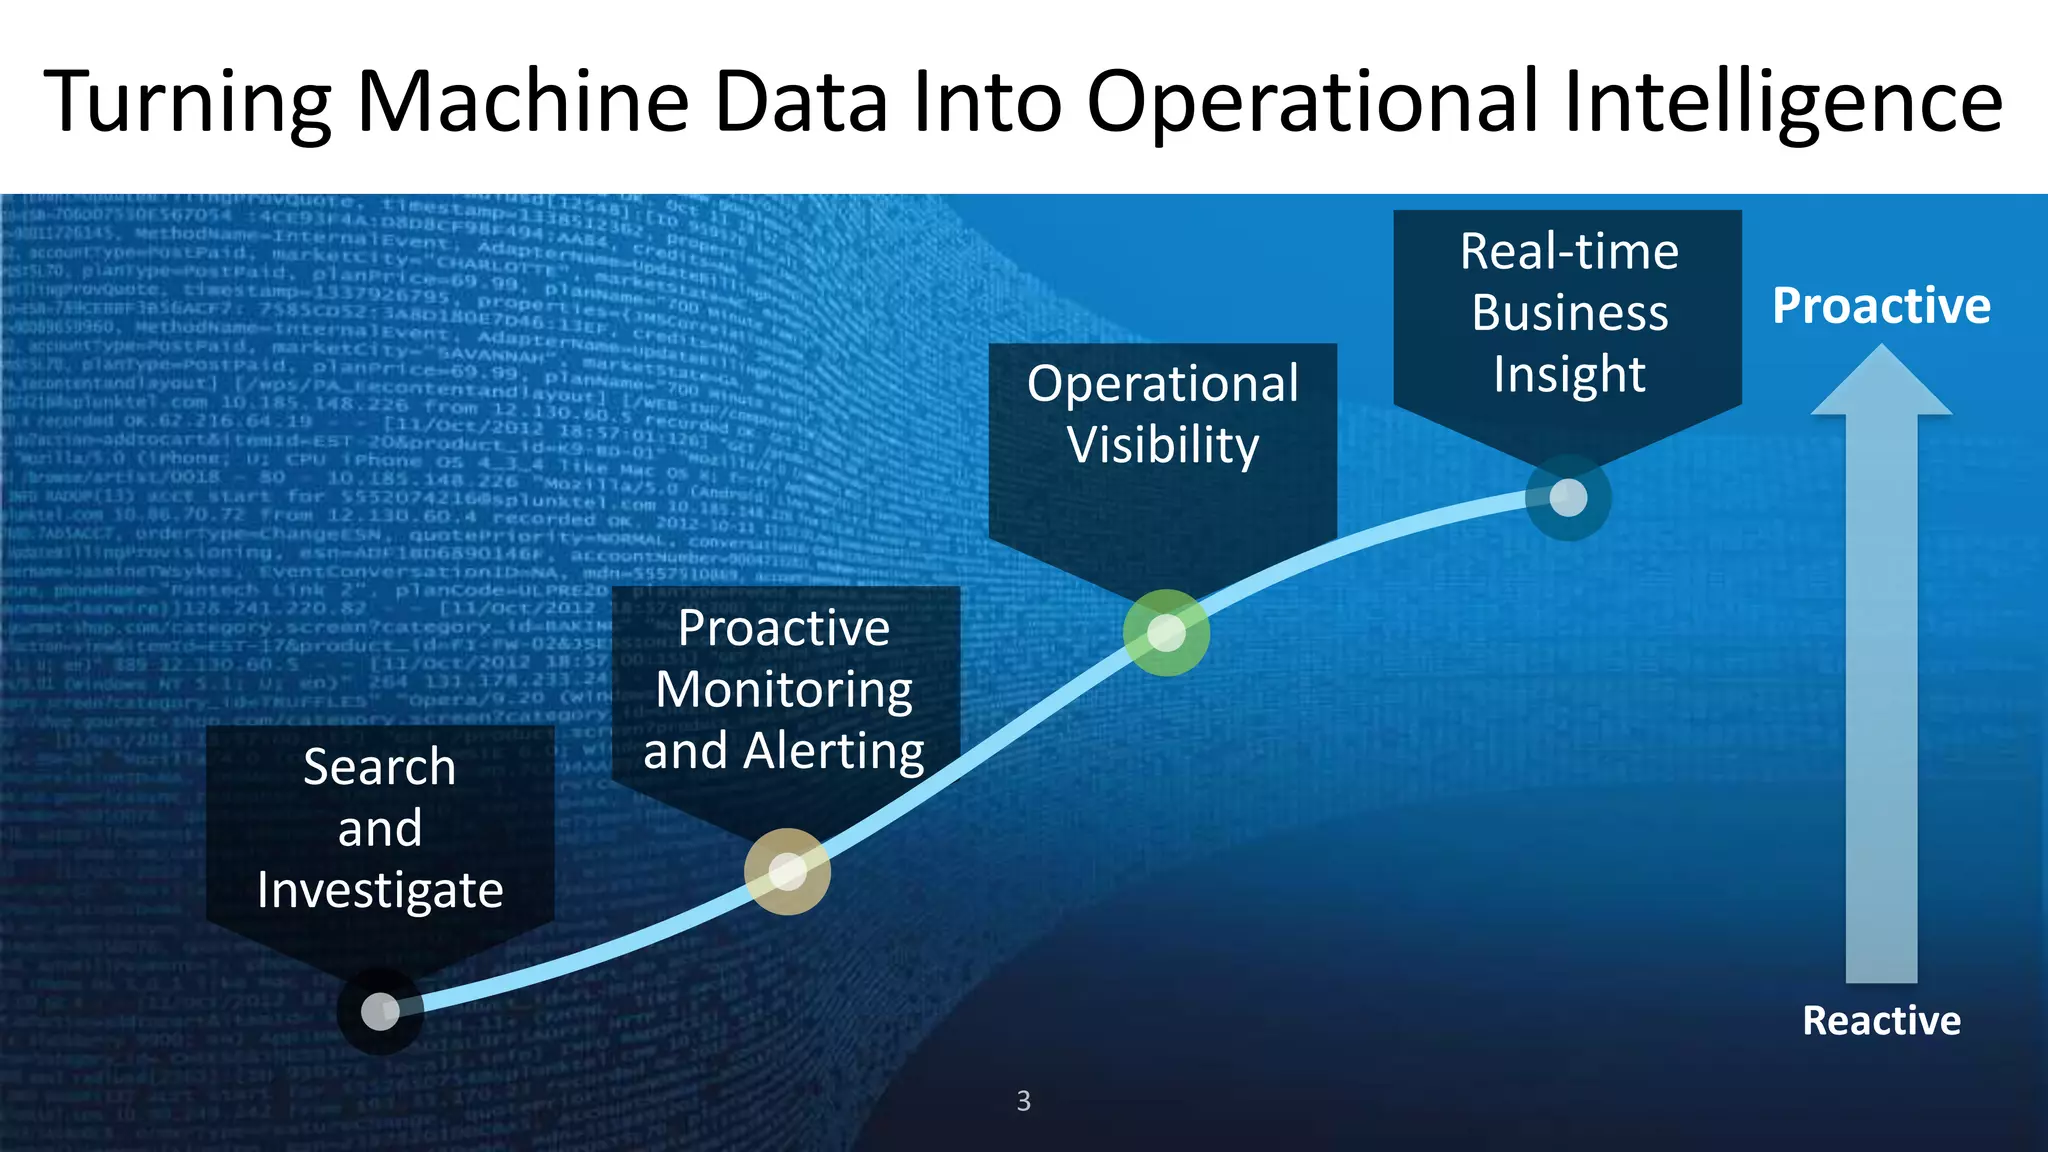
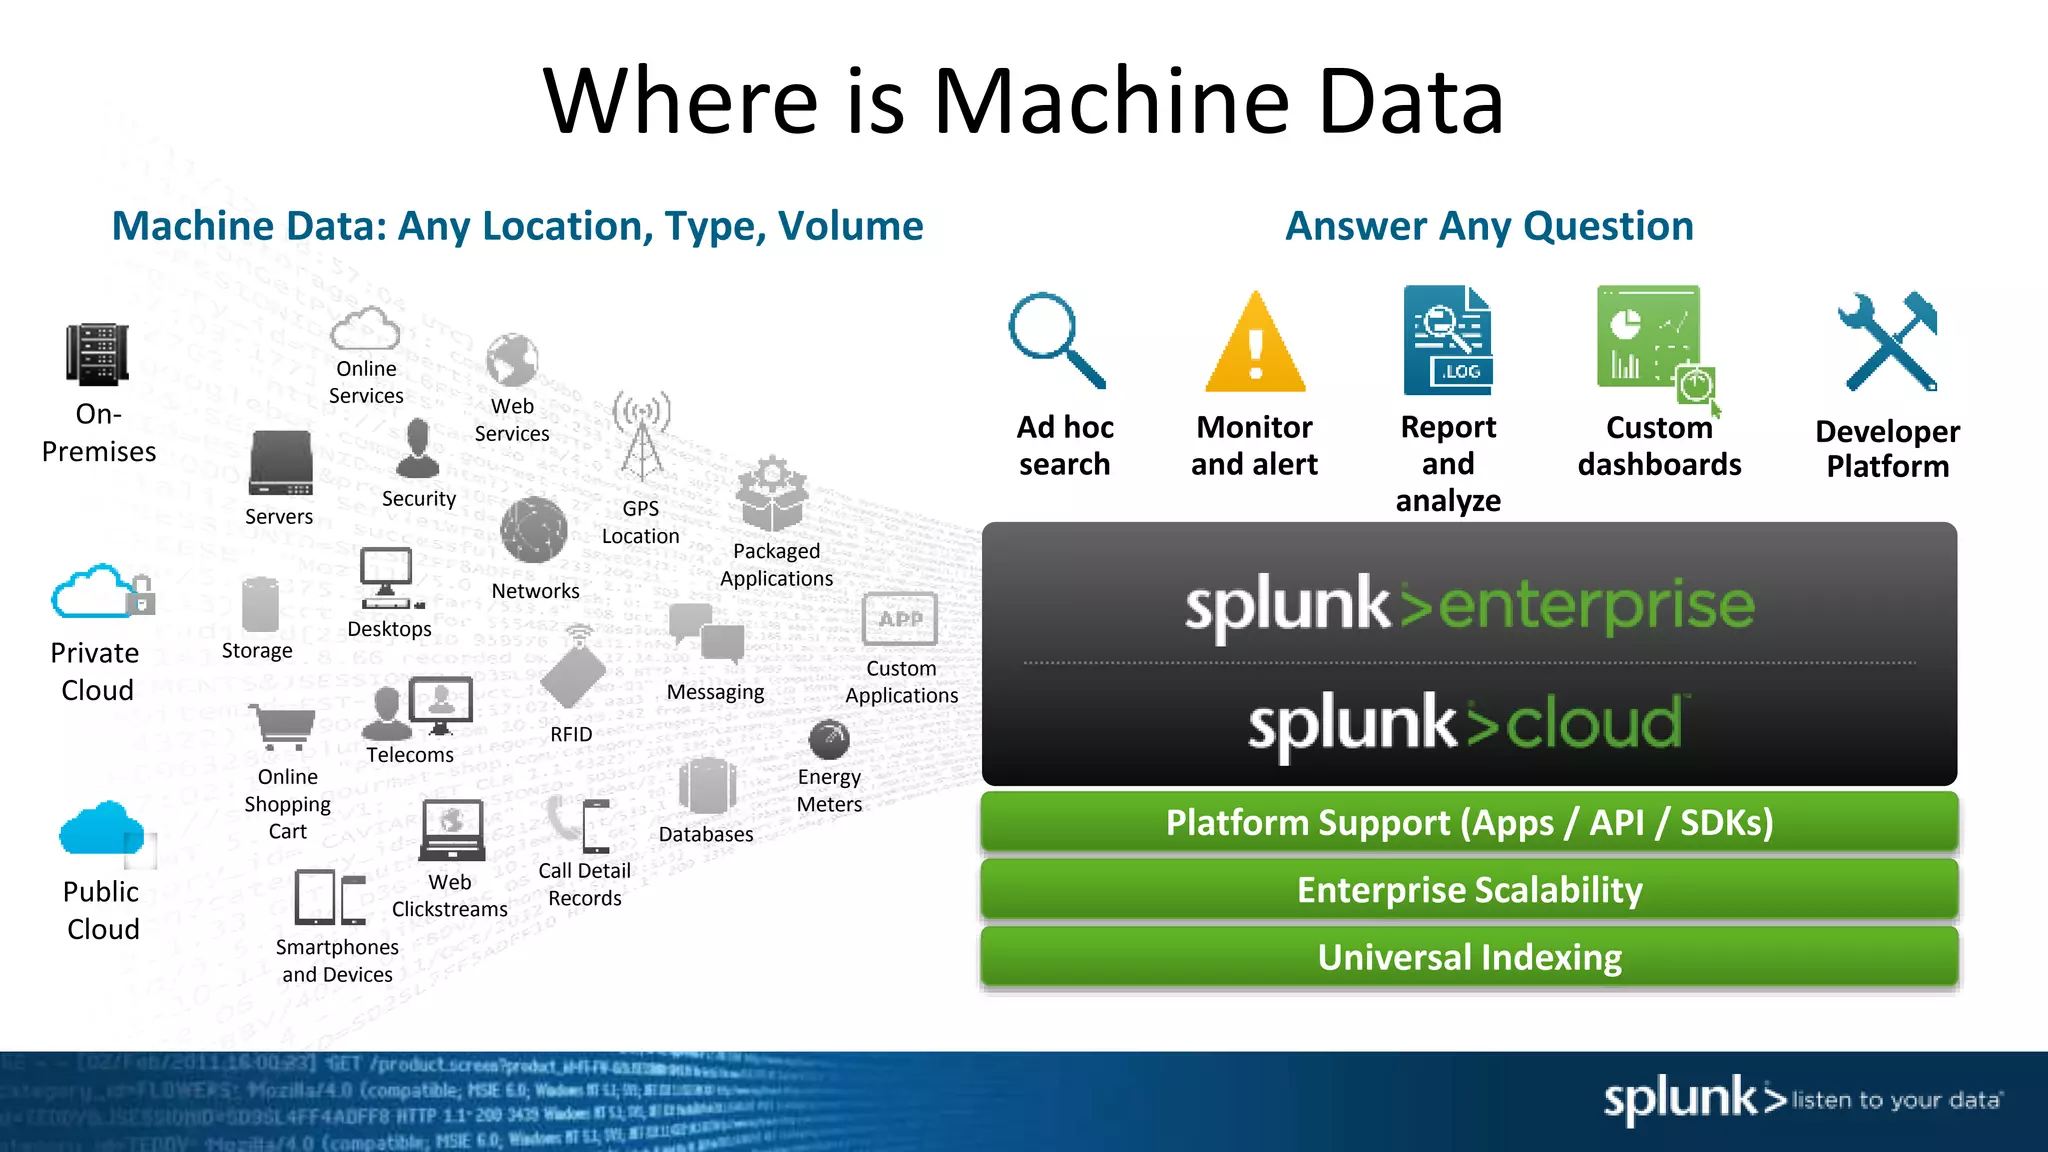
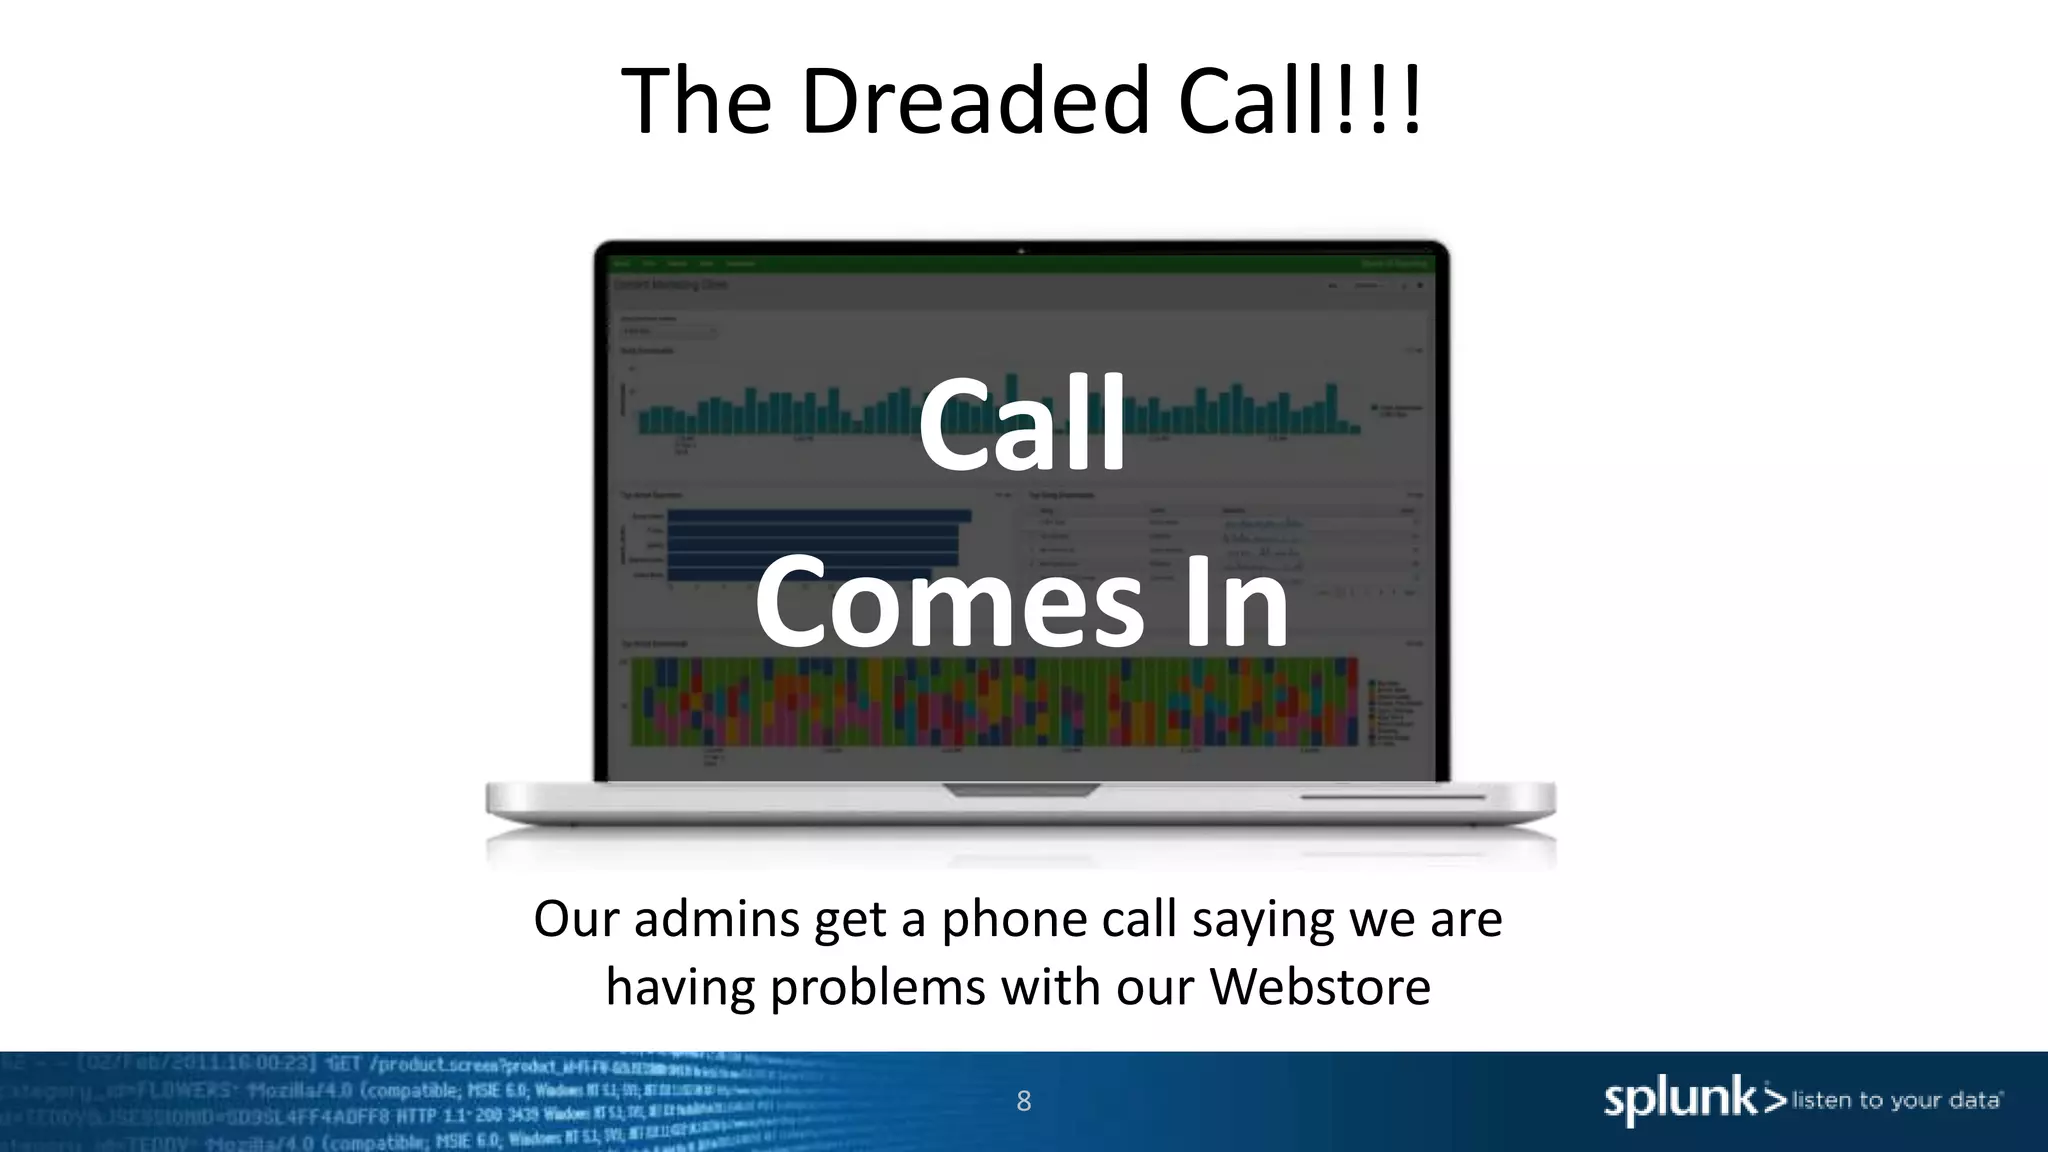
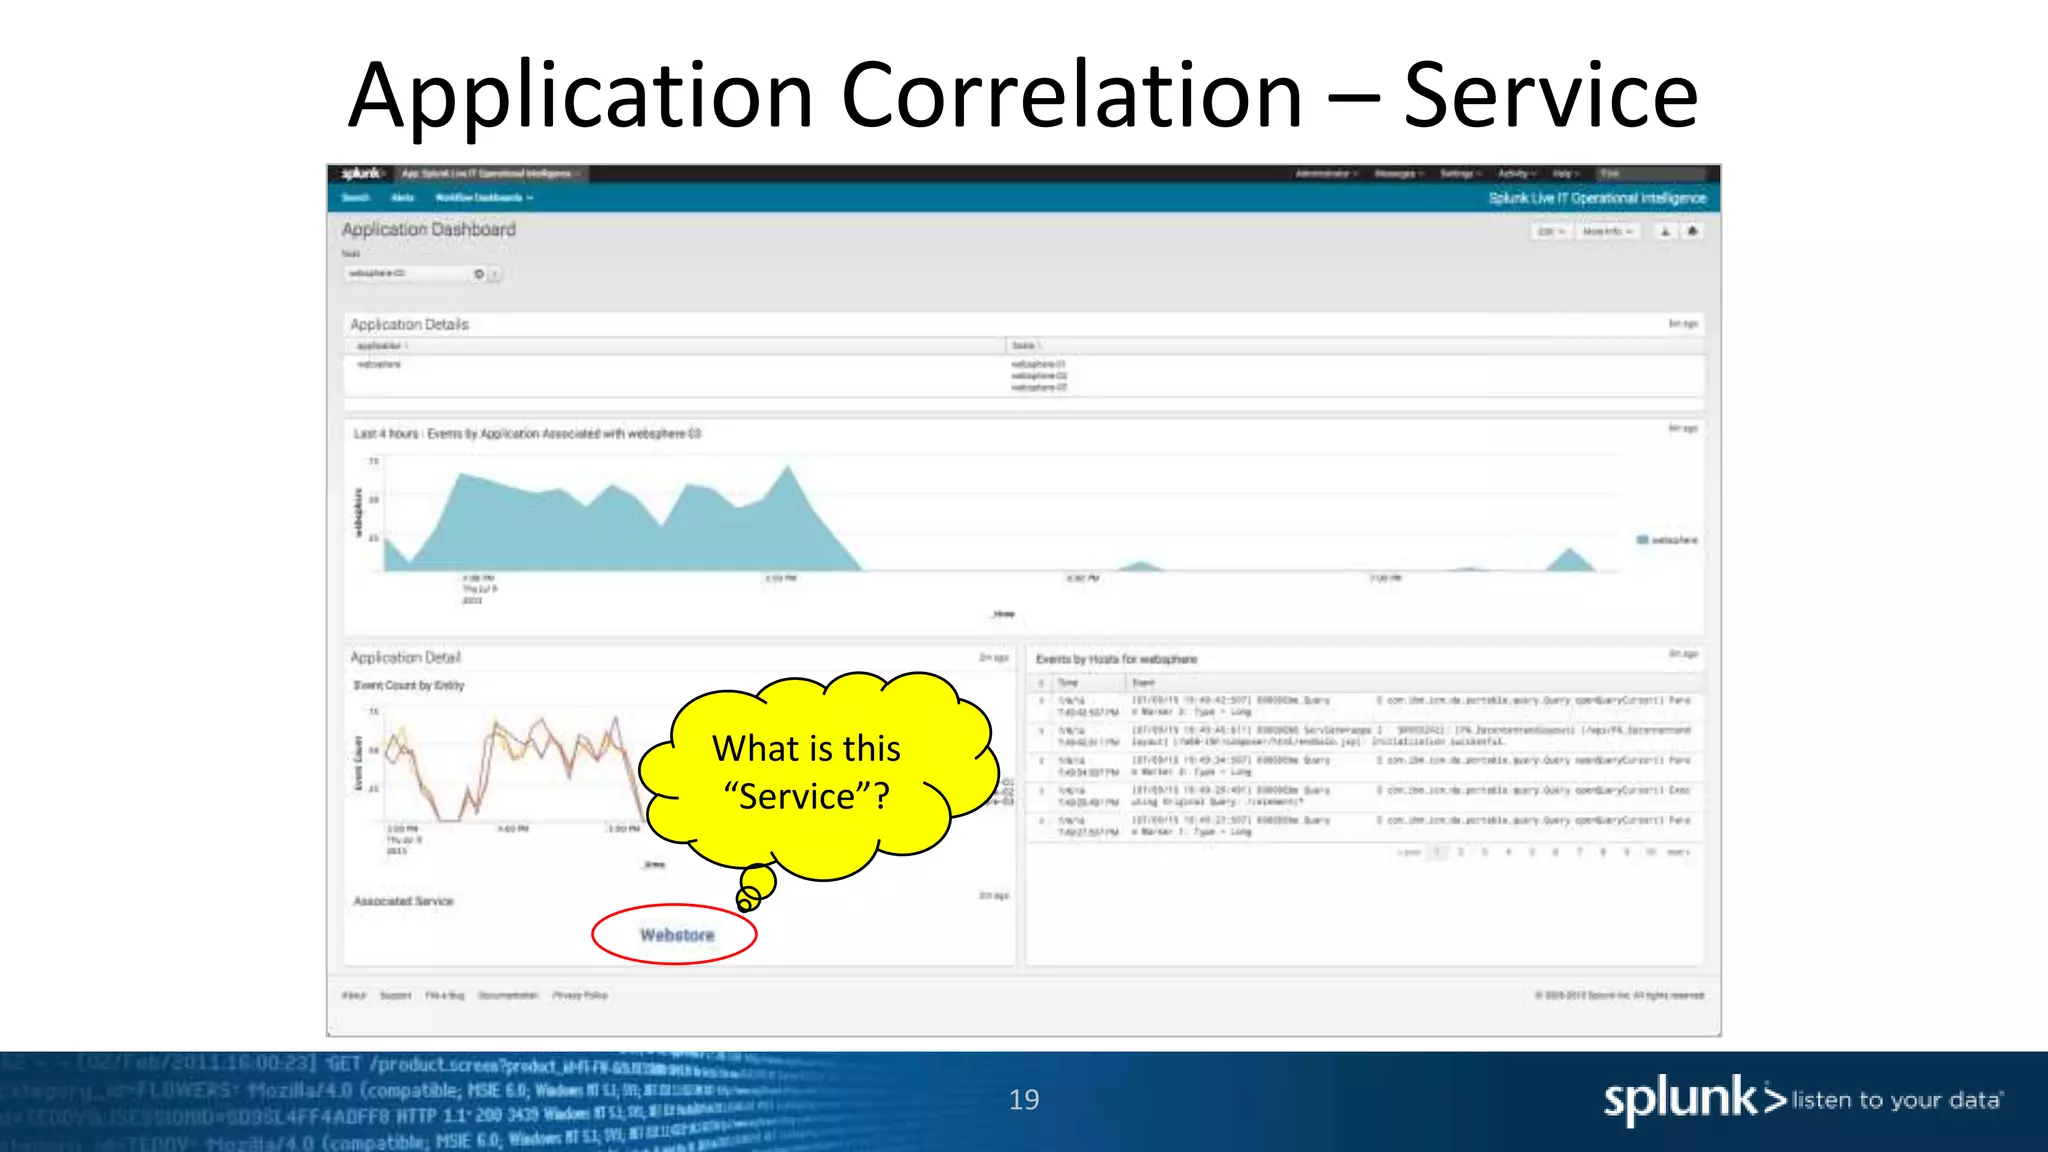
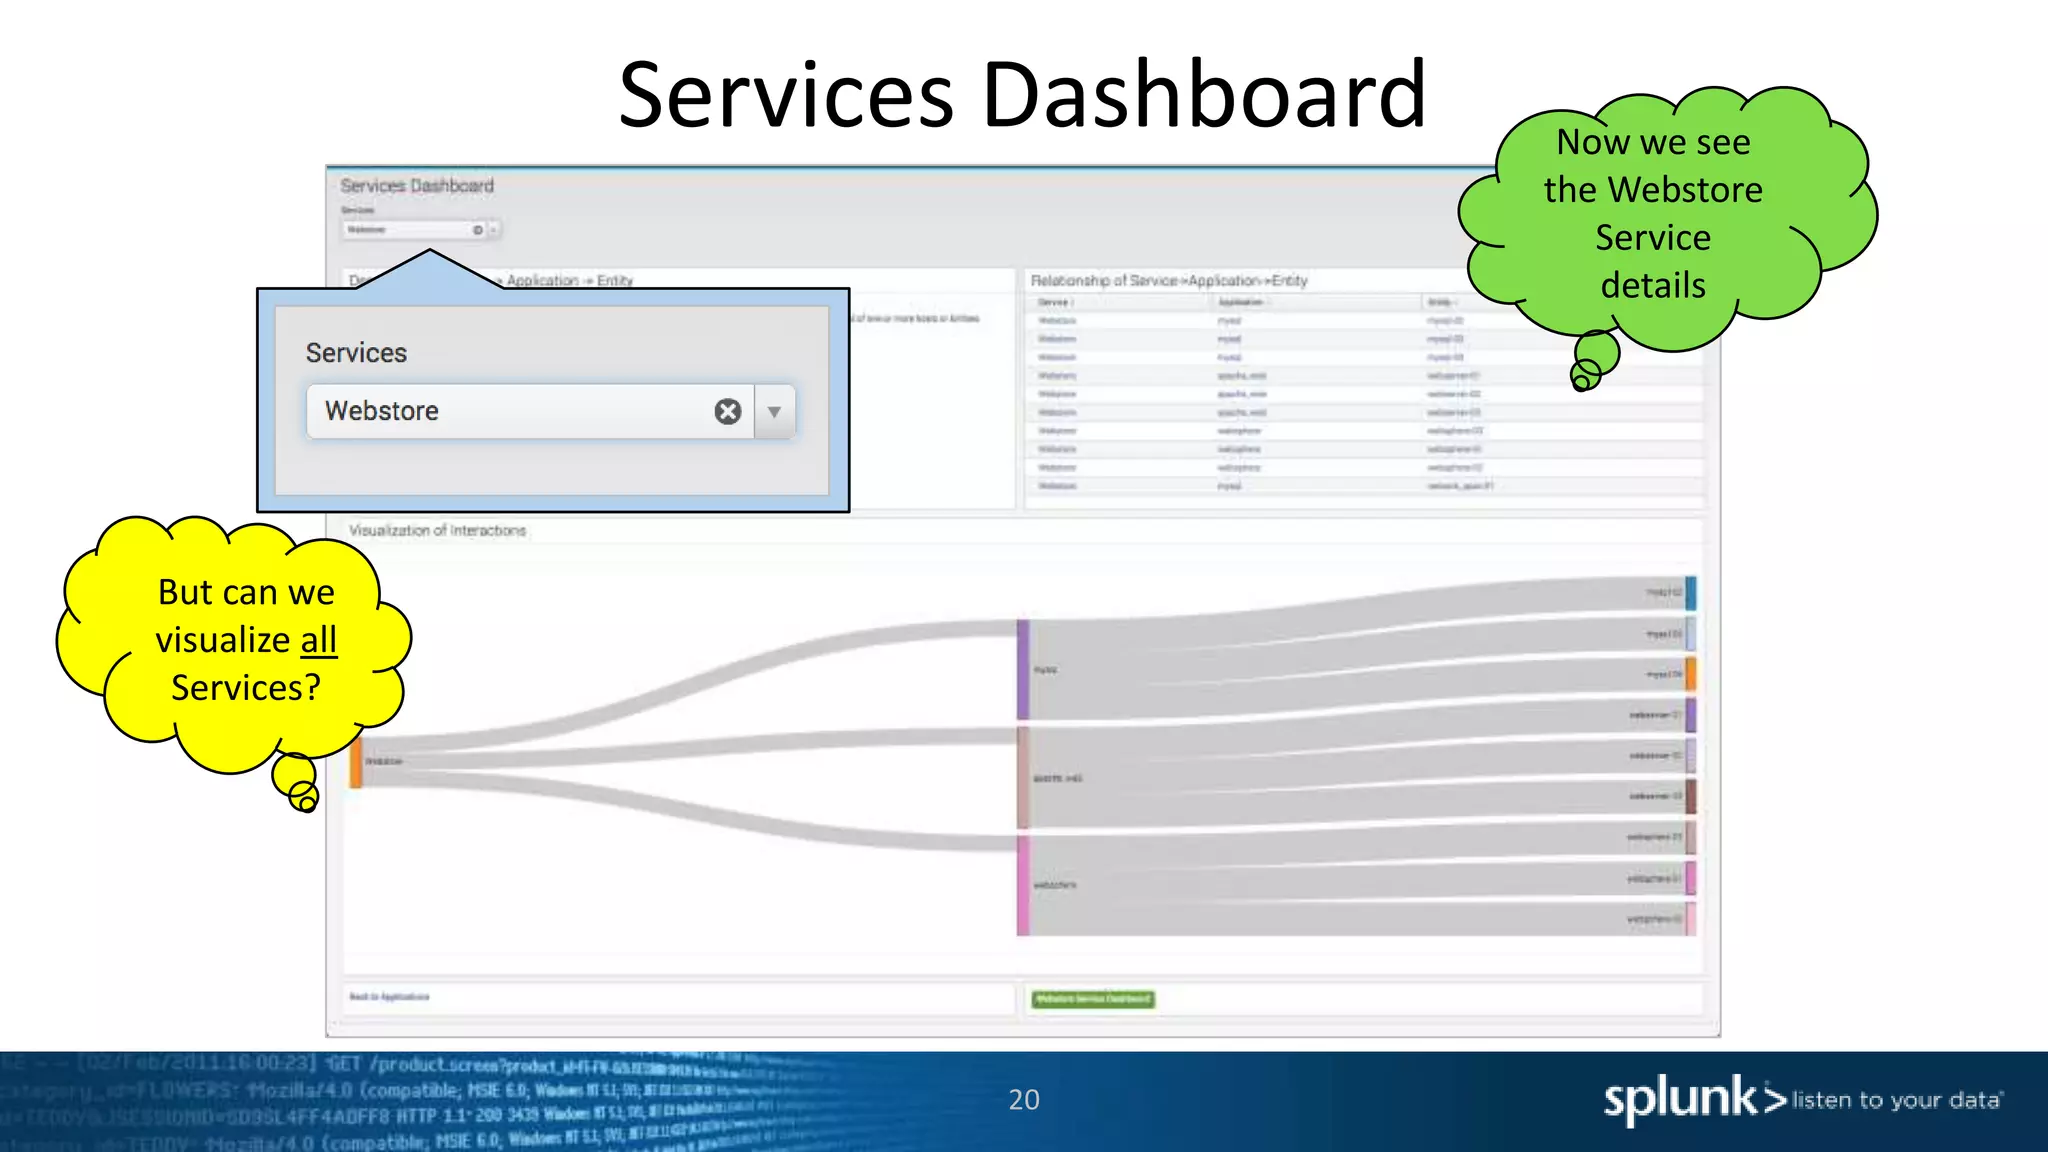
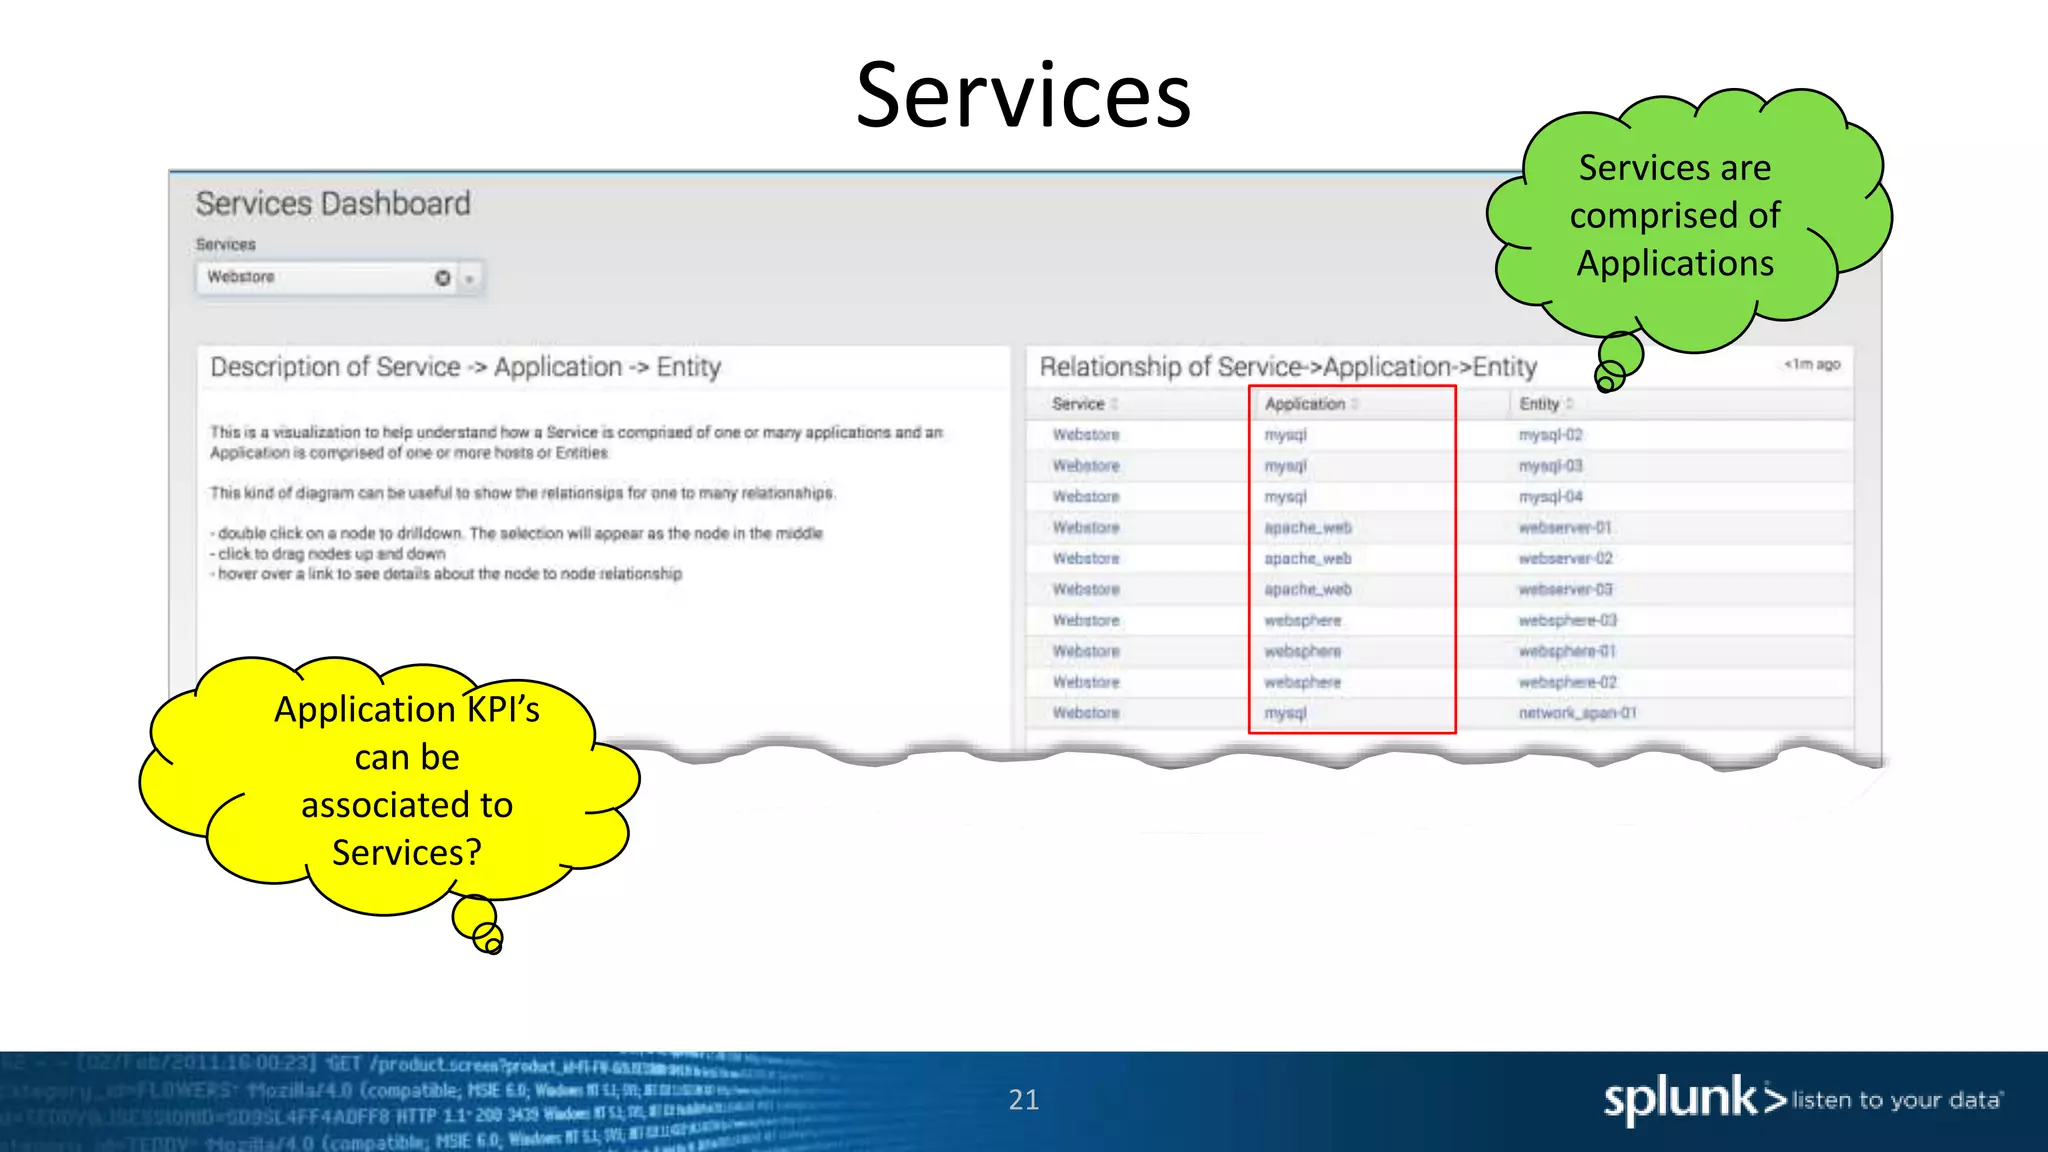
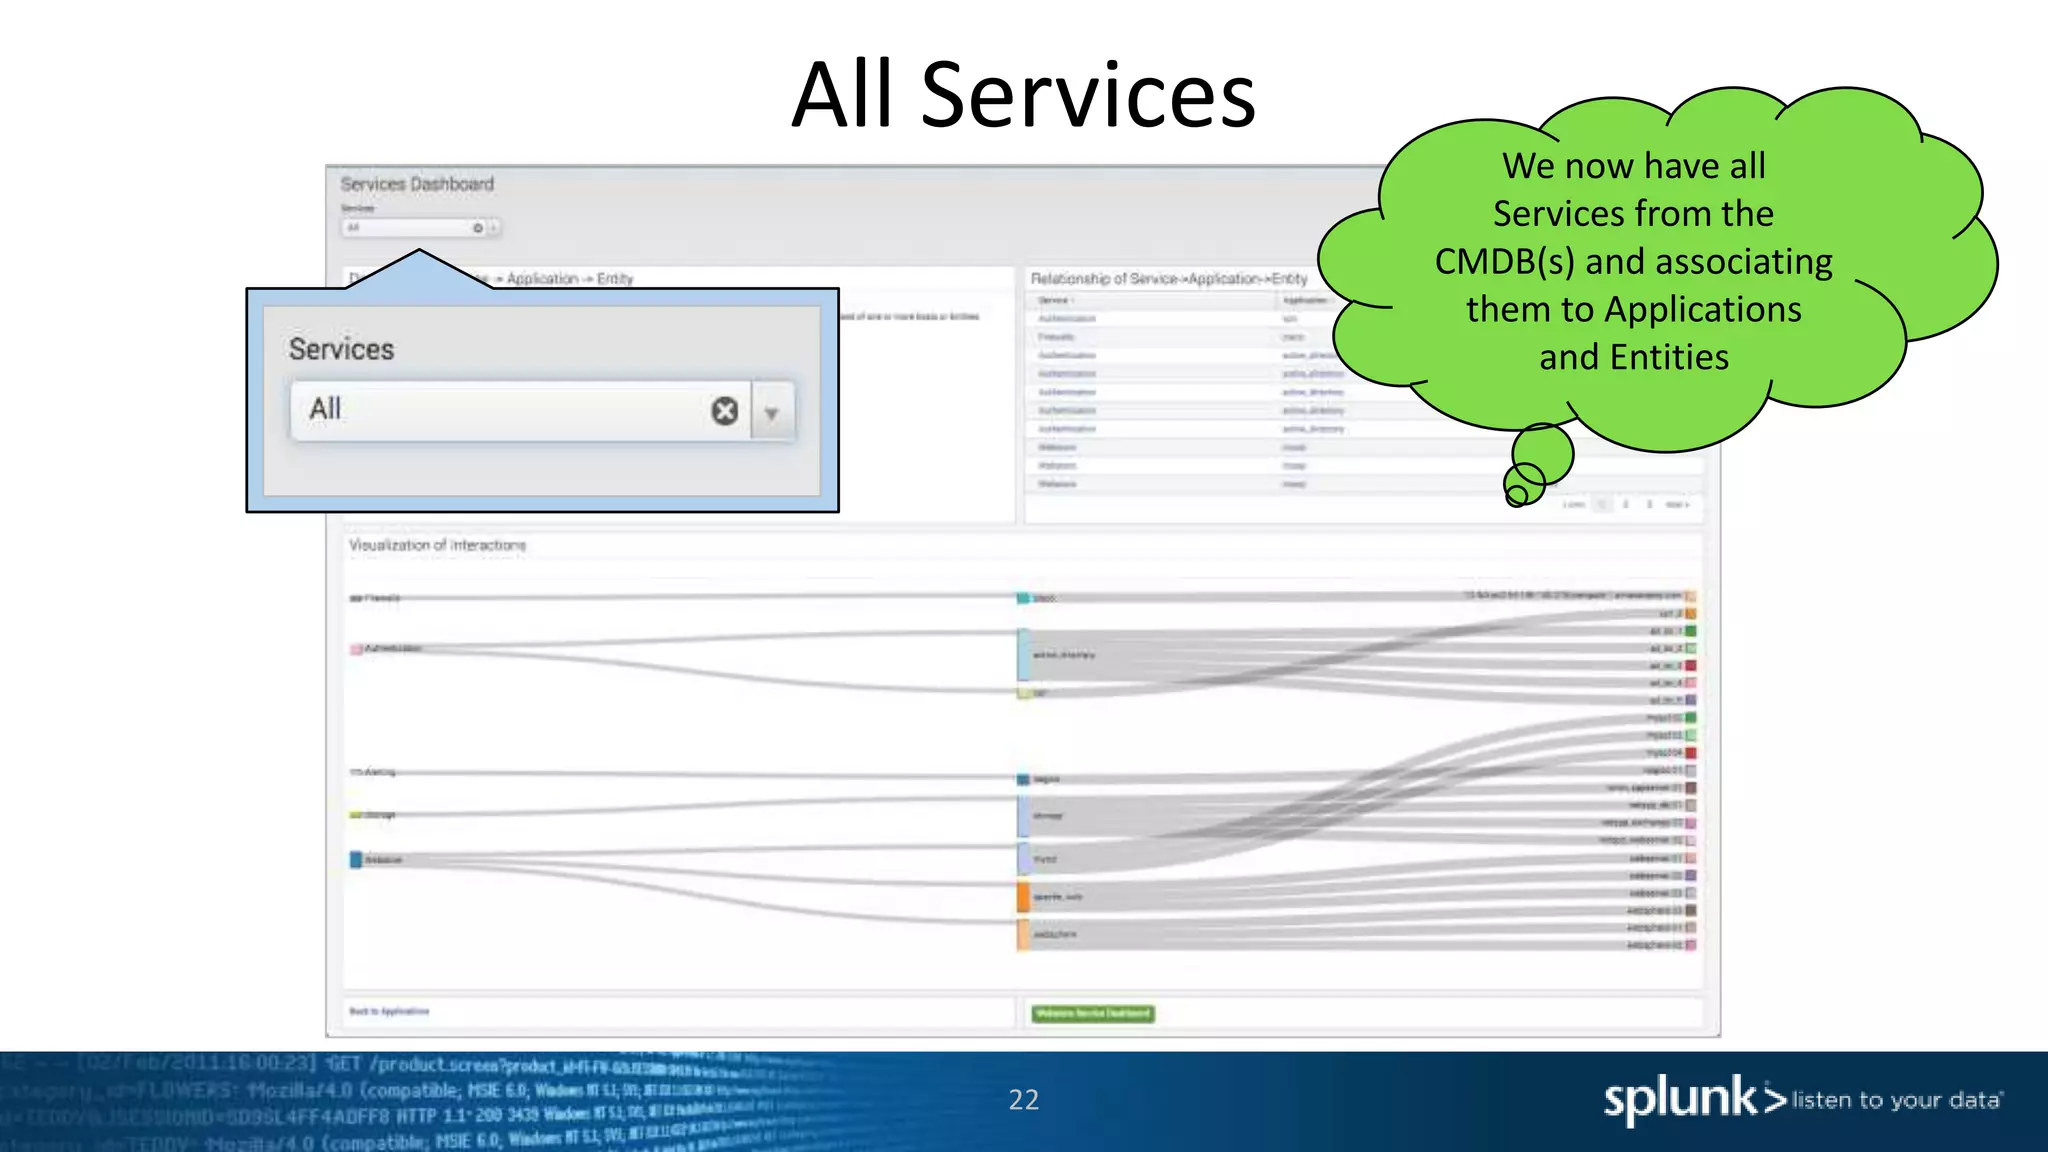
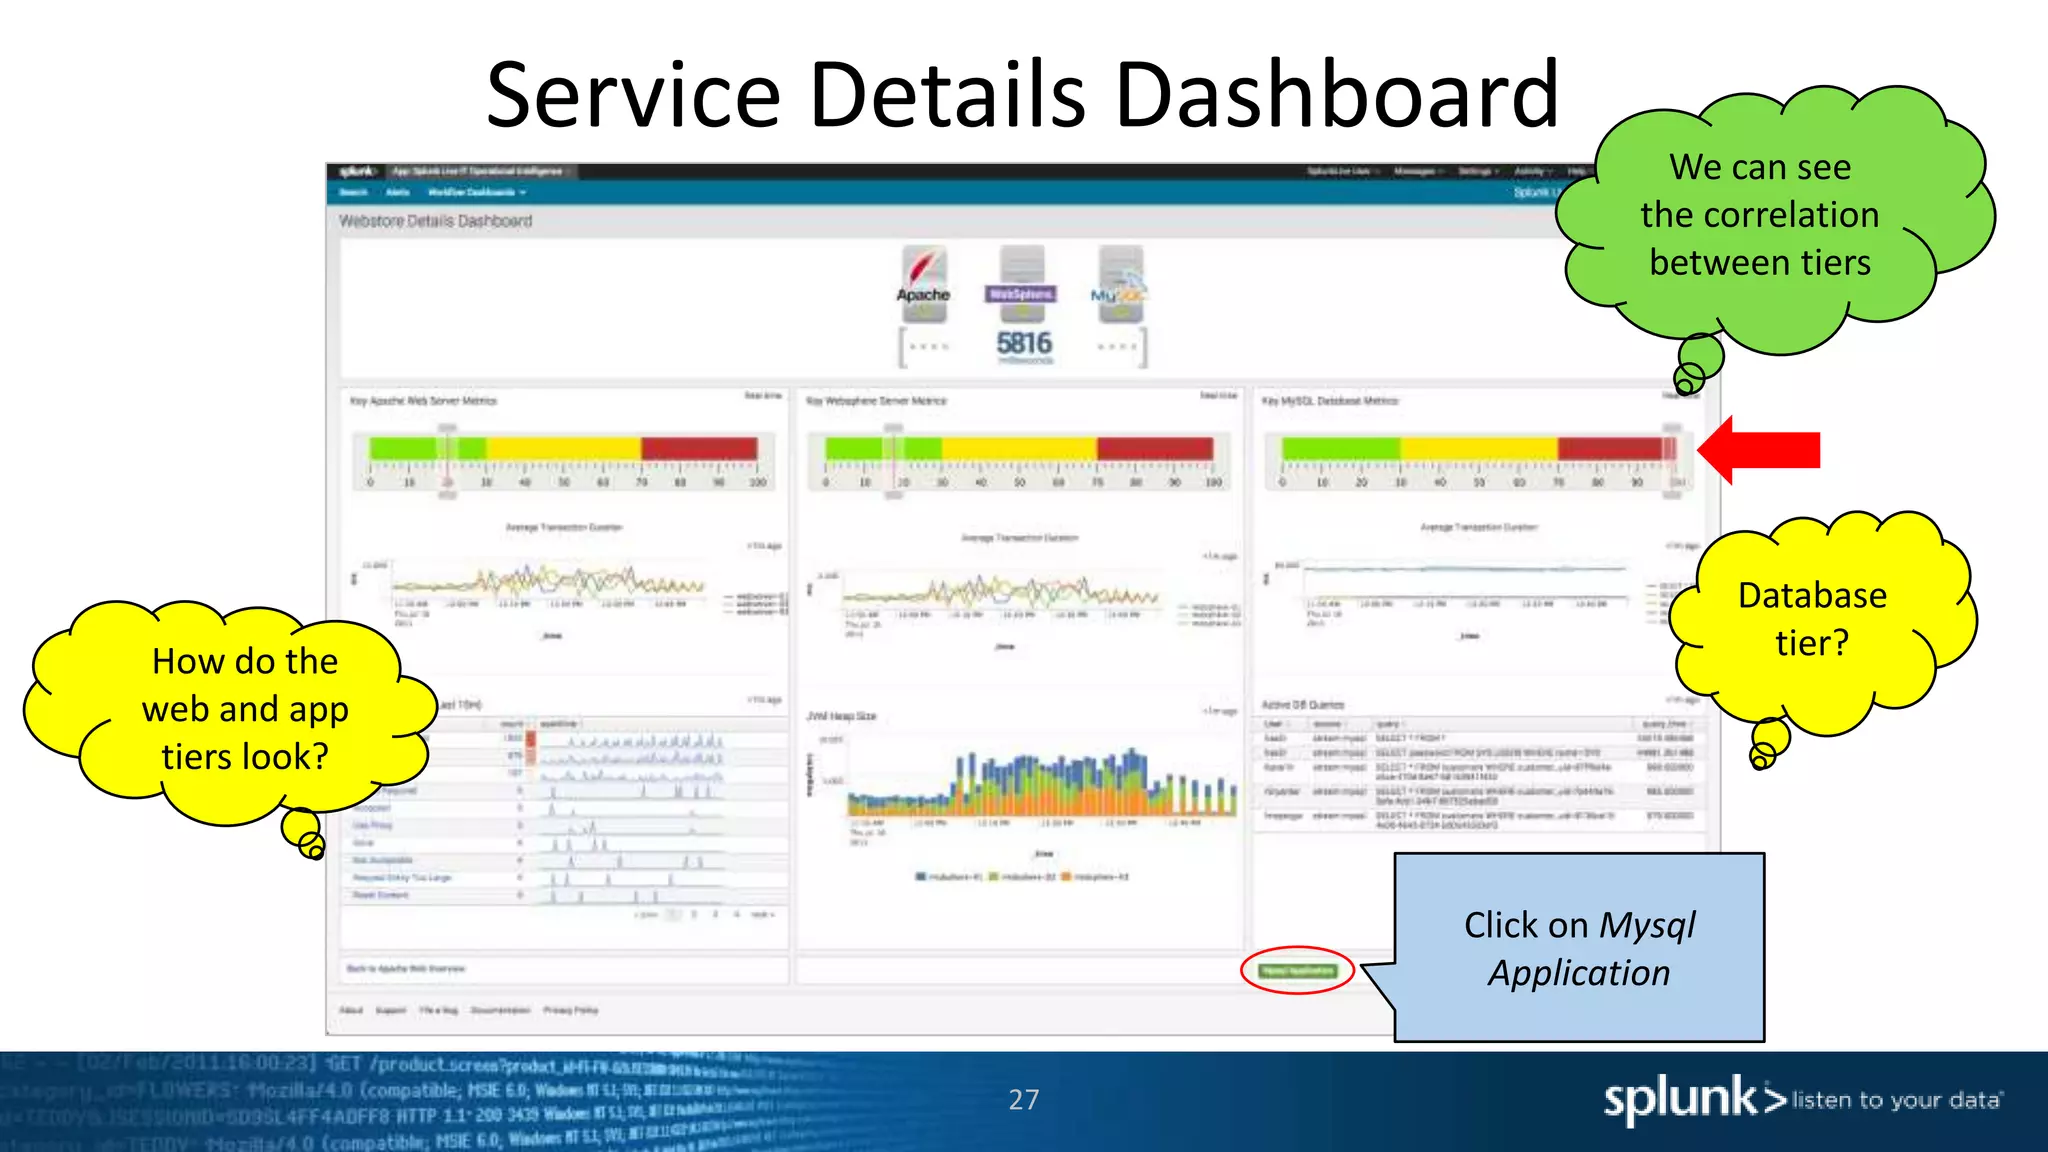
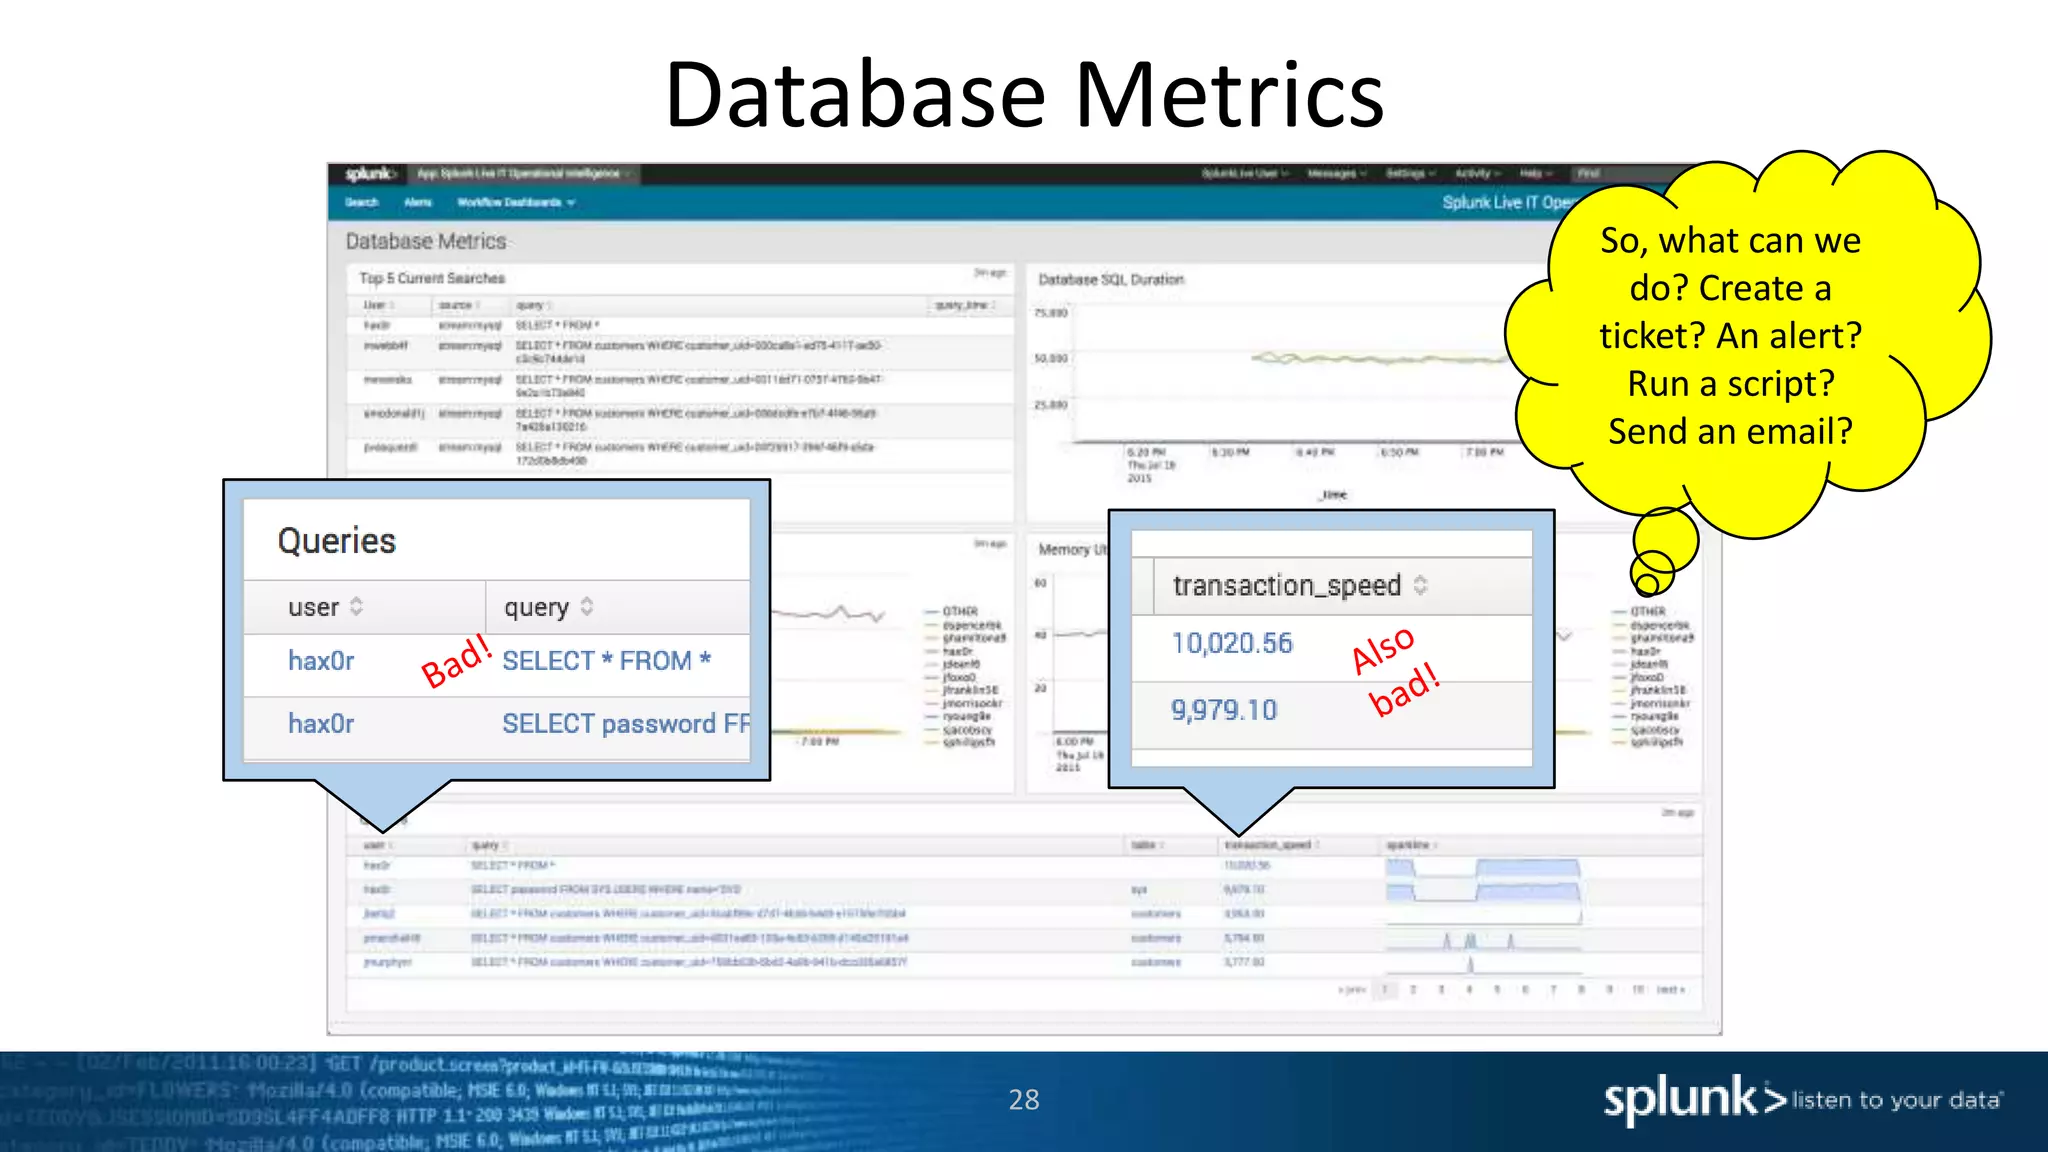
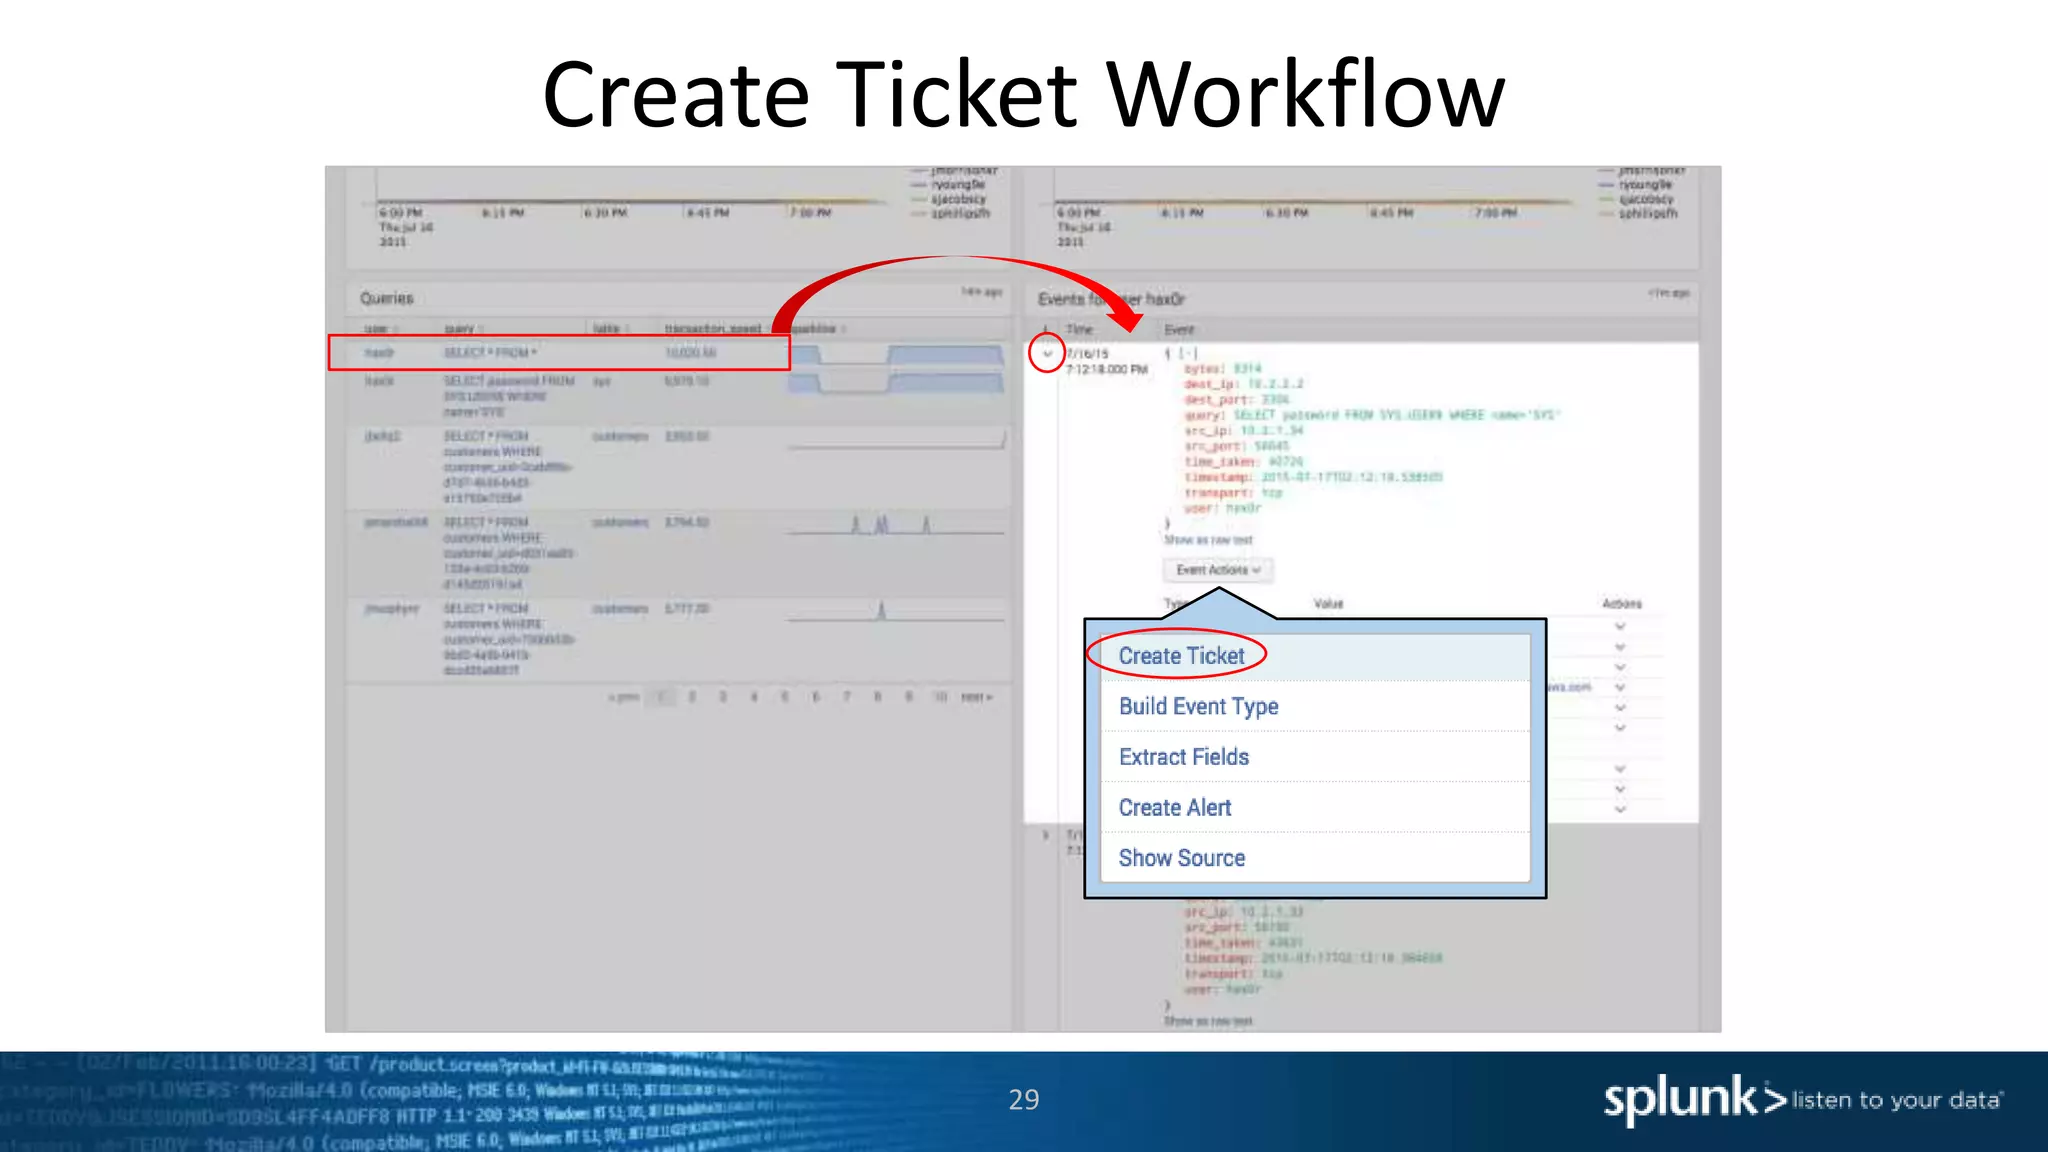
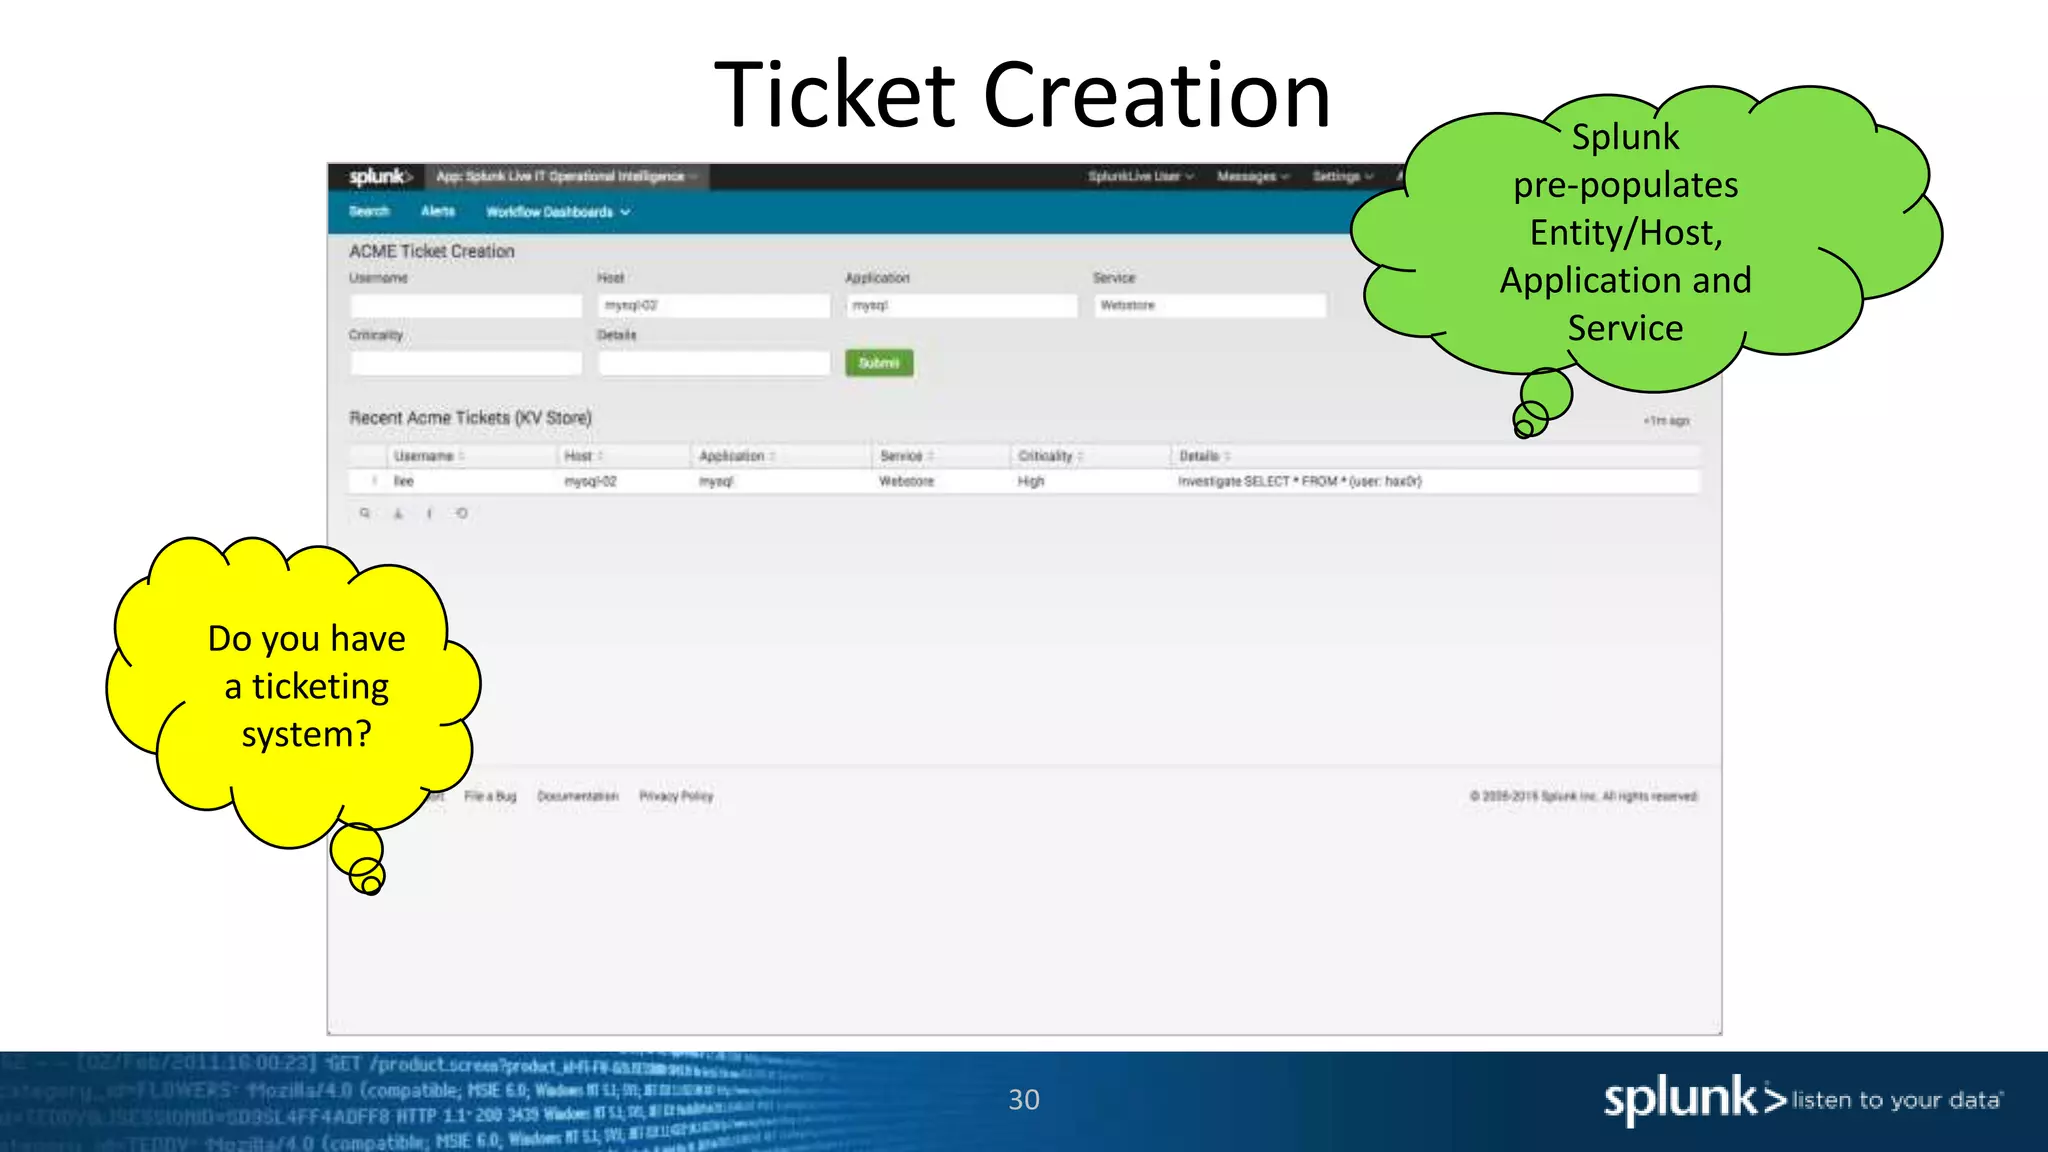
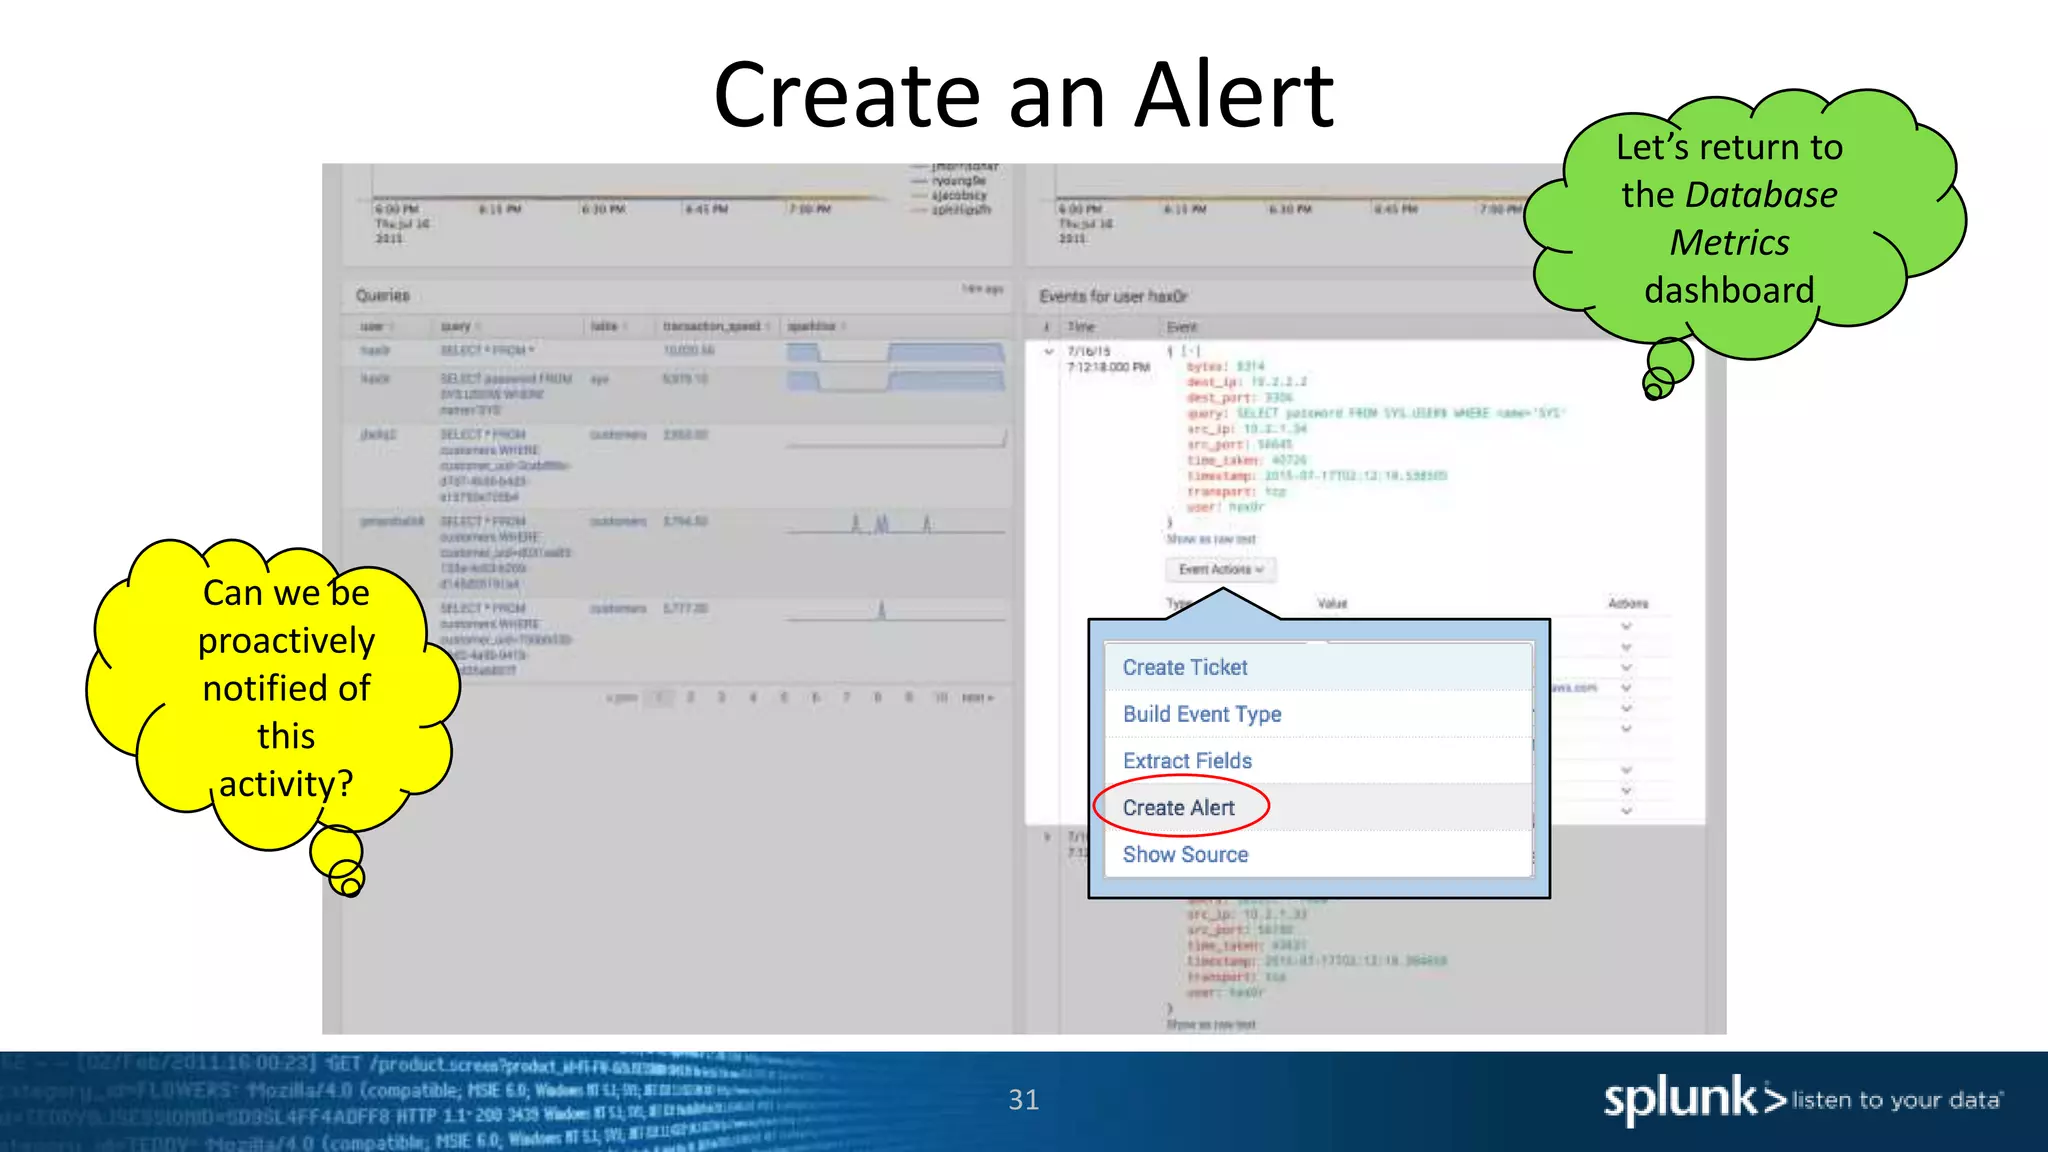
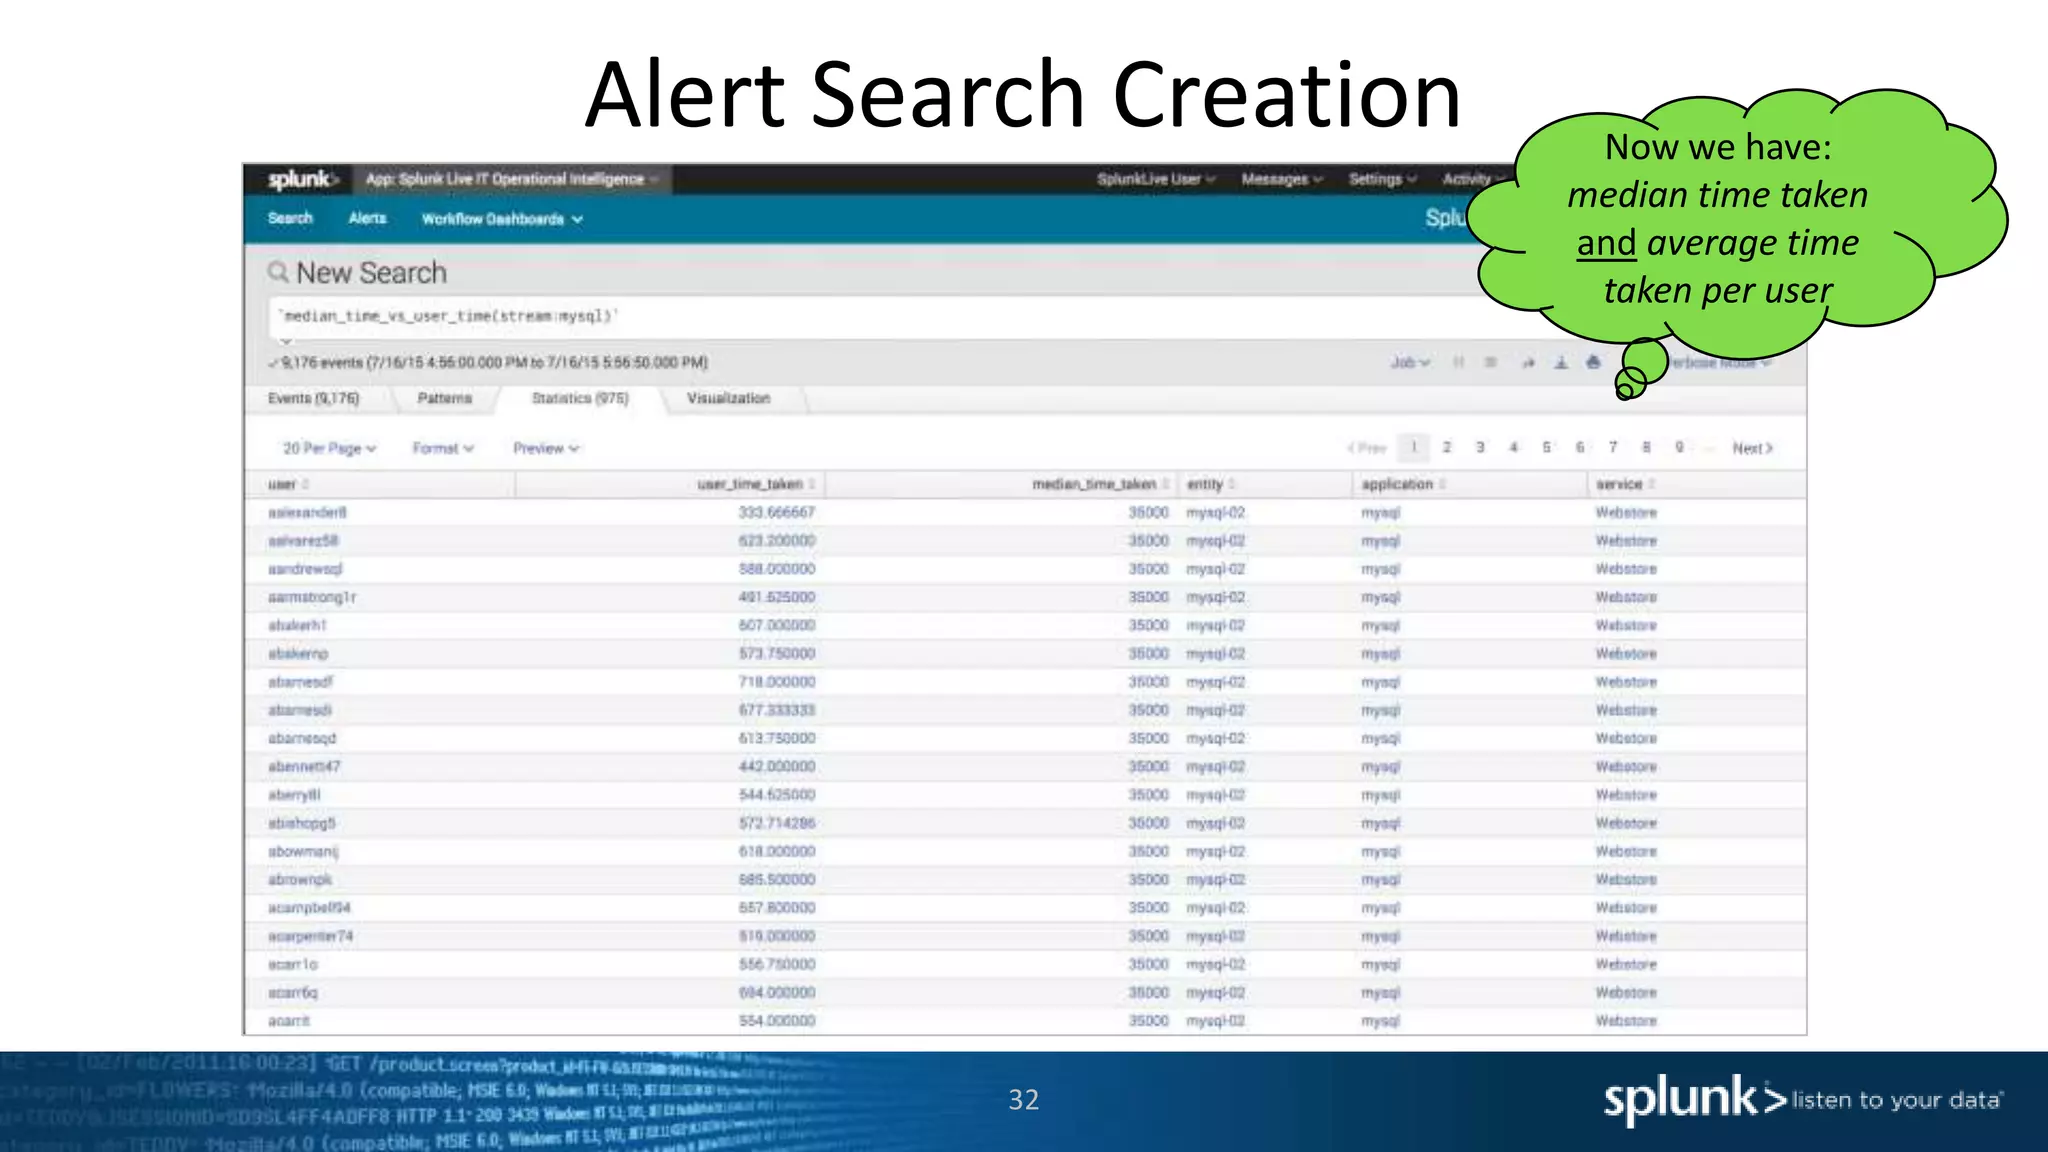
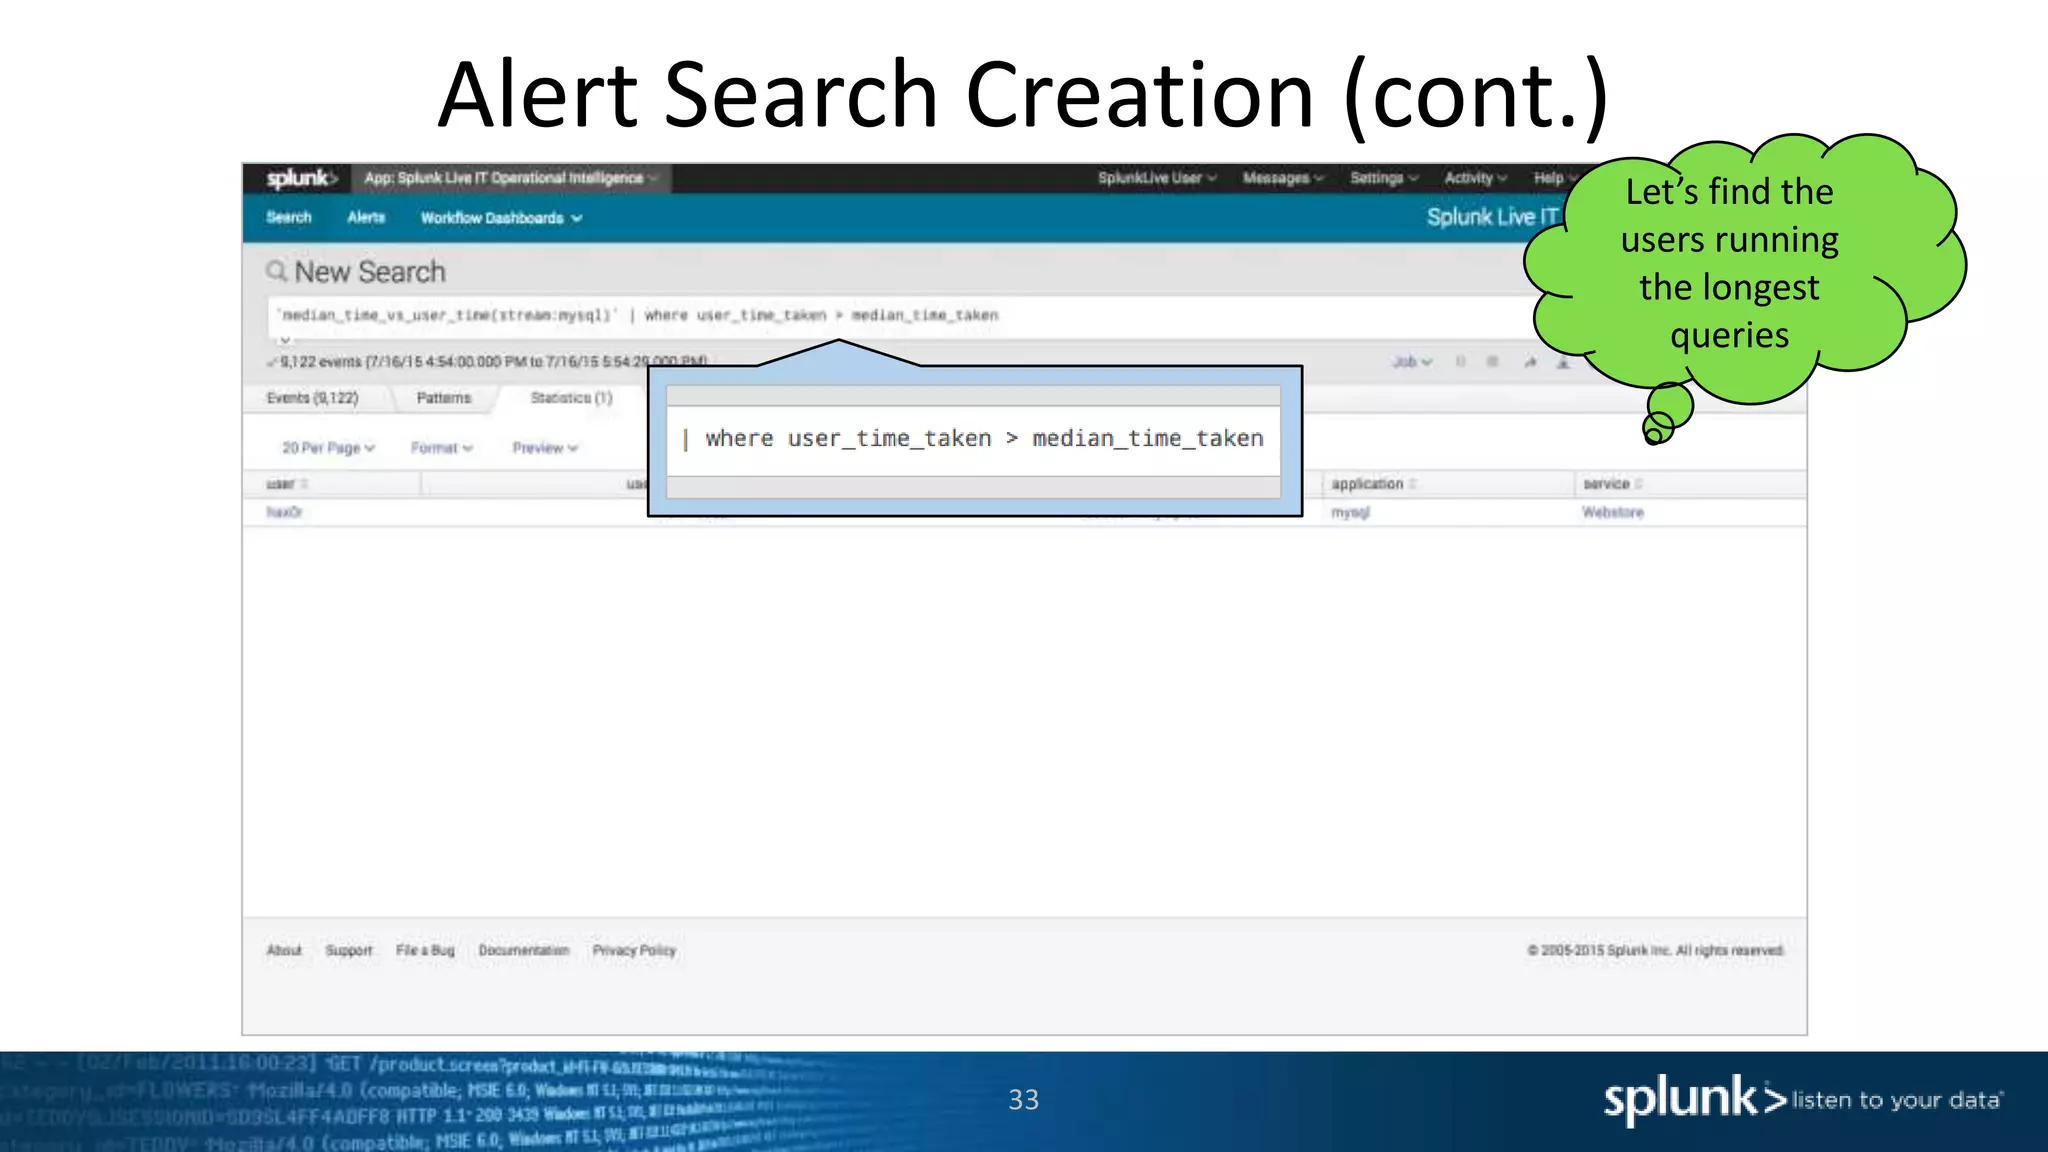
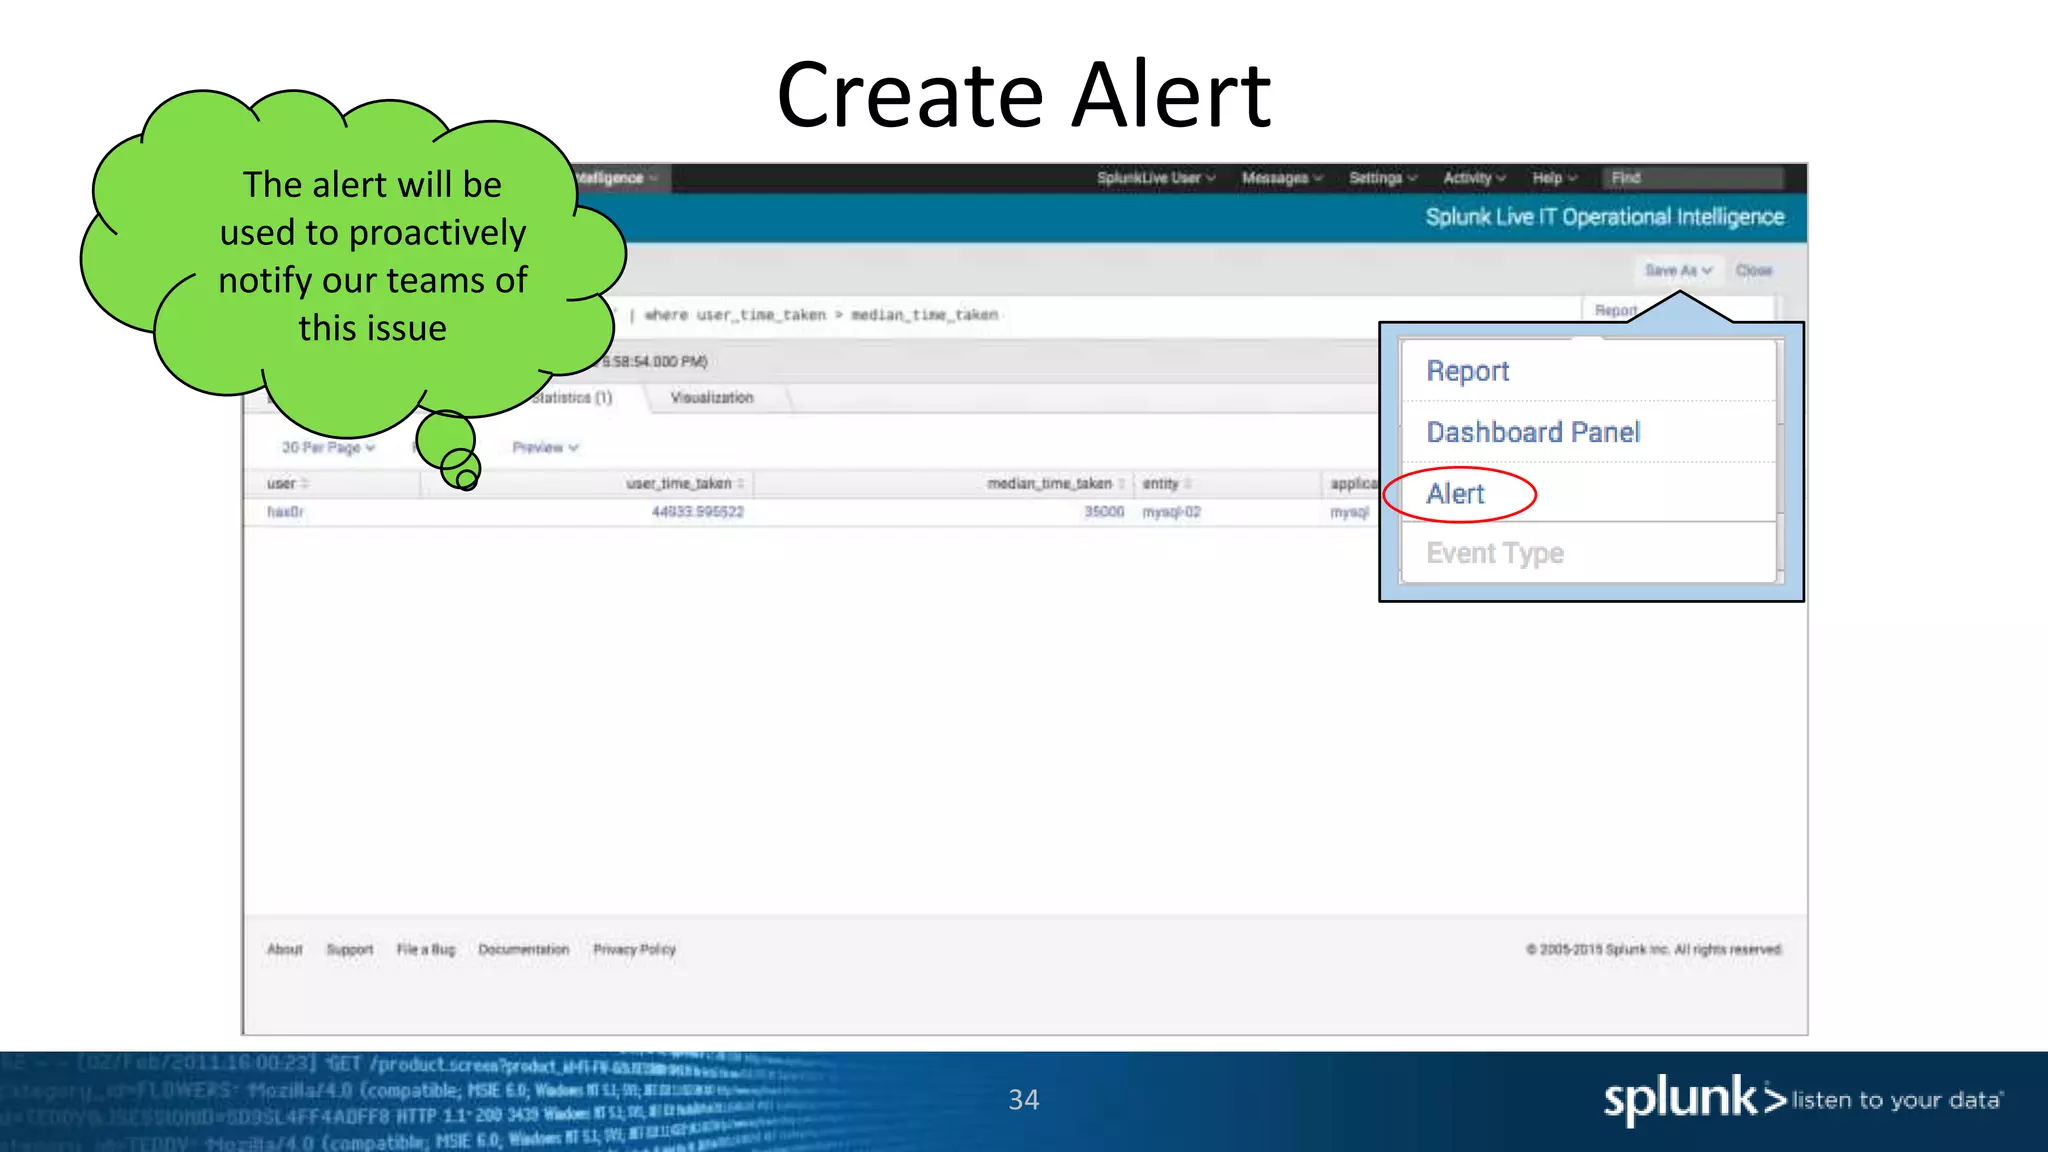
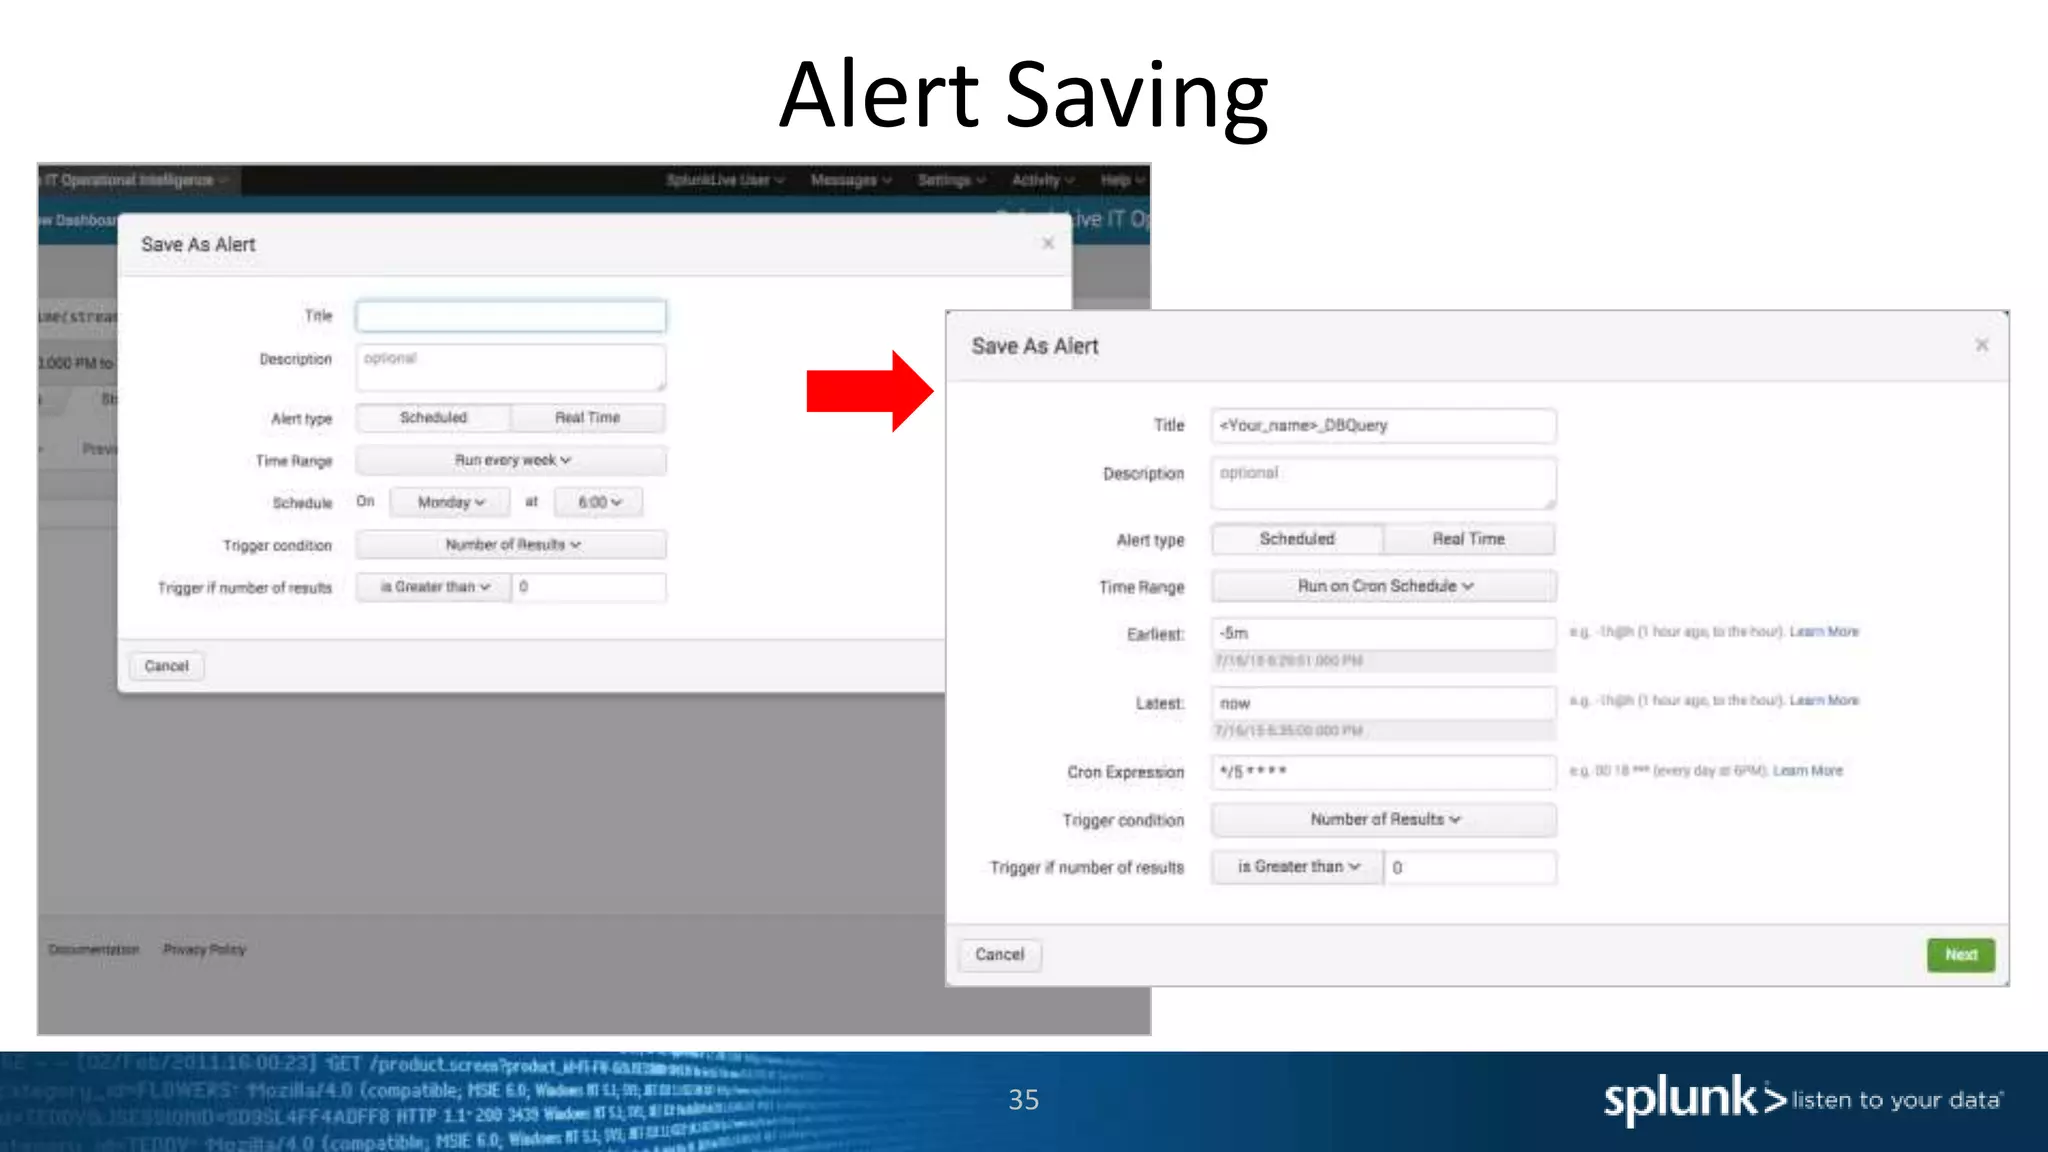
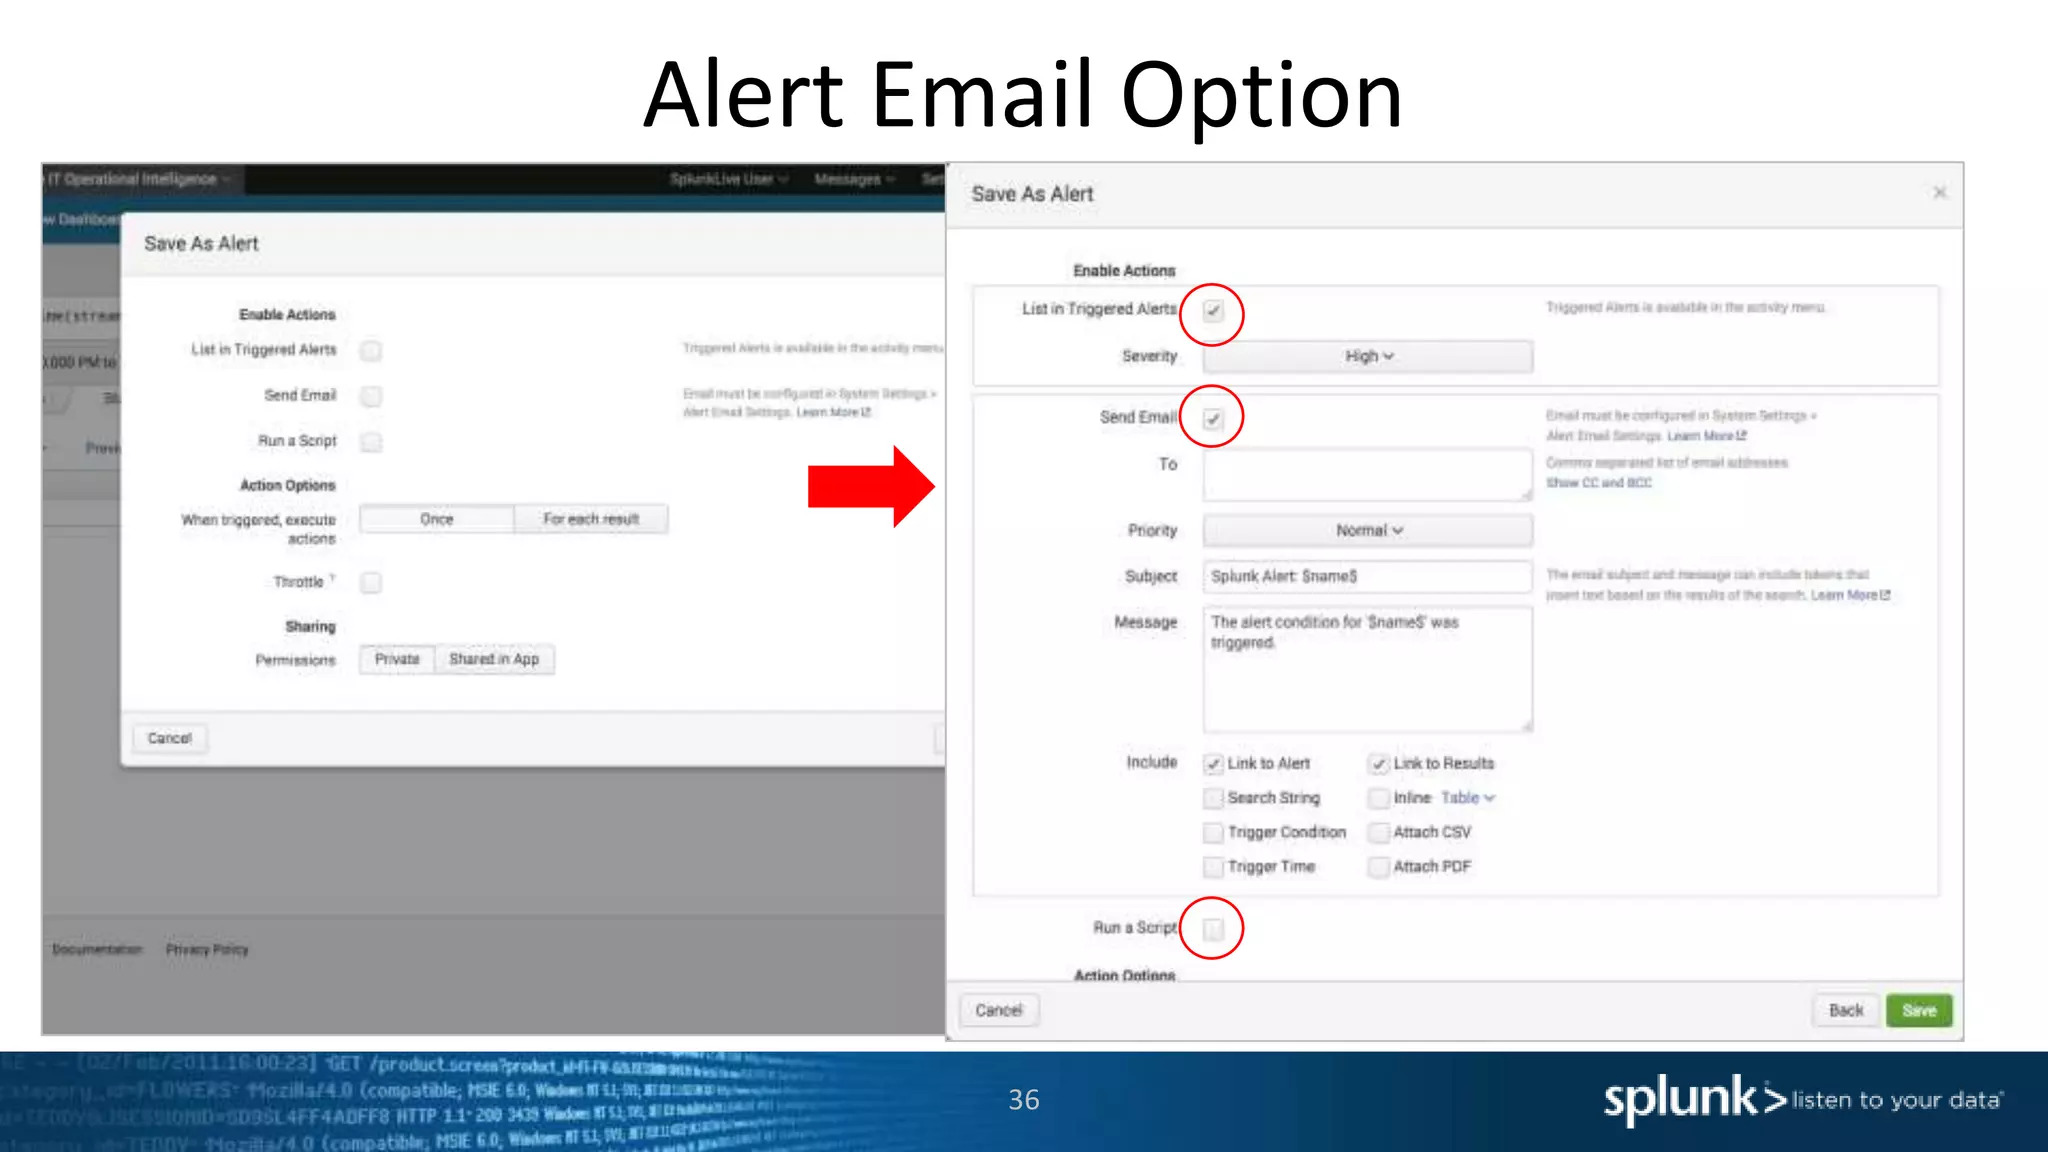
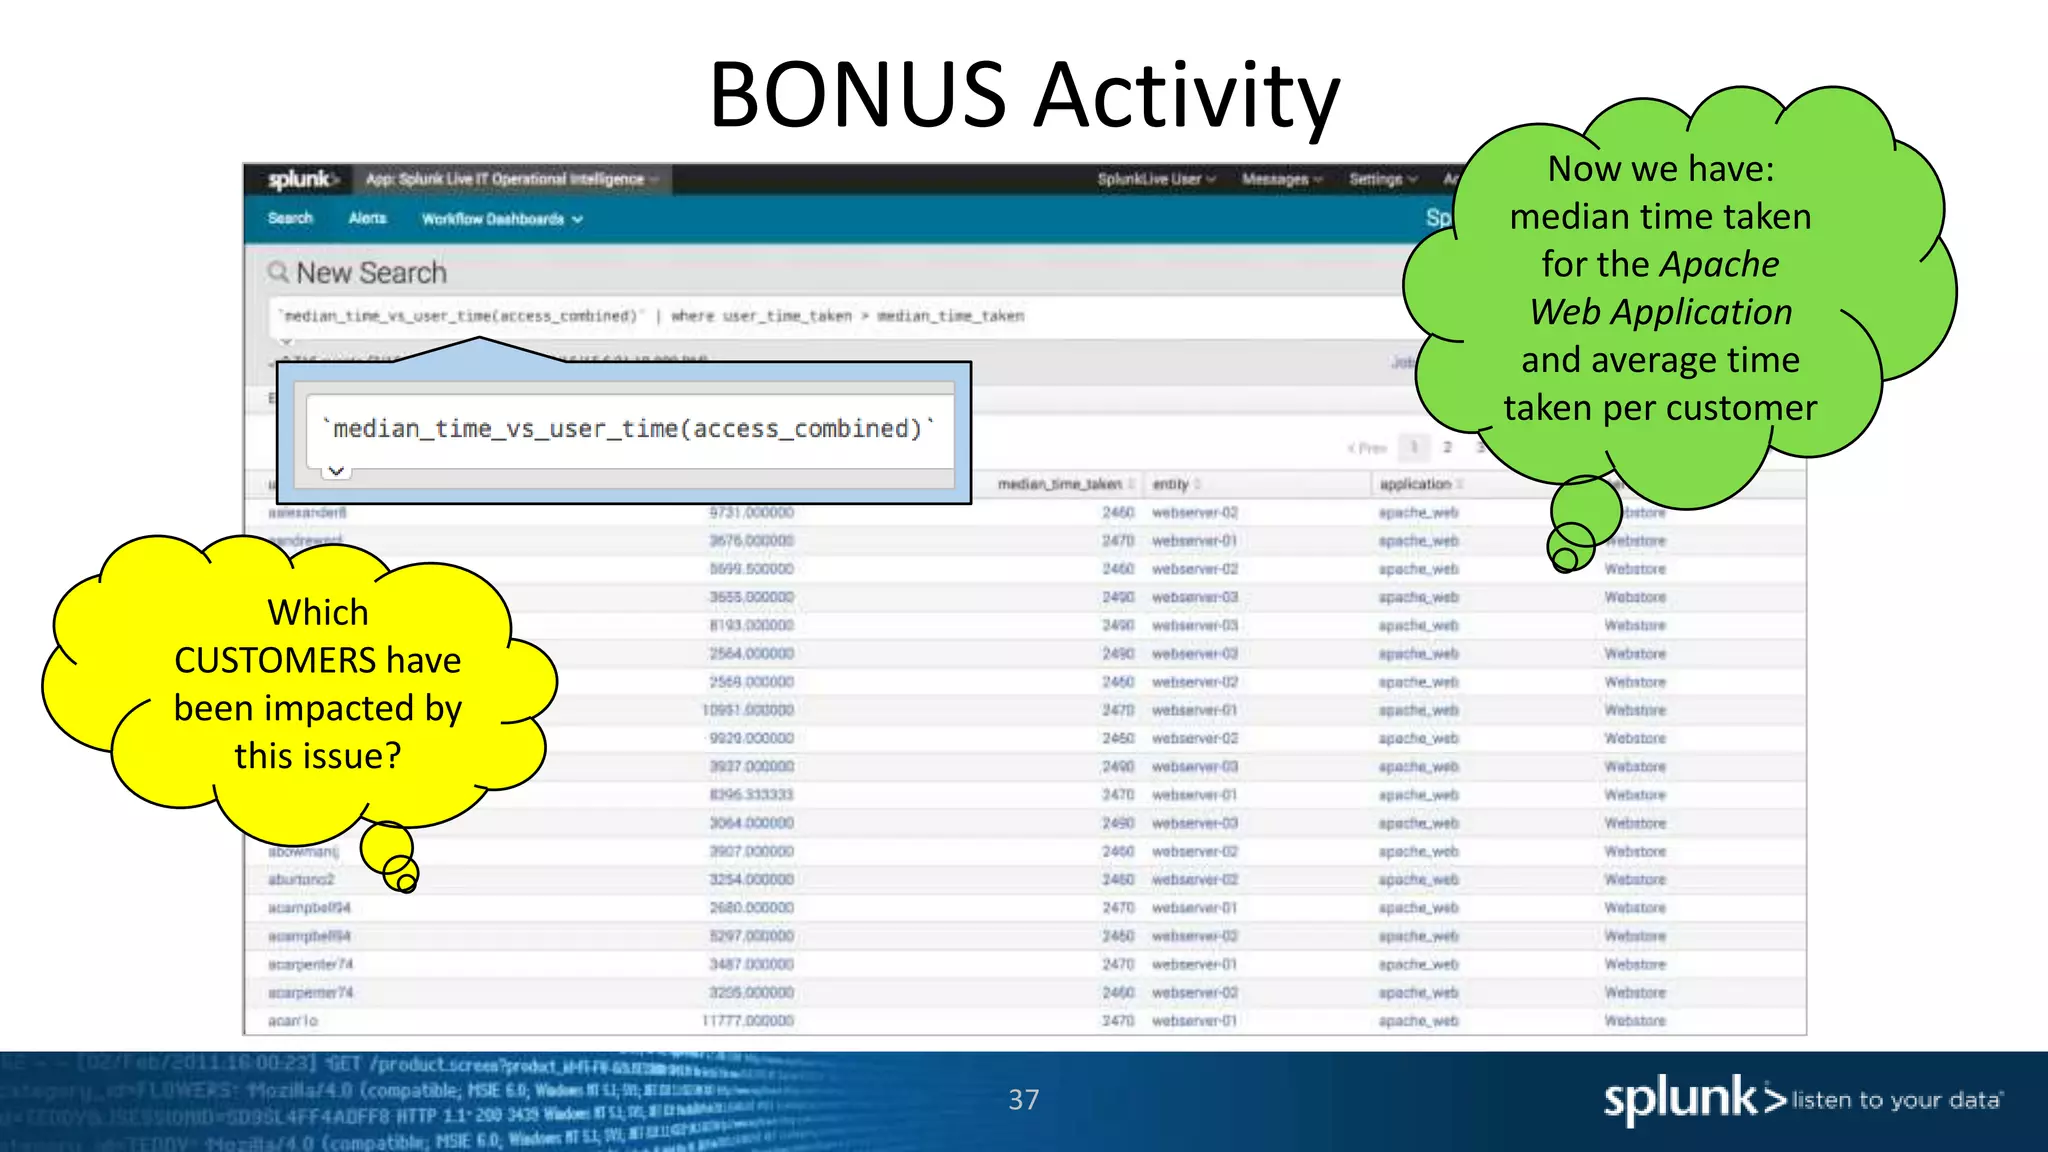
Copyright © 2015 Splunk Inc.
SplunkLive! San Francisco
Splunk for ITOps
Lily Lee – Sr. Sales Engineer
July 15, 2015
Developer Platform (REST API, SDKs)
2
The Focus
Application
Delivery
IT
Operations
Security,
Compliance,
and Fraud
Business
Analytics
Industrial Data
and the
Internet of Things
Turning Machine Data Into Operational Intelligence
Reactive
Search
and
Investigate
Proactive
Monitoring
and Alerting
Operational
Visibility
Proactive
Real-time
Business
Insight
3
Where is Machine Data
Machine Data: Any Location, Type, Volume
Online
Services Web
Services
Servers
Security GPS
Location
Storage
Desktops
Networks
Packaged
Applications
Custom
ApplicationsMessaging
Telecoms
Online
Shopping
Cart
Web
Clickstreams
Databases
Energy
Meters
Call Detail
Records
Smartphones
and Devices
RFID
On-
Premises
Private
Cloud
Public
Cloud
Platform Support (Apps / API / SDKs)
Enterprise Scalability
Universal Indexing
Answer Any Question
Developer
Platform
Report
and
analyze
Custom
dashboards
Monitor
and alert
Ad hoc
search
Common Information Model
What is it?
Why is it important?
What does it mean for the IT Operations Team?
Where is the Splunk fit?
5
Splunk Apps & Add-ons
What is a Splunk app?
What is a Splunk add-on ?
Why do they work?
Where do you put them?
CIM + add-ons = OH YEAH!!!!
6
Definition Refresher
Entity/Host − An infrastructure component or asset that requires
management in order to deliver an IT Service
Applications − A set of Entities that conduct the same activities which require
management in order to deliver an IT Service
Service − Groups of Entities that relate to groups of Applications, Infrastructure
Tiers or Business Services
Key Performance Indicator (KPI) − Measurements that determine how an
IT Entity/Application/Service is performing
Service Level Agreement (SLA) − Measurement which a Service is
expected to deliver
7
Call
Comes In
8
Our admins get a phone call saying we are
having problems with our Webstore
The Dreaded Call!!!
Logging into Splunk
9
If you were born on the … Log into:
1st – 6th https://54.167.49.7
7th –12th https://54.162.102.137
13th – 18th https://54.157.60.103
19th– 24th https://54.157.187.82
25th – 31st https://54.81.97.102
Username: test_user
Password: Password
Yes, we know... we should attend the Security session
Live demonstration
SplunkLive IT Operational Intelligence App
11
Start Searching
12
Oh, don’t forget …
Host = Entity and
Entities make
Applications
Click to see the
Event details
Start Searching – Event Actions
13
Click to see the
event details
Click on Event
Actions
Start Searching – Get Application Information
14
Click to see the
event details
Hosts/Entities  Applications
15
Application Correlation
16
See all the
Application data
in one place
Application Correlation – Details by Host/Entity
17
Application Correlation – Raw Events
18
Application Correlation – Service
19
What is this
“Service”?
Services Dashboard
20
Now we see
the Webstore
Service
details
But can we
visualize all
Services?
Services
21
Services are
comprised of
Applications
Application KPI’s
can be
associated to
Services?
All Services
22
We now have all
Services from the
CMDB(s) and associating
them to Applications
and Entities
Webstore Service Dashboard
Click on Webstore
Service Dashboard
23
The Full Picture
24
We have a map of the
landscape and can select
the different pieces to
quickly understand where
the problem may be
Apache Web  ITOps Apache Web Overview
25
Hmm… lots
of Service
Unavailabl
e
ITOps Apache Web Overview
26
Now we can see
the details and
issues of the
Apache Web
Application
Is it a
regional
issue?
Click on Investigate
Webstore Details
Service Details Dashboard
27
We can see
the correlation
between tiers
How do the
web and app
tiers look?
Database
tier?
Click on Mysql
Application
Database Metrics
28
So, what can we
do? Create a
ticket? An alert?
Run a script?
Send an email?
Create Ticket Workflow
29
Ticket Creation
30
Splunk
pre-populates
Entity/Host,
Application and
Service
Do you have
a ticketing
system?
Create an Alert
31
Can we be
proactively
notified of
this
activity?
Let’s return to
the Database
Metrics
dashboard
Alert Search Creation
32
Now we have:
median time taken
and average time
taken per user
Alert Search Creation (cont.)
33
Let’s find the
users running
the longest
queries
Create Alert
34
The alert will be
used to proactively
notify our teams of
this issue
Alert Saving
35
Alert Email Option
36
BONUS Activity
37
Now we have:
median time taken
for the Apache
Web Application
and average time
taken per customer
Which
CUSTOMERS have
been impacted by
this issue?
Wrapping Up
Common Information Model & Splunk
ITOps Analytics
Why is it important?
How can it help the ITOps Team/Business?
38
Questions?
Resources
• Alerting manual – http://docs.splunk.com/Documentation/Splunk/latest/Alert/Aboutalerts
• Apps & add-ons – https://splunkbase.splunk.com
• Ask questions – http://answers.splunk.com
• Common Information Model – http://docs.splunk.com/Documentation/CIM/latest/User/Overview
• Dashboards and Visualizations –
http://docs.splunk.com/Documentation/Splunk/latest/Viz/Aboutthismanual
• Search macros – http://docs.splunk.com/Documentation/Splunk/latest/Search/UseSearchMacros
• Time modifiers –
http://docs.splunk.com/Documentation/Splunk/latest/SearchReference/SearchTimeModifiers
• Workflow actions –
http://docs.splunk.com/Documentation/Splunk/latest/Knowledge/CreateworkflowactionsinSplunkW
eb
40
41
www.splunk.com/apptitude
July 20th, 2015 submission deadline
42
Register at: conf.splunk.com
The 6th Annual Splunk Worldwide Users’ Conference
September 21-24, 2015  The MGM Grand Hotel, Las Vegas
• 4000+ IT & Business Professionals
• 2 Keynote Sessions
• 3 days of technical content (150+ sessions)
• 3 days of Splunk University
– Get Splunk Certified
– Get CPE credits for CISSP, CAP, SSCP, etc.
– Save thousands on Splunk education!
• 50+ Customer Speakers
• 50+ Splunk Speakers
• 35+ Apps in Splunk Apps Showcase
• 65 Technology Partners
We want to hear your feedback!
After the breakout sessions conclude
Text Splunk to 878787
And be entered for a chance to win a $100 AMEX gift card!

Splunk for ITOA Breakout Session

  • 1.
    Copyright © 2015Splunk Inc. SplunkLive! San Francisco Splunk for ITOps Lily Lee – Sr. Sales Engineer July 15, 2015
  • 2.
    Developer Platform (RESTAPI, SDKs) 2 The Focus Application Delivery IT Operations Security, Compliance, and Fraud Business Analytics Industrial Data and the Internet of Things
  • 3.
    Turning Machine DataInto Operational Intelligence Reactive Search and Investigate Proactive Monitoring and Alerting Operational Visibility Proactive Real-time Business Insight 3
  • 4.
    Where is MachineData Machine Data: Any Location, Type, Volume Online Services Web Services Servers Security GPS Location Storage Desktops Networks Packaged Applications Custom ApplicationsMessaging Telecoms Online Shopping Cart Web Clickstreams Databases Energy Meters Call Detail Records Smartphones and Devices RFID On- Premises Private Cloud Public Cloud Platform Support (Apps / API / SDKs) Enterprise Scalability Universal Indexing Answer Any Question Developer Platform Report and analyze Custom dashboards Monitor and alert Ad hoc search
  • 5.
    Common Information Model Whatis it? Why is it important? What does it mean for the IT Operations Team? Where is the Splunk fit? 5
  • 6.
    Splunk Apps &Add-ons What is a Splunk app? What is a Splunk add-on ? Why do they work? Where do you put them? CIM + add-ons = OH YEAH!!!! 6
  • 7.
    Definition Refresher Entity/Host −An infrastructure component or asset that requires management in order to deliver an IT Service Applications − A set of Entities that conduct the same activities which require management in order to deliver an IT Service Service − Groups of Entities that relate to groups of Applications, Infrastructure Tiers or Business Services Key Performance Indicator (KPI) − Measurements that determine how an IT Entity/Application/Service is performing Service Level Agreement (SLA) − Measurement which a Service is expected to deliver 7
  • 8.
    Call Comes In 8 Our adminsget a phone call saying we are having problems with our Webstore The Dreaded Call!!!
  • 9.
    Logging into Splunk 9 Ifyou were born on the … Log into: 1st – 6th https://54.167.49.7 7th –12th https://54.162.102.137 13th – 18th https://54.157.60.103 19th– 24th https://54.157.187.82 25th – 31st https://54.81.97.102 Username: test_user Password: Password Yes, we know... we should attend the Security session
  • 10.
  • 11.
    SplunkLive IT OperationalIntelligence App 11
  • 12.
    Start Searching 12 Oh, don’tforget … Host = Entity and Entities make Applications Click to see the Event details
  • 13.
    Start Searching –Event Actions 13 Click to see the event details Click on Event Actions
  • 14.
    Start Searching –Get Application Information 14 Click to see the event details
  • 15.
  • 16.
    Application Correlation 16 See allthe Application data in one place
  • 17.
    Application Correlation –Details by Host/Entity 17
  • 18.
  • 19.
    Application Correlation –Service 19 What is this “Service”?
  • 20.
    Services Dashboard 20 Now wesee the Webstore Service details But can we visualize all Services?
  • 21.
  • 22.
    All Services 22 We nowhave all Services from the CMDB(s) and associating them to Applications and Entities
  • 23.
    Webstore Service Dashboard Clickon Webstore Service Dashboard 23
  • 24.
    The Full Picture 24 Wehave a map of the landscape and can select the different pieces to quickly understand where the problem may be
  • 25.
    Apache Web ITOps Apache Web Overview 25 Hmm… lots of Service Unavailabl e
  • 26.
    ITOps Apache WebOverview 26 Now we can see the details and issues of the Apache Web Application Is it a regional issue? Click on Investigate Webstore Details
  • 27.
    Service Details Dashboard 27 Wecan see the correlation between tiers How do the web and app tiers look? Database tier? Click on Mysql Application
  • 28.
    Database Metrics 28 So, whatcan we do? Create a ticket? An alert? Run a script? Send an email?
  • 29.
  • 30.
  • 31.
    Create an Alert 31 Canwe be proactively notified of this activity? Let’s return to the Database Metrics dashboard
  • 32.
    Alert Search Creation 32 Nowwe have: median time taken and average time taken per user
  • 33.
    Alert Search Creation(cont.) 33 Let’s find the users running the longest queries
  • 34.
    Create Alert 34 The alertwill be used to proactively notify our teams of this issue
  • 35.
  • 36.
  • 37.
    BONUS Activity 37 Now wehave: median time taken for the Apache Web Application and average time taken per customer Which CUSTOMERS have been impacted by this issue?
  • 38.
    Wrapping Up Common InformationModel & Splunk ITOps Analytics Why is it important? How can it help the ITOps Team/Business? 38
  • 39.
  • 40.
    Resources • Alerting manual– http://docs.splunk.com/Documentation/Splunk/latest/Alert/Aboutalerts • Apps & add-ons – https://splunkbase.splunk.com • Ask questions – http://answers.splunk.com • Common Information Model – http://docs.splunk.com/Documentation/CIM/latest/User/Overview • Dashboards and Visualizations – http://docs.splunk.com/Documentation/Splunk/latest/Viz/Aboutthismanual • Search macros – http://docs.splunk.com/Documentation/Splunk/latest/Search/UseSearchMacros • Time modifiers – http://docs.splunk.com/Documentation/Splunk/latest/SearchReference/SearchTimeModifiers • Workflow actions – http://docs.splunk.com/Documentation/Splunk/latest/Knowledge/CreateworkflowactionsinSplunkW eb 40
  • 41.
  • 42.
    42 Register at: conf.splunk.com The6th Annual Splunk Worldwide Users’ Conference September 21-24, 2015  The MGM Grand Hotel, Las Vegas • 4000+ IT & Business Professionals • 2 Keynote Sessions • 3 days of technical content (150+ sessions) • 3 days of Splunk University – Get Splunk Certified – Get CPE credits for CISSP, CAP, SSCP, etc. – Save thousands on Splunk education! • 50+ Customer Speakers • 50+ Splunk Speakers • 35+ Apps in Splunk Apps Showcase • 65 Technology Partners
  • 43.
    We want tohear your feedback! After the breakout sessions conclude Text Splunk to 878787 And be entered for a chance to win a $100 AMEX gift card!

Editor's Notes

  • #2 Introduce presenters This presentation covers IT Operations /Analytics. If you are in the wrong presentation we can help you get to the right one. The intent of this “hands-on session” is for us to walk through one of those dreaded 2AM calls, but instead of having a bridge full of people, use Splunk to: - identify the issue - send it to the appropriate team - create a ticket to track our work - create an alert to ensure it does not happen again - reuse the data for our Customer Service team to proactively notify the affected customers and ensure their loyalty   But first, let’s cover a couple slides to set the stage for this – then we can get to the fun stuff.
  • #3 Most companies start using Splunk in one of these 5 areas, and typically as more teams use Splunk it traverses each of these 5 areas. Both IT and business professionals can analyze machine data to get real-time visibility and operational intelligence. With our platform for machine data, organizations can meaningfully improve their performance in a wide range of areas e.g. meet service levels, reduce costs, mitigate security risks, maintain compliance and gain insights.   Today we are going to focus on some of the major use cases and values related to the IT Operations space.
  • #4 In IT Operations, this maturity model is a great template/mainstay when it comes to how Splunk is utilized. Most teams have downloaded Splunk on a laptop and from there it gets scaled to a server and to multiple server, etc. The idea from an ITOps maturity model is very much the same— Search and investigation. Using Splunk, organizations identify and resolve issues up to 70% faster and reduce costly escalations by up to 90%. Splunk is one place to find and fix problems, and investigate incidents across all your IT systems and infrastructure. Proactive monitoring. Monitor IT systems in real time to identify issues, problems and attacks before they impact your customers, services and revenue. Splunk keeps watch of specific patterns, trends and thresholds in your machine data so you don't have to. Trigger notifications in real-time via email or RSS, execute a script to take remedial actions, send an SNMP trap to your system management console or generate a service desk ticket. Operational visibility. See the whole picture, track performance and make better decisions. Visualize usage trends to better plan for capacity; spot SLA infractions, track how you are being measured by the business. Do all of this using your existing machine data without spending millions of dollars instrumenting your IT infrastructure. Real-time business insight. Make better-informed business decisions by understanding trends, patterns and gaining Operational Intelligence from your machine data. See the success of new online services by channel or demographic, reconcile 3rd-party service provider fees against actual use, find your heaviest users and heaviest abusers, and more. Because machine data captures every behavior, the possibilities are game changing. You'll find the lead times to get to this intelligence dramatically less than other solutions - measured in minutes/hours instead of months.   Who is at Search and Investigate? Raise your Hands. Proactive Monitoring and Alerting? Raise your Hands. Operational Visibility? Raise your Hands. Real-time Business Insight? Raise your Hands. Who thinks it makes sense for all of us to have our business at Real-time Business Insight? Why? So how do we get there?
  • #5 Splunk is a platform that consists of multiple products and deployment models to fit your needs. Splunk’s capability to ingest all machine data and allow users to quickly analyze it for insight is it’s most compelling feature. We call this the universal machine data platform. For this hands-on demo, we are going to focus on Splunk Enterprise/Splunk Cloud: Splunk Enterprise – used for on-premise deployments Splunk Cloud – A managed service with all the capabilities of Splunk Enterprise…in the Cloud with a 100% SLA
  • #6 What: The Common Information Model (CIM) allows you to normalize your data to match a common standard, using the same field names and event tags for equivalent events from different sources or vendors. Why: The CIM acts as a search-time schema ("schema-on-the-fly") to allow you to define relationships in the event data while leaving the raw machine data intact. Once you have normalized the data from multiple different source types, you can develop reports, correlation searches, and dashboards to present a unified view of a data domain. You can display your normalized data in the dashboards provided by other Splunk-developed applications such as the Splunk App for Enterprise Security and the Splunk App for PCI Compliance. What does it mean for ITOps: - Heterogonous environments - Who has only one type of server, storage, switch, firewall, database? Where is the Splunk Fit: Splunk’s schema-on-the-fly harnesses this capability to rename/alias common field names and event tags for equivalent events from different sources or vendors to provide a singular view of Storage, CPU (windows & *nix), etc.
  • #7 What is a Splunk App: A Splunk App is a prebuilt collection of dashboards, panels and UI elements powered by saved searches and packaged for a specific technology or use case to make Splunk immediately useful and relevant to different roles. What is a Splunk Add-on: Capture/index data, identify relative events, field extractions, tags, CIM compliancy Why do they work: They come prepackaged with inputs, props, transforms to standardize the retrieval of the data, indexing of data, search-time extractions, saved searches, macros, etc. Where do you put them: The documentation should tell you where to put them. For example, *nix add-on goes on forwarder, indexer, search head, deployment server CIM + Add-ons = ITOps Fast Time To Value for not only the events, alerts, and correlation but also providing development/business and other teams the ability to see IT in a single location.
  • #8 Definitions – These are pretty standard vernaculars. Feel free to raise your hand if you have questions. During this discussion, these are what we will be using to discuss the framework put into place.   Bonus question – Why do we have KPI’s / SLA’s? Can we use them to measure impact of introducing Splunk to the ITOps Team?   Alright, now to the fun stuff…. Remember we will be working through the 2AM call
  • #9 How many of you have experienced this in your career? Raise your hands. Anyone care to share an example? Network problems? Capacity problems? Database Problems? Let’s pull out our laptops and log into Splunk. For our hands-on exercise — we have received a call that one of our Services called “Webstore” is experiencing issues customer’s are not able to complete orders the blame game may have started with the different internal teams
  • #10 Username: test_user Password: Password (with a capital P) Alright, let’s get everyone logged in. Once you are logged in, just go ahead and look up toward the stage. If you experience an issue, please raise your hand and we can come help you out.
  • #12 Okay, let’s start with the basics and type in index=oidemo We have all seen similar datasets right? We can see we have 6-7 different sourcetypes… Some web logs, some json, some system logs, etc… of different varieties, variability, velocity, and volume
  • #13 Oh, don’t forget that Host = Entity So what? It is important to see how they relate to one another. Let’s think about “Entities make Applications” So what’s next? Let’s all choose an event and open it up. It’s pretty great that we have the different fields being extracted at search time from the data, but how much more useful to us if we were able to understand on the fly what applications this entity/host was associated with?   Let’s click on the “Event Action”. <Briefly describe Splunk workflow actions> Look at that! We can see “Get Application Information”. Let’s click on it.  
  • #14 Oh, don’t forget that Host = Entity So what? It is important to see how they relate to one another. Let’s think about “Entities make Applications” So what’s next? Let’s all choose an event and open it up. It’s pretty great that we have the different fields being extracted at search time from the data, but how much more useful to us if we were able to understand on the fly what applications this entity/host was associated with?   Let’s click on the “Event Action”. <Briefly describe Splunk workflow actions> Look at that! We can see “Get Application Information”. Let’s click on it.  
  • #15 Oh, don’t forget that Host = Entity So what? It is important to see how they relate to one another. Let’s think about “Entities make Applications” So what’s next? Let’s all choose an event and open it up. It’s pretty great that we have the different fields being extracted at search time from the data, but how much more useful to us if we were able to understand on the fly what applications this entity/host was associated with?   Let’s click on the “Event Action”. <Briefly describe Splunk workflow actions> Look at that! We can see “Get Application Information”. Let’s click on it.  
  • #16 I know we are supposed to be troubleshooting our issue. Trust me this foundational detail will help us understand how we can track an event from the Host to Application and maybe even beyond. So quickly - Everyone can see that we have the Host/Entity as the name associated with the event. And we can see that the Entity is associated with application <blah> and look there are other host/entities also associated.   Let’s click on the timechart graph anywhere and see if we can have Splunk show us the event counts based on the individual hosts/entities we see above instead of all together?
  • #17 Nice! Now we can see the individual host/entity details – the raw events – and even better the service which this host/entity is part of. Again, let’s do some drilldown and click the Service in blue, maybe it will tell us what other hosts/entities are associated with this Service.
  • #18 Nice! Now we can see the individual host/entity details – the raw events – and even better the service which this host/entity is part of. Again, let’s do some drilldown and click the Service in blue, maybe it will tell us what other hosts/entities are associated with this Service.
  • #19 Nice! Now we can see the individual host/entity details – the raw events – and even better the service which this host/entity is part of. Again, let’s do some drilldown and click the Service in blue, maybe it will tell us what other hosts/entities are associated with this Service.
  • #20 Nice! Now we can see the individual host/entity details – the raw events – and even better the Service which this host/entity is part of. Again, let’s do some drilldown and click the Service in blue, maybe it will tell us what other hosts/entities are associated with this Service.
  • #21 Let’s pause for a minute, I know we did a lot of clicking and want to ensure everyone is where we are. Does anyone have questions? (Hope someone asks how Splunk is mapping the Entity-Application-Service) If not ask: ”Does anyone know how Splunk understands the relationship (Entity-Application-Service)?”   Let’s take a moment to discuss a CMDB? Does anyone want to share with the group their definition of CMDB? Anyone happen to have this correlation in Splunk in their company? Anyone want to share why this may be important to your organization? Would it be awesome to be able to visualize ALL Services?   Let’s click on the drop down and select “All”.   Awesome! We have “All” the Services
  • #22 So we discussed SLA and KPI in our definitions right? Would this mapping be valuable to alerting, reporting, and visualizing those? If we understand the underlying entities/hosts we can use that detail in our searches to define what is important? Things like if one machine is having high CPU but the other two are fine, do we need an alert? Unknown but now we are able to think like that rather than maybe a more conventional – “We need to know if a machine has CPU over 85% Utilization”?
  • #23 So enhancing our data w/ the CMDB relationships gives us what?
  • #24 So now to the troubleshooting – Let’s click on the Webstore Service Dashboard
  • #25 This is a customized dashboard for the items important to our NOC Entities/Hosts -> Applications ->Services We can evaluate the individual components that make up a Service from Host components to Network/Storage/Compute Why is this important? Improve MTTR Capacity planning Everyone gets on the same page Eliminate blame and finger pointing
  • #26 Click “Apache Web” -> “ITOps Apache Web Overview”
  • #27 We have a division of response codes? Everyone familiar with the 200s, 300s, 400s, and 500s codes? We can see that we are experiencing both successful and errorring connections at all geographical points, so we can rule out a regional issue. The major issue is that we have a large number of “Service Unavailable.” Maybe this is a downstream issue, there is a middleware and database tier that also make up this this Service. Let’s get down in the weeds.   Click on “Investigate Webstore Details”  
  • #28 Um, this is interesting – Anyone want to tell me which one of these Applications is not like the others? Our transactions across Apache Web and our Middleware are in the Green, but WOW, the Database looks to be having issues. Oh, nice! someone is running a number of expensive queries. Let’s dive into MySQL.   Click on “Mysql Application”
  • #29 Now we can see the relevant details for the MySQL details – The current Searches – Search Duration – CPU – Memory details by User. So what can we do?
  • #30 Okay, so we have an idea of “What is happening”. We are investing our time and need to make sure we have visibility to the issue. Does it make sense to create a ticket? We can make use of “Event Actions” to do exactly that - “Action on the event”. Let’s click on the hax0r’s expensive query – Splunk’s token searches to the rescue! Let’s open this first event – click “Event Actions”. Nice! We have the ability to “Create Ticket”   Click “Create Ticket”
  • #31 This is “ACME” Ticket Creation because Splunk has this capability with any ticketing system. We have apps to integrate with some of the more popular ticketing systems, like ServiceNow. but this is easily built into even a custom ticketing system. Even better, Splunk has already started filling out the ticket details. Let’s finish the process.   Complete the details (Username, Criticality and Details)   Click Submit and refresh the page to shows and validate that the ticket was submitted successfully   Everyone able to create a ticket?
  • #32 That is pretty awesome, but that is just for our team’s tracking. Let’s go back to the previous tab. Close the Ticket Creation window/tab. Click on the tab/window for “Database Metrics” dashboard Let’s do something a bit more beneficial so we are not waking up if this happens again. I think we should make an alert for this event but how? Ahh lets try “Event Actions” just maybe?   Click “Event Actions”. Nice, there it is! “Create Alert” Ahh, another pop-out window and we are back at Search – Let’s create that alert.
  • #33 We can see this macro is building a statistics table per user for – median time of query and median time over all time. So, let’s take that detail and see if we can find the user(s) that are running queries over the median time.
  • #34 Add “| where user_time_taken > median_time_taken” to the search string and click search
  • #35 There is the user hax0r. Now to save the alert – click “Save as” – then select “Alert”  
  • #36 Give the Alert a Title: <yourname>User_DBQuery Description: <Your Choice> Alert Type: Scheduled Time Range: at <now + 5m> Trigger conditions: Defaults Click Next
  • #37 List in Triggered Alerts: Check Send Email: Check To: <your email> Priority: Default Subject: Default Message: Default Include: Your Choice Run A Script? Discuss that a simple script could be called here to connect to the MySQL server to stop this user’s query due to it’s duration and intensity. Would that be beneficial? A self-healing activity?   When Triggered: Default Click Save
  • #38 Return to Search In the search bar, replace “stream:mysql” with “access_combined” The results of this search will provide a list of all CUSTOMERS which have been impacted by this issue. This list of CUSTOMERS can be sent to the Customer Service Team for follow-up. Perhaps sending a proactive email to explain that the organization was aware of the issue and apologizes, etc. Maybe mention with this effort that ITOps is now providing near real-time CUSTOMER benefit and value Customer Loyalty. Is this an example of real-time business insight?
  • #39 Reiterate – ITOps Analytics CIM Splunk add-ons/apps ITOps/Business synergy
  • #42 Splunk Apptitude is live and open. Enter as an individual, a group of two or more individuals (a “Team”), or as an Organization to win more than $150,000 in cash and prizes. For entries in the Social Impact category, the data set must consist of “open data” – meaning data that is publically available and free to use, reuse and distribute. Last day to submit is July 20th, 2015. We'll announce the winners at Black Hat in August. Good luck!
  • #43 And finally, I would like to encourage all of you to attend our user conference in September. 2 inspired Keynotes – General Session and Security Keynote 150+ breakout sessions addressing all areas and levels of Operational Intelligence – IT, Business Analytics, Mobile, Cloud, IoT, Security…and MORE! Join the 50%+ of Fortune 100 companies who attended .conf2014 to get hands on with Splunk. You’ll be surrounded by thousands of other like-minded individuals who are ready to share exciting and cutting edge use cases and best practices. You can also deep dive on all things Splunk products together with your favorite Splunkers. Head back to your company with both practical and inspired new uses for Splunk, ready to unlock the unimaginable power of your data! Arrive in Vegas a Splunk user, leave Vegas a Splunk Ninja!