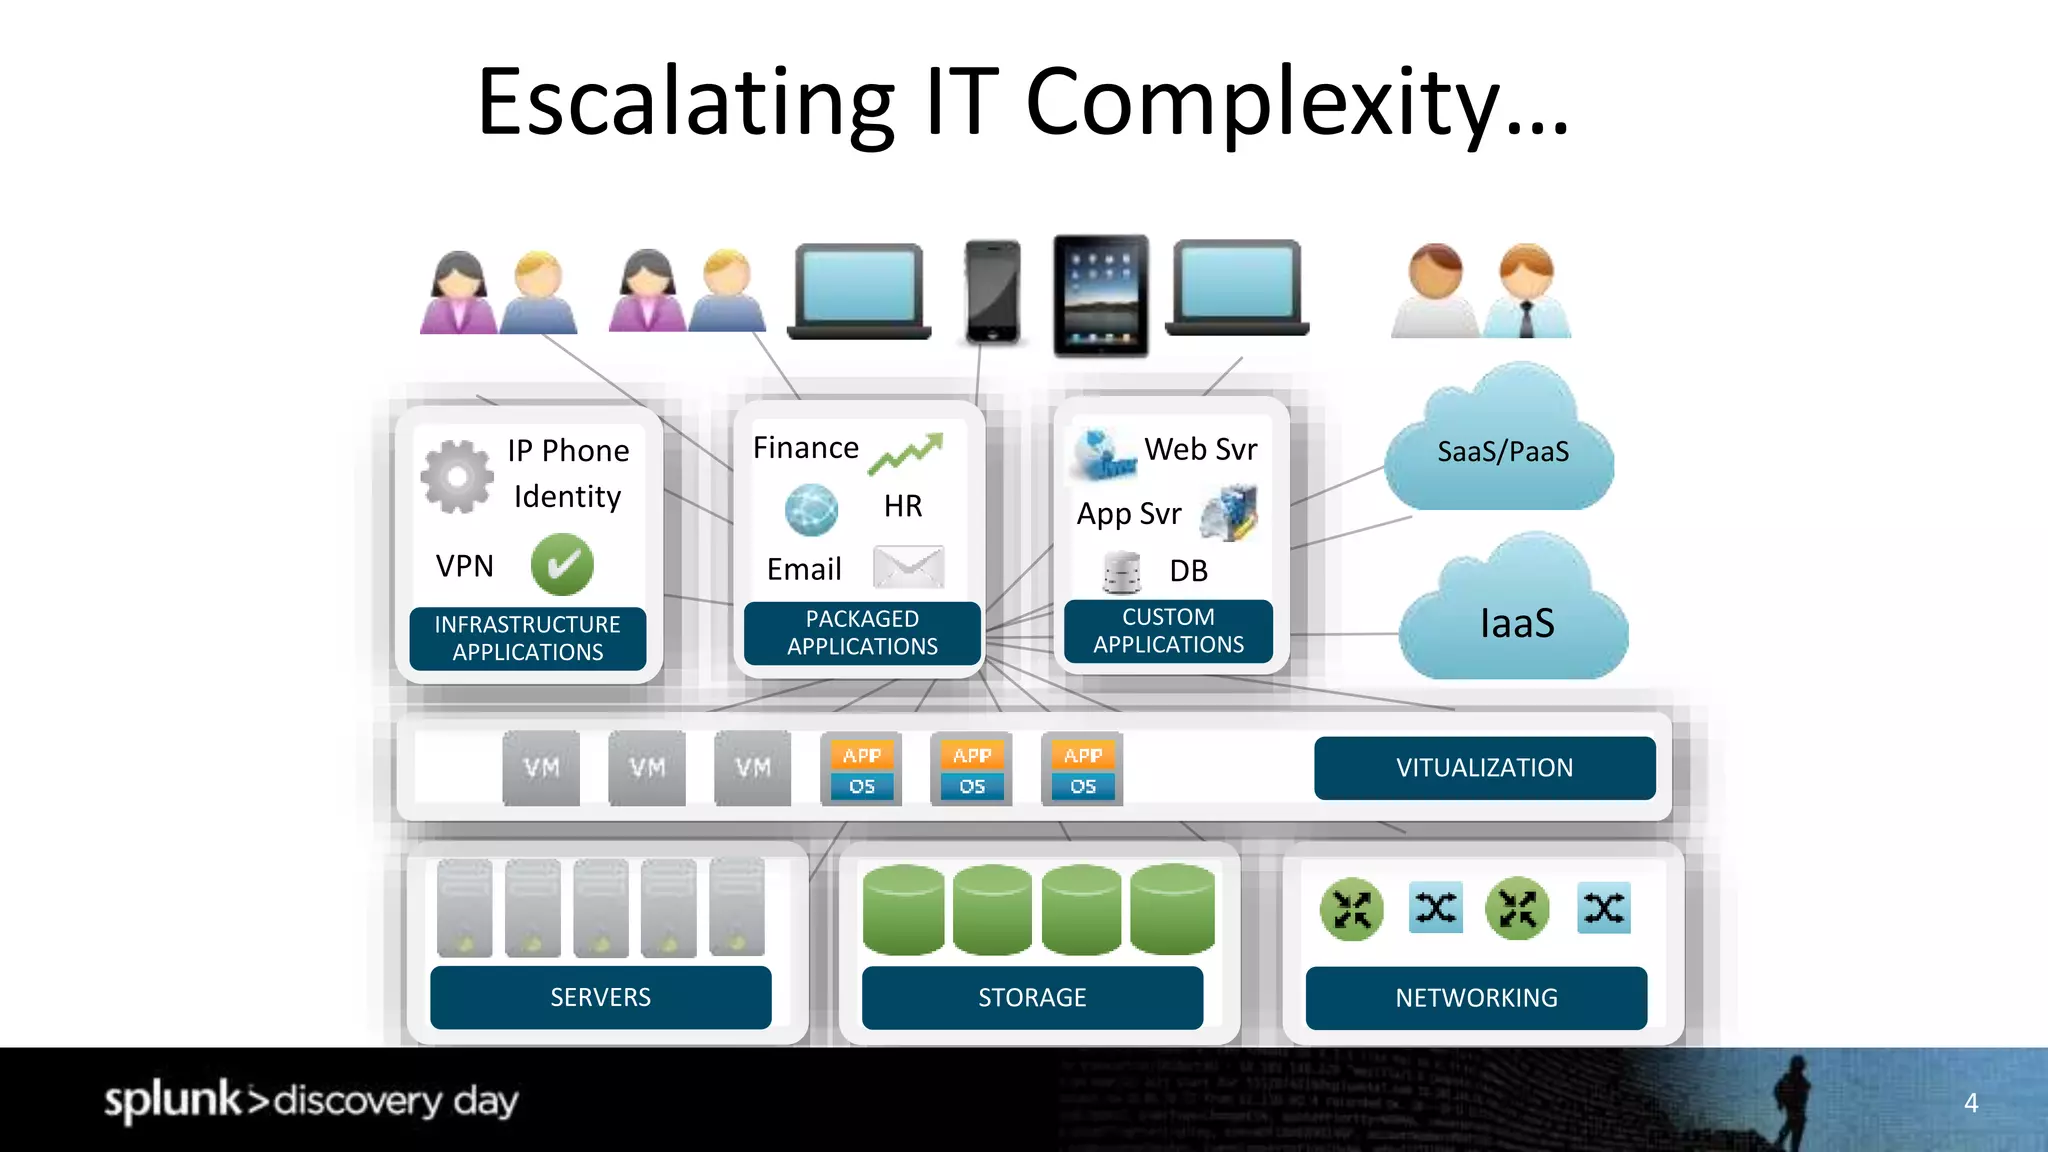
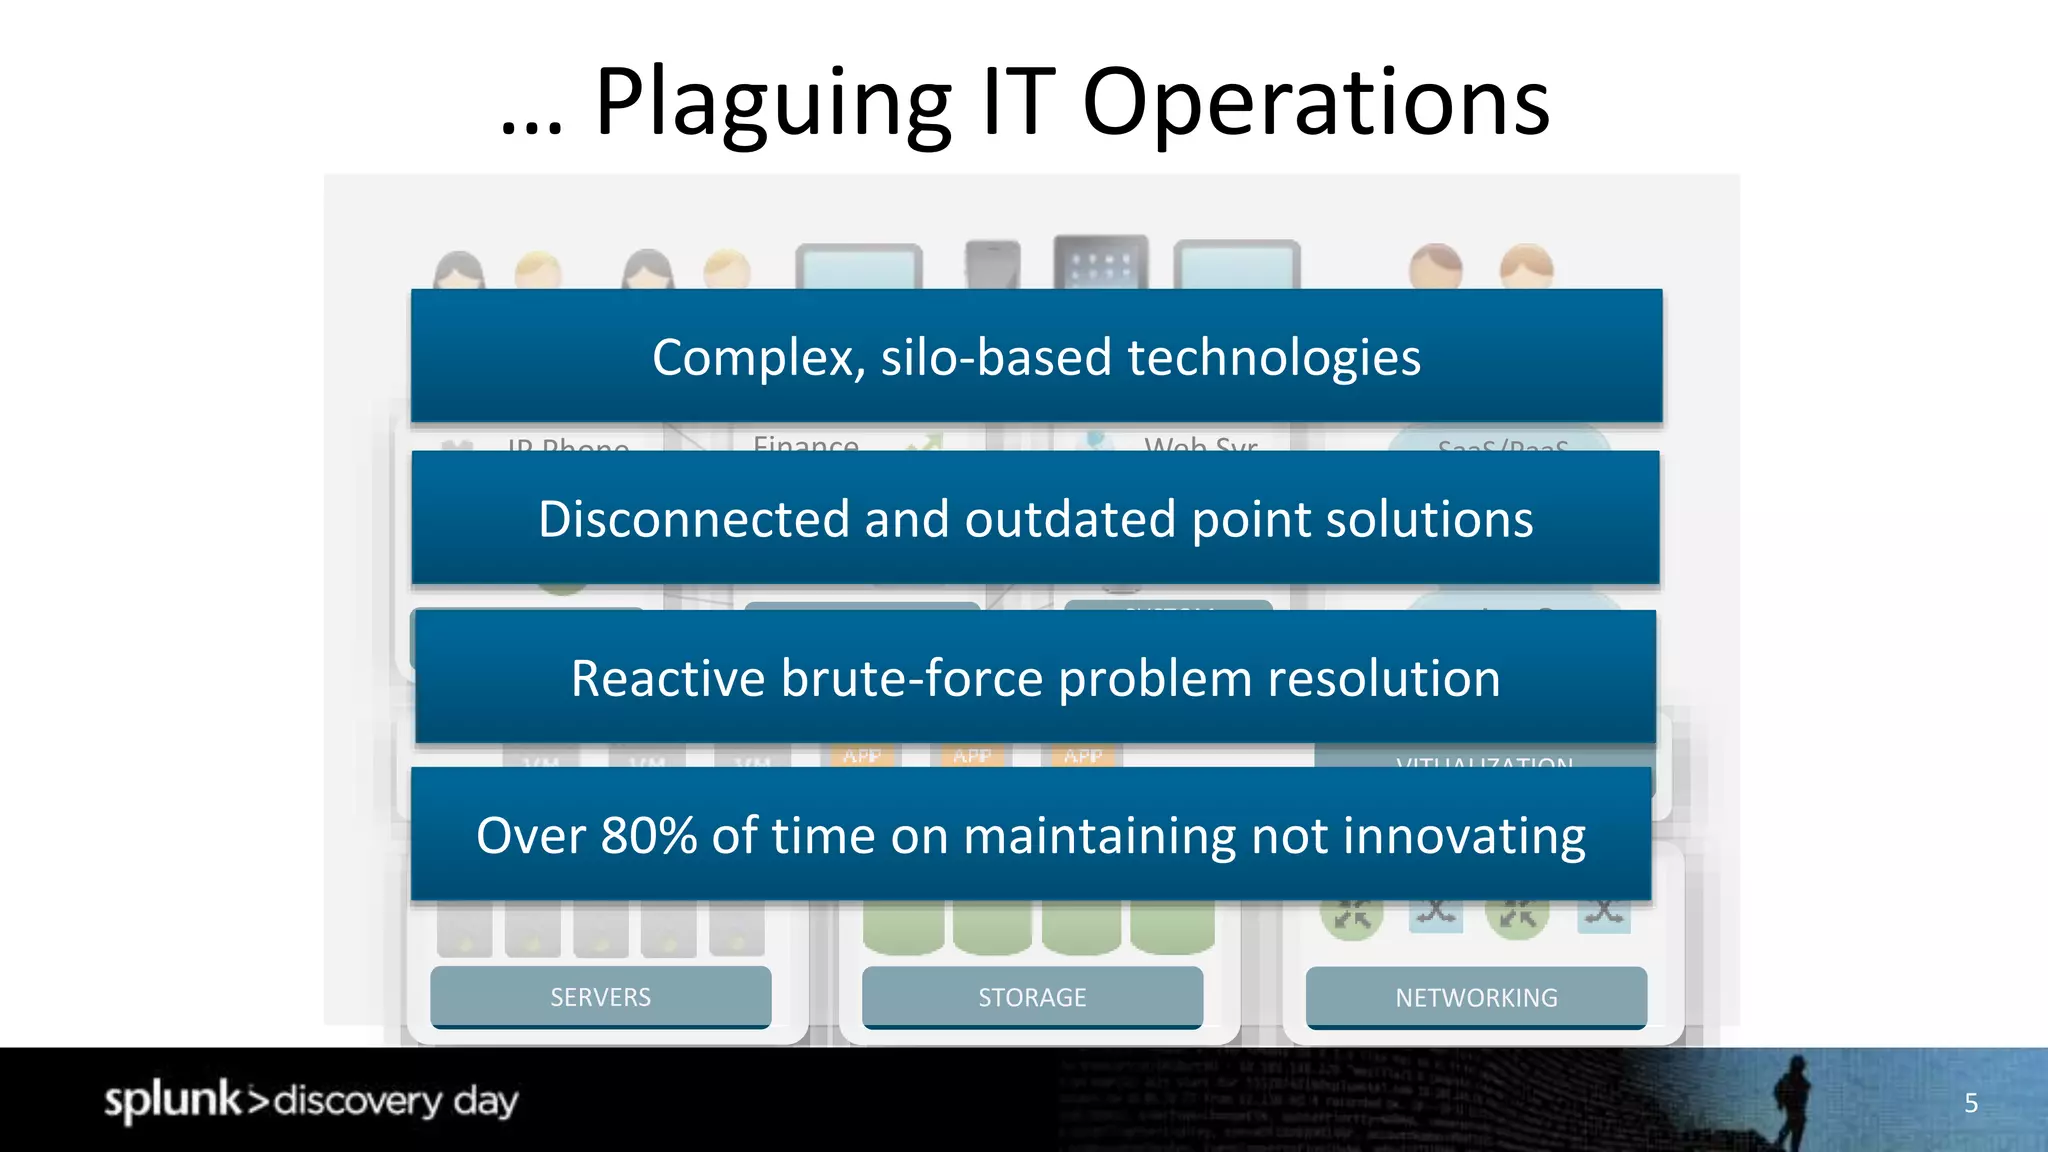
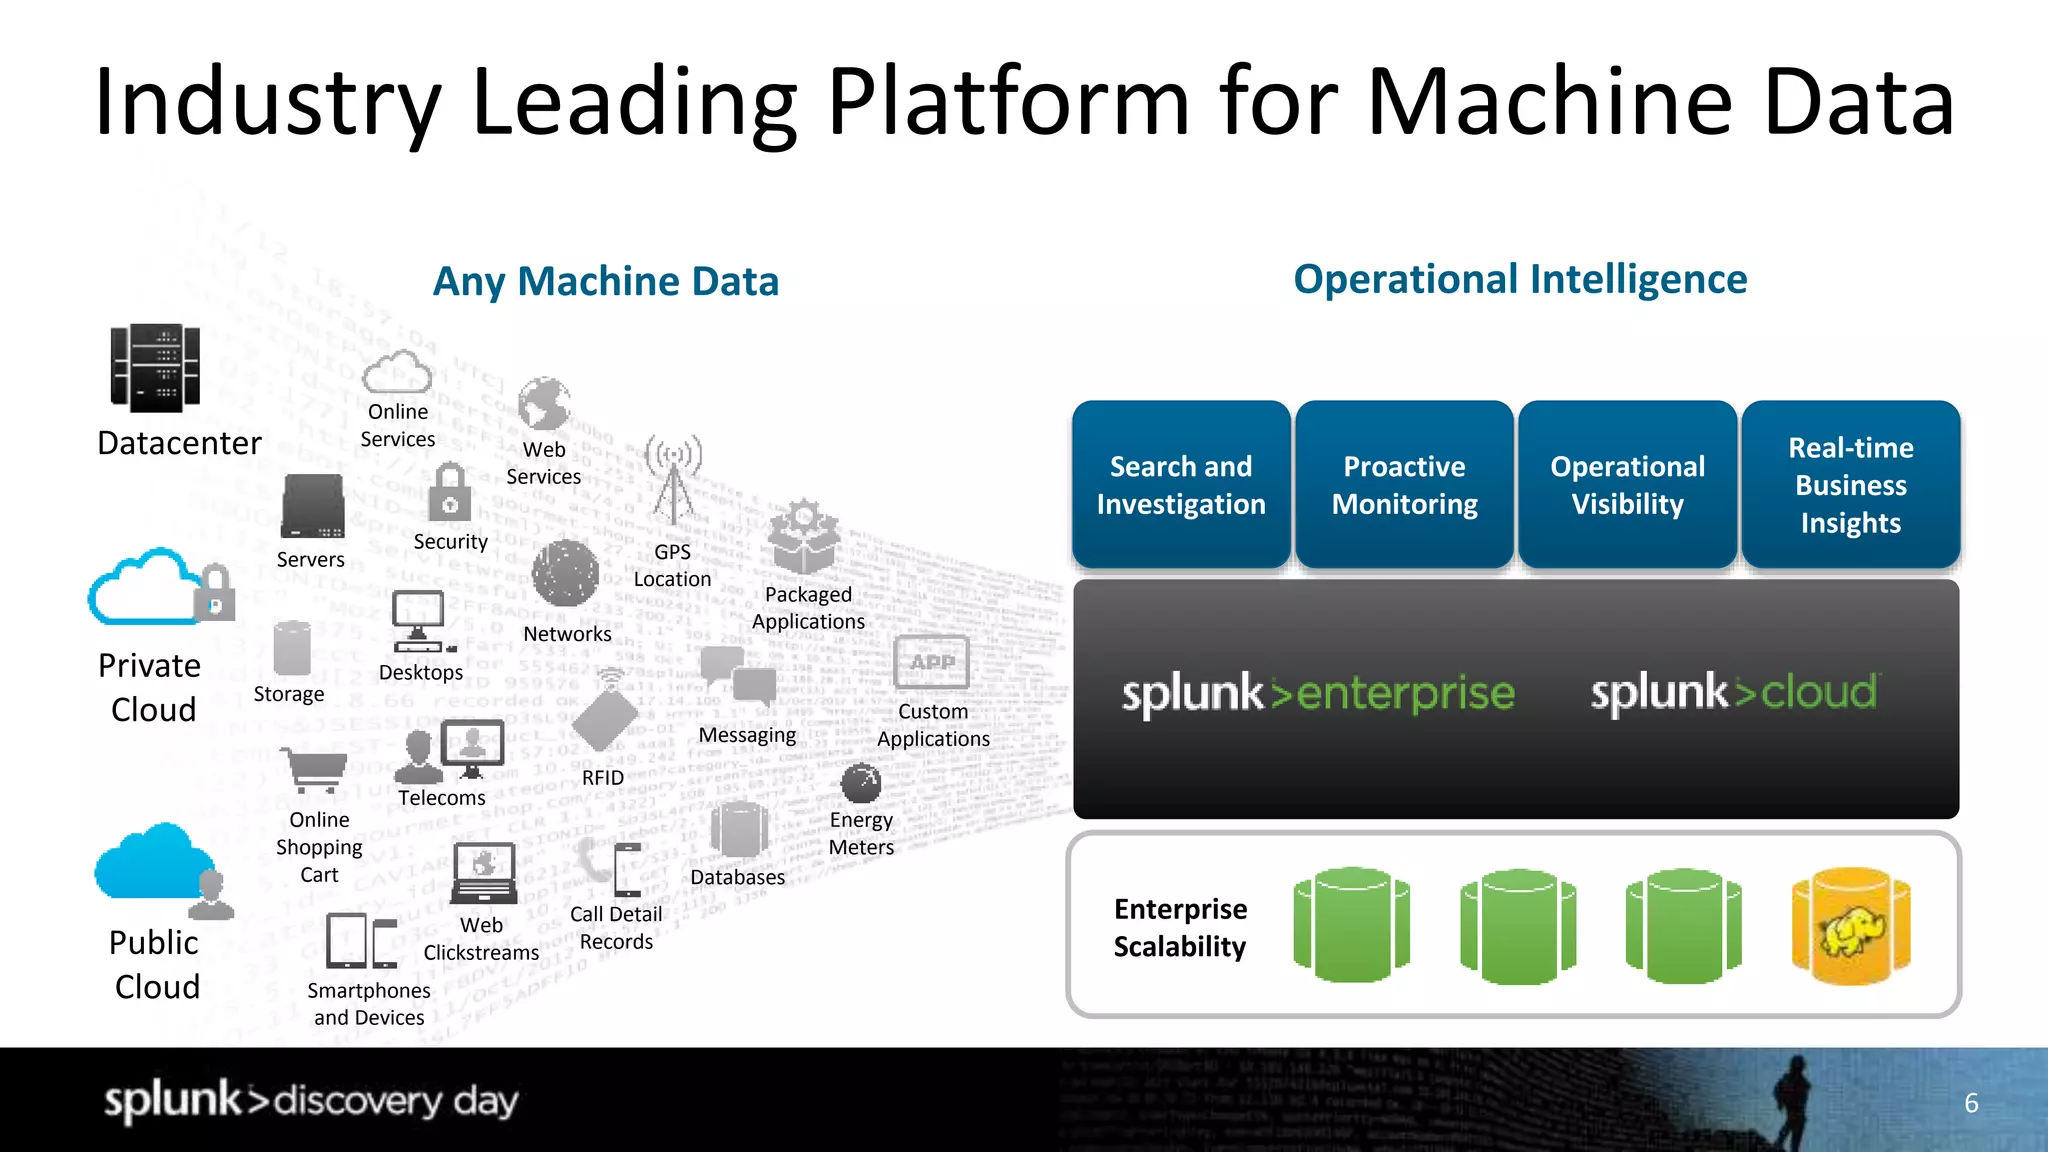
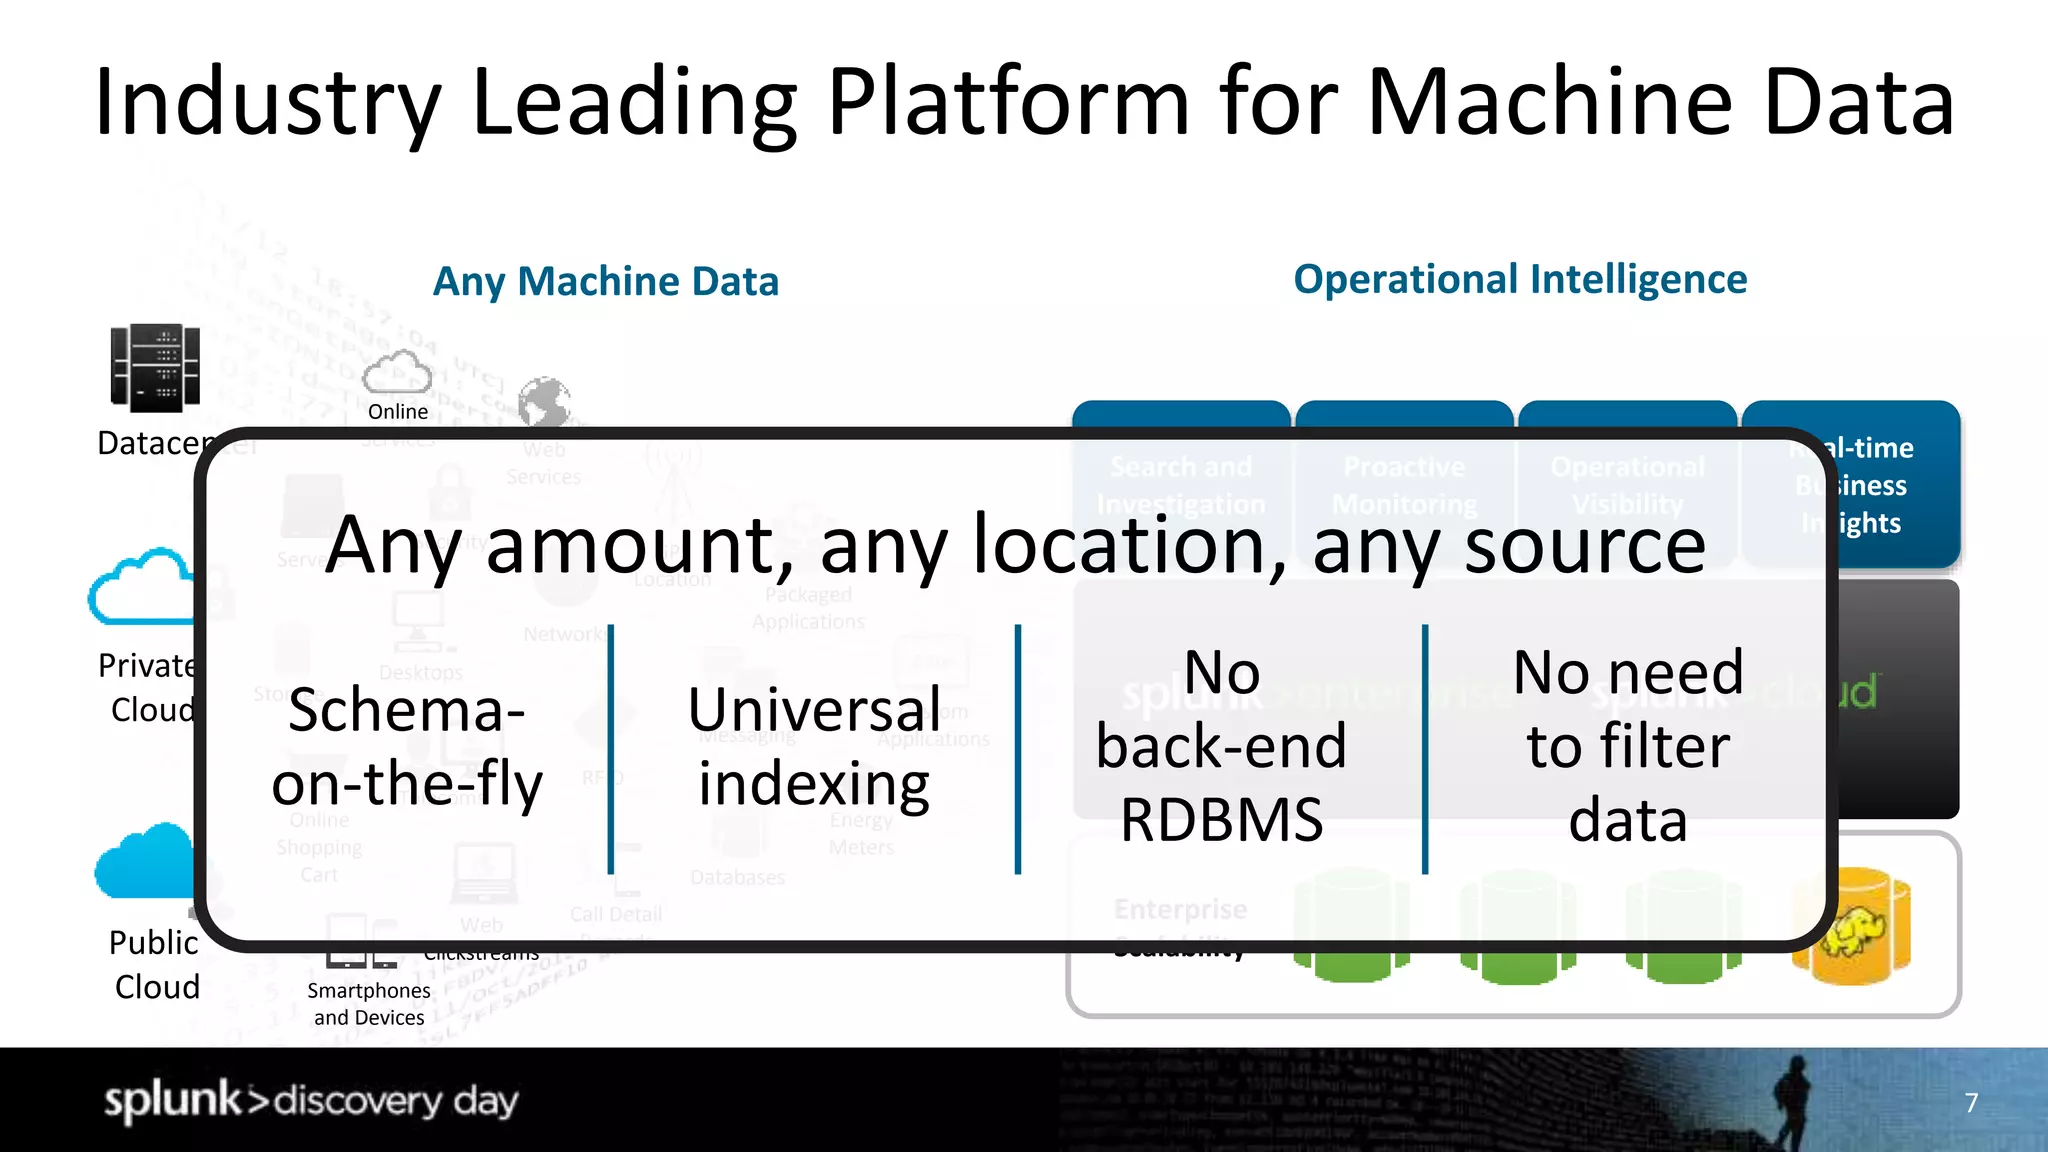
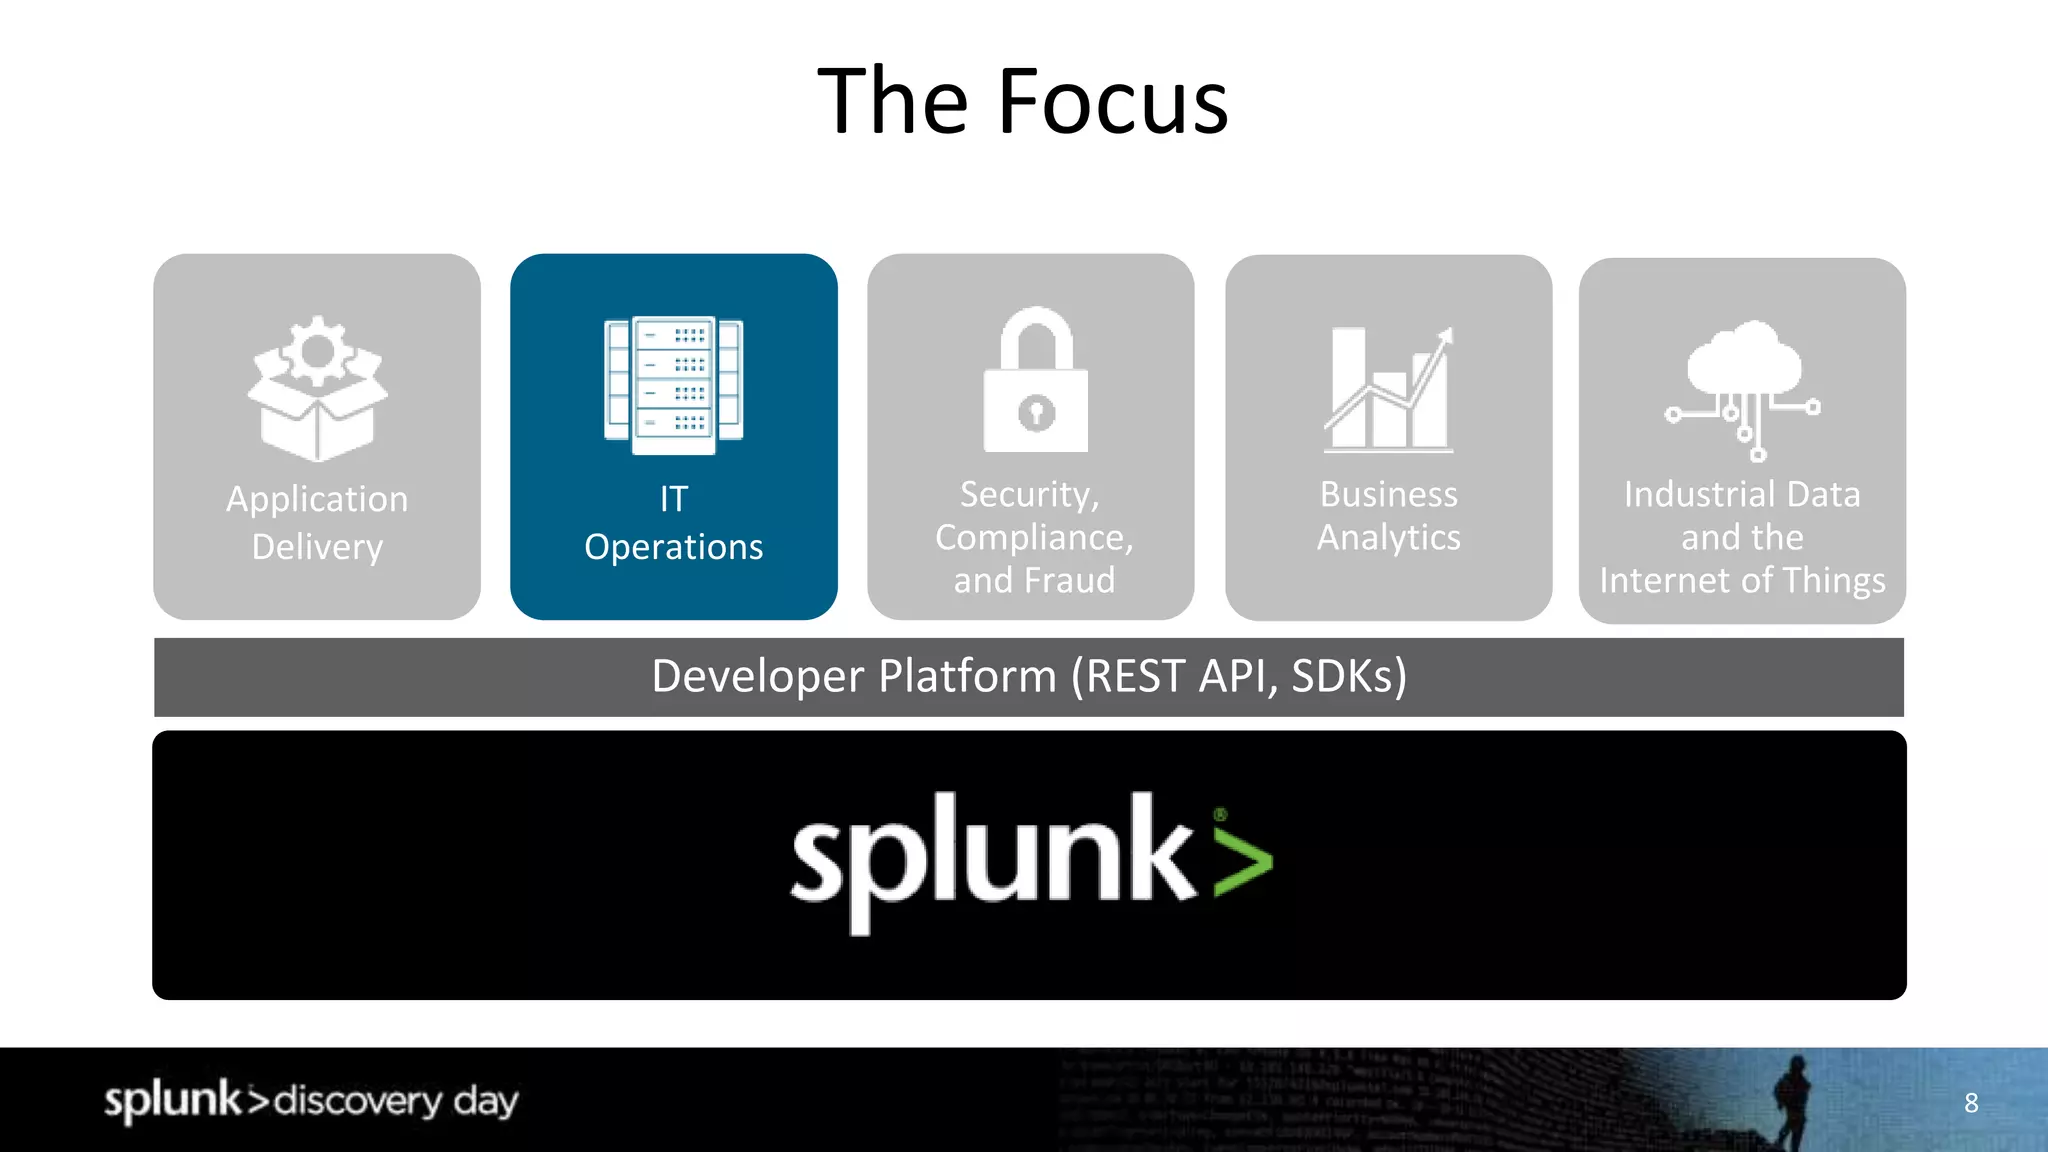
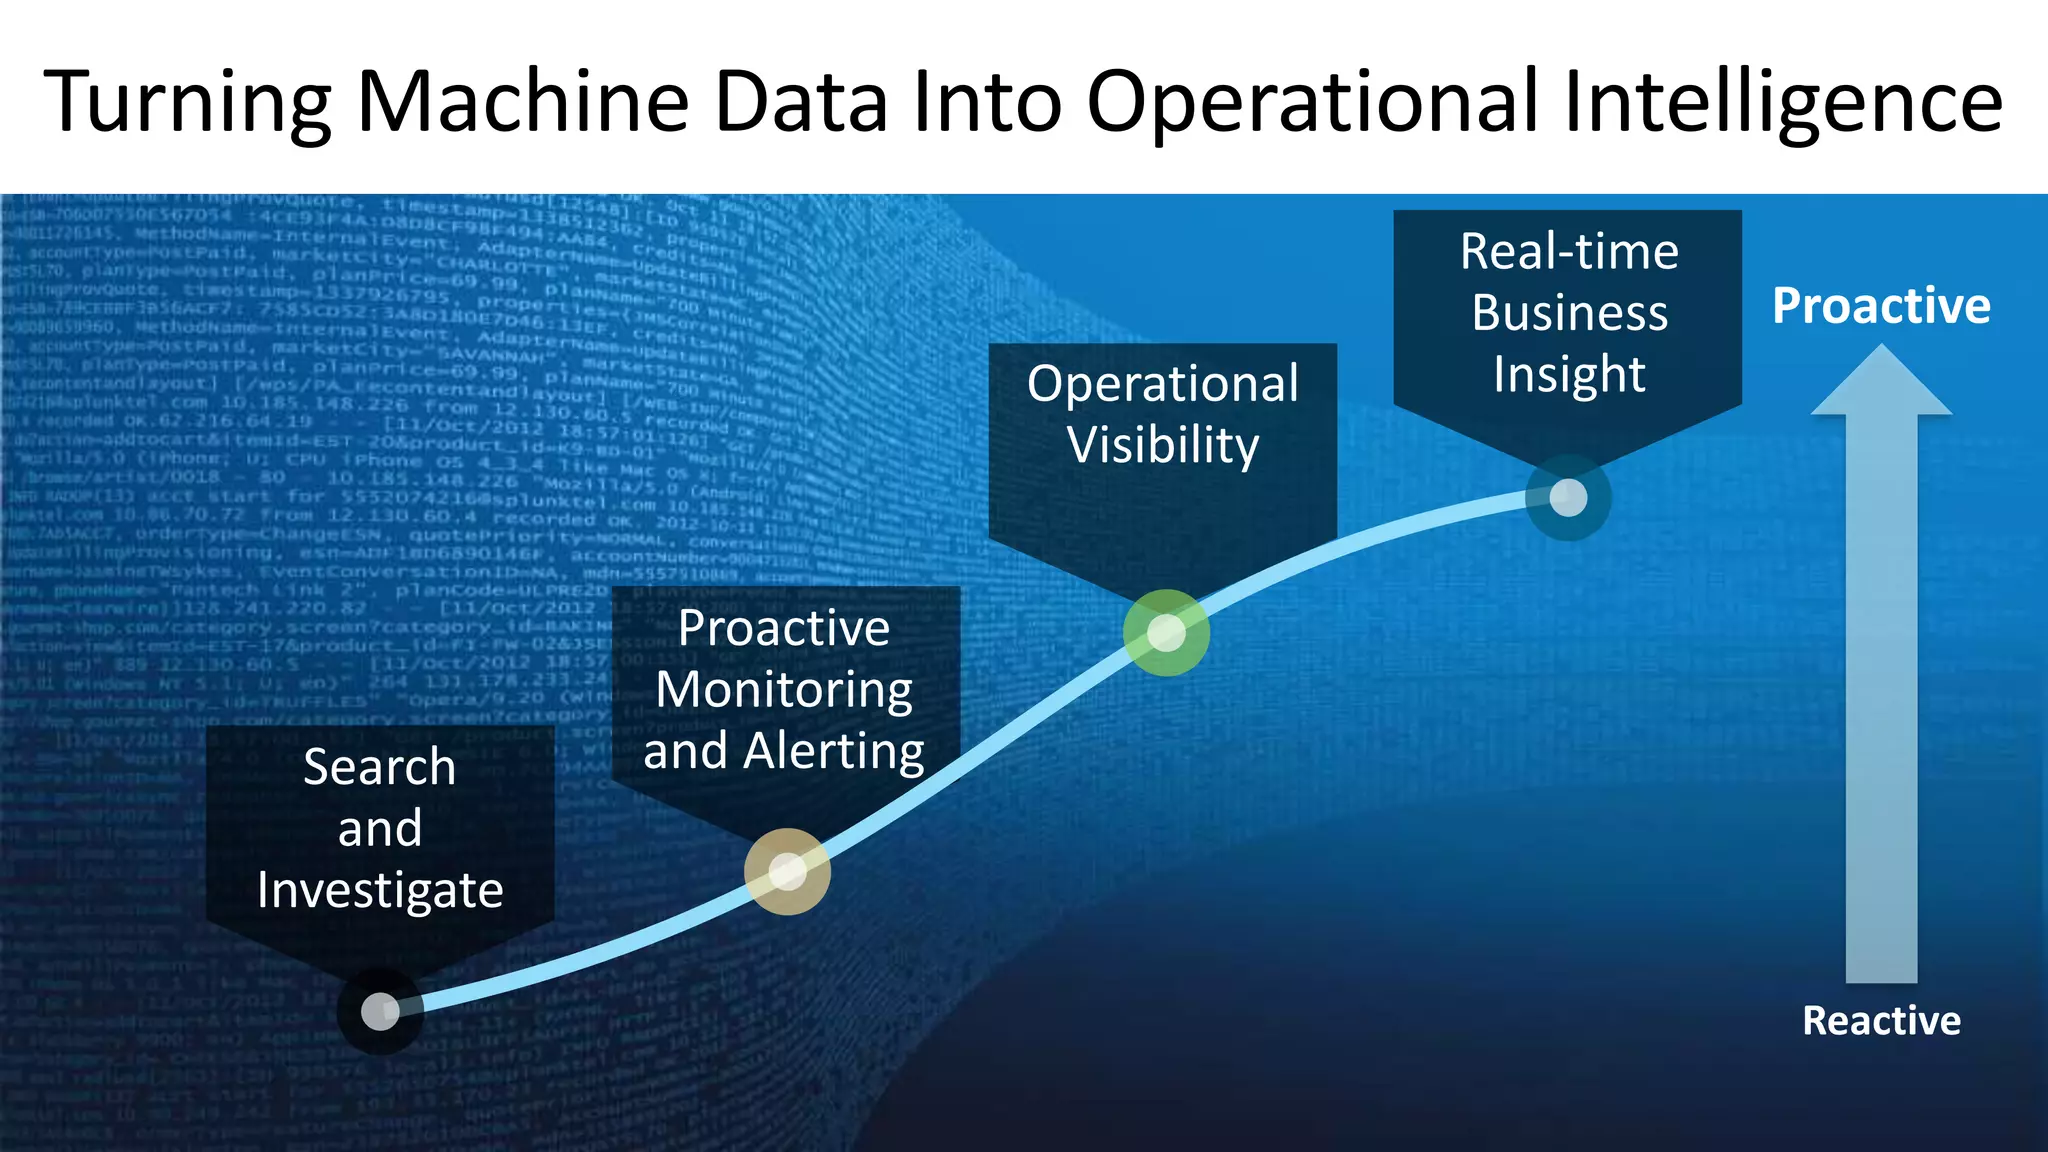
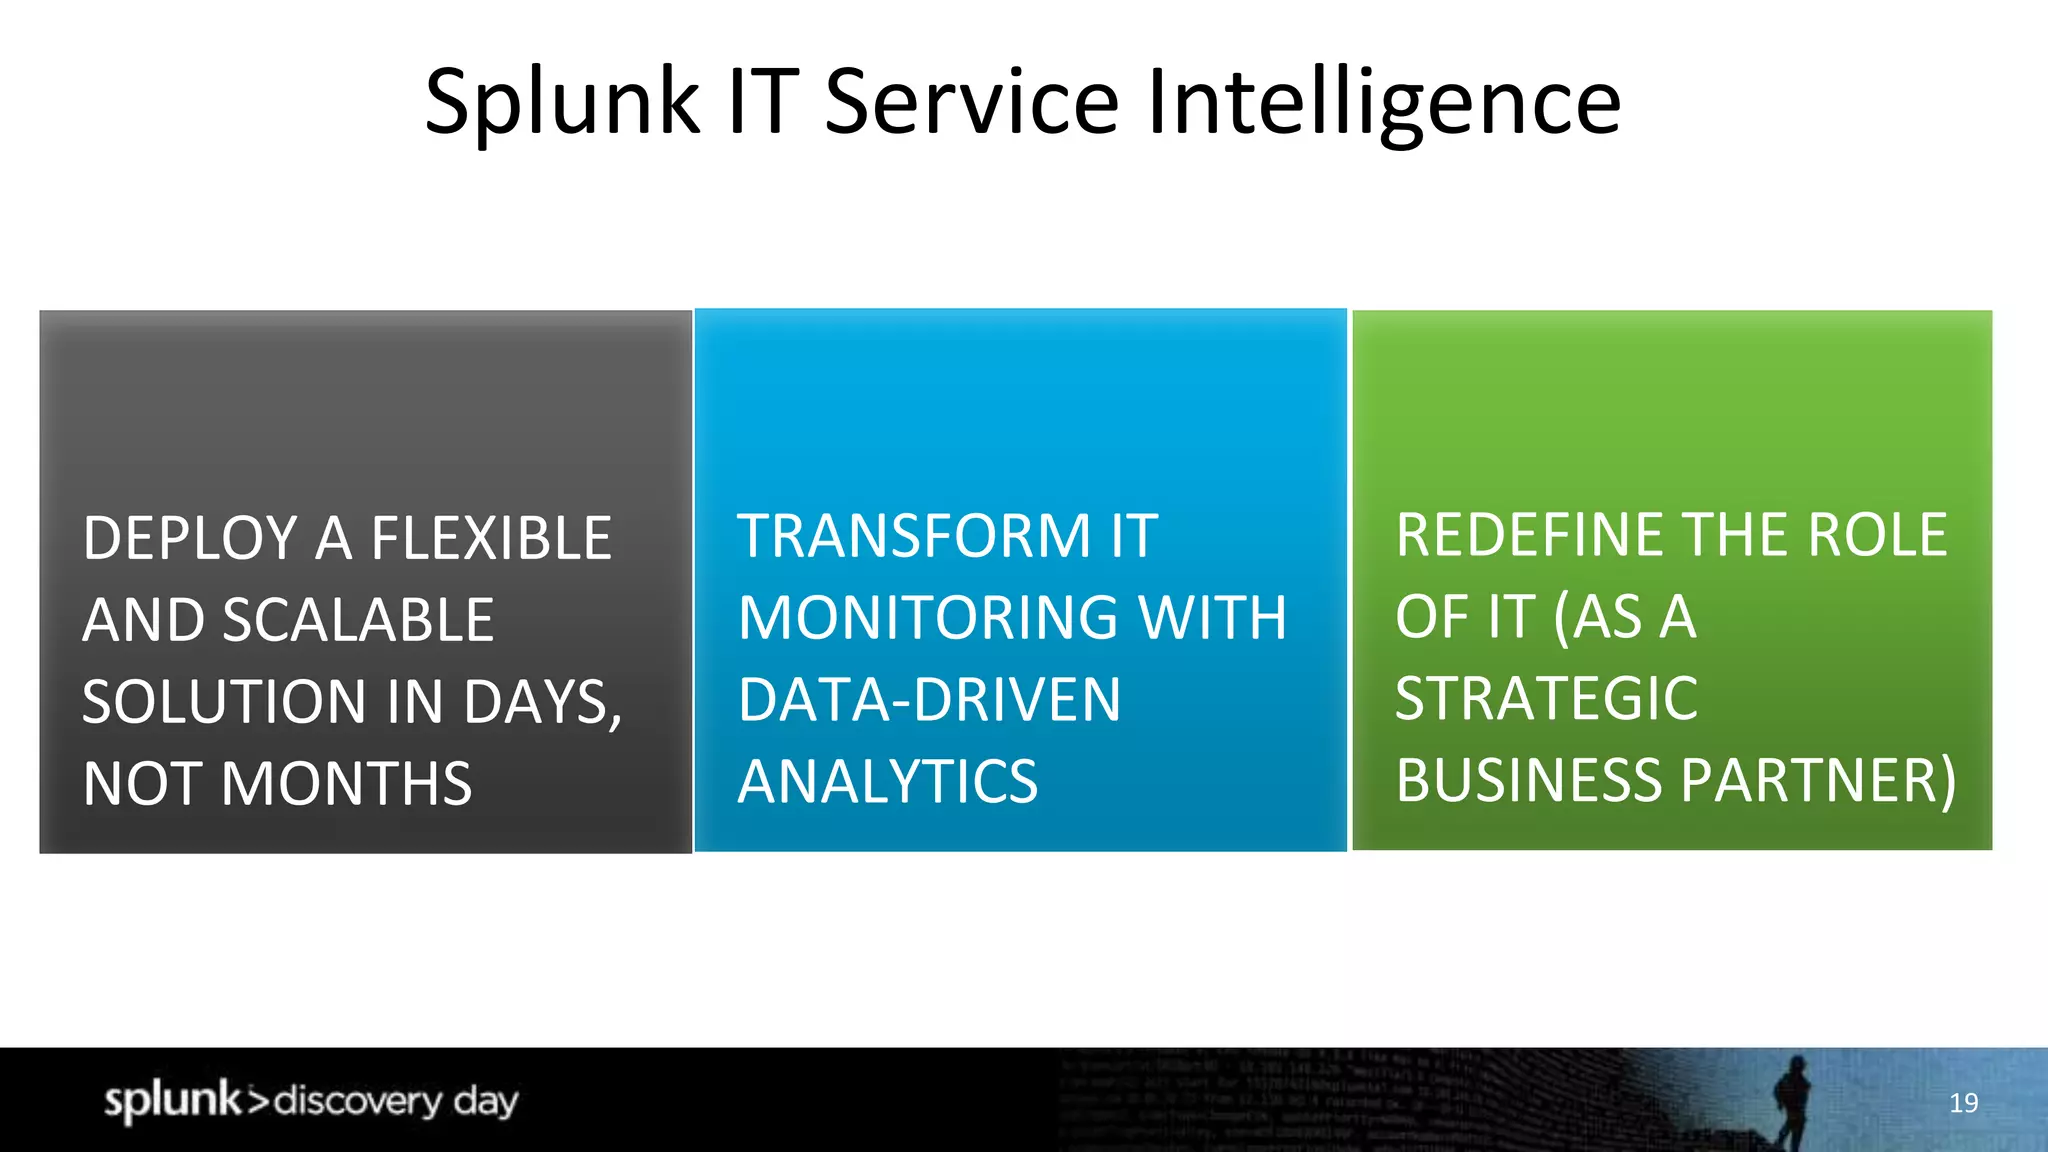
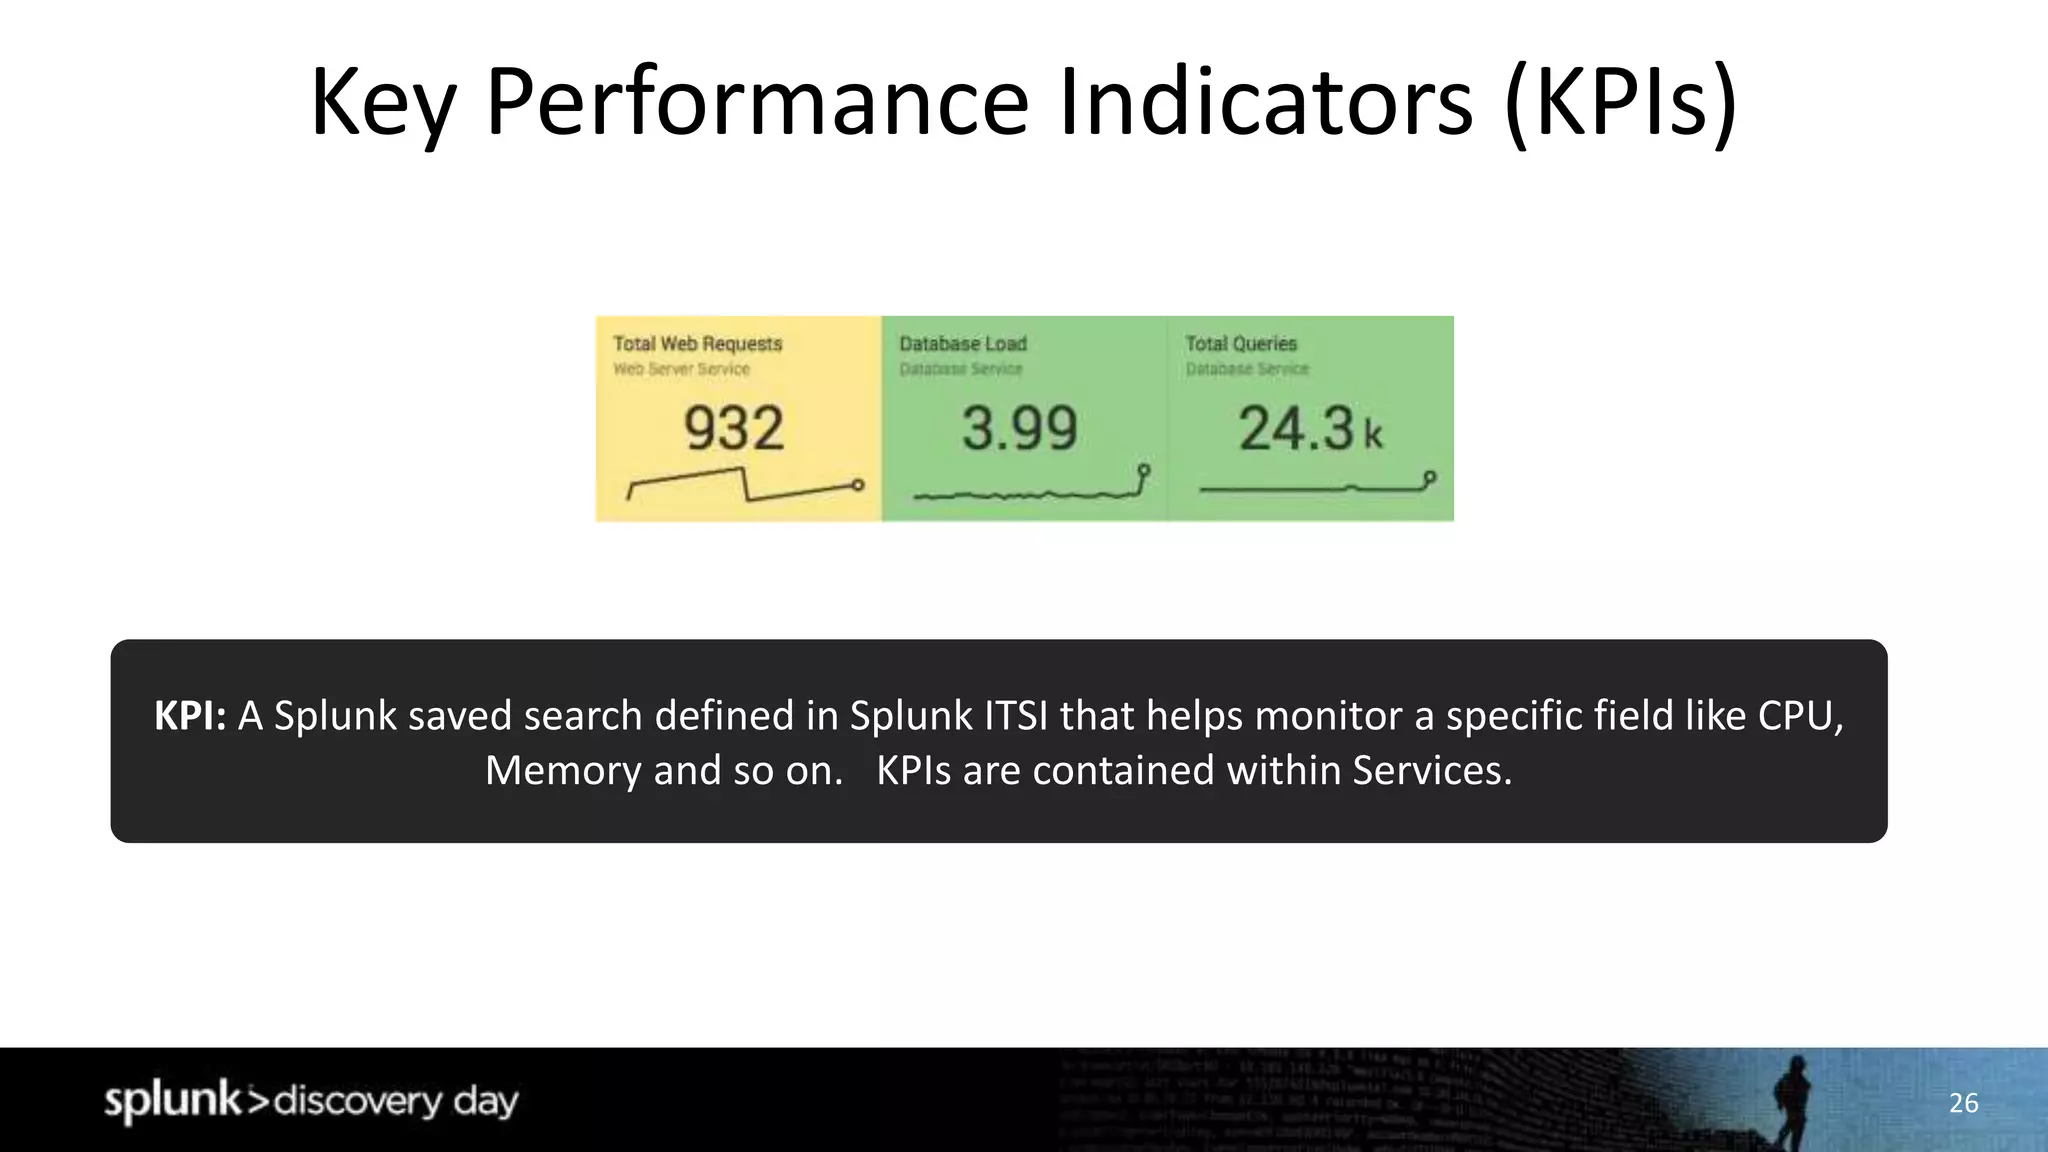
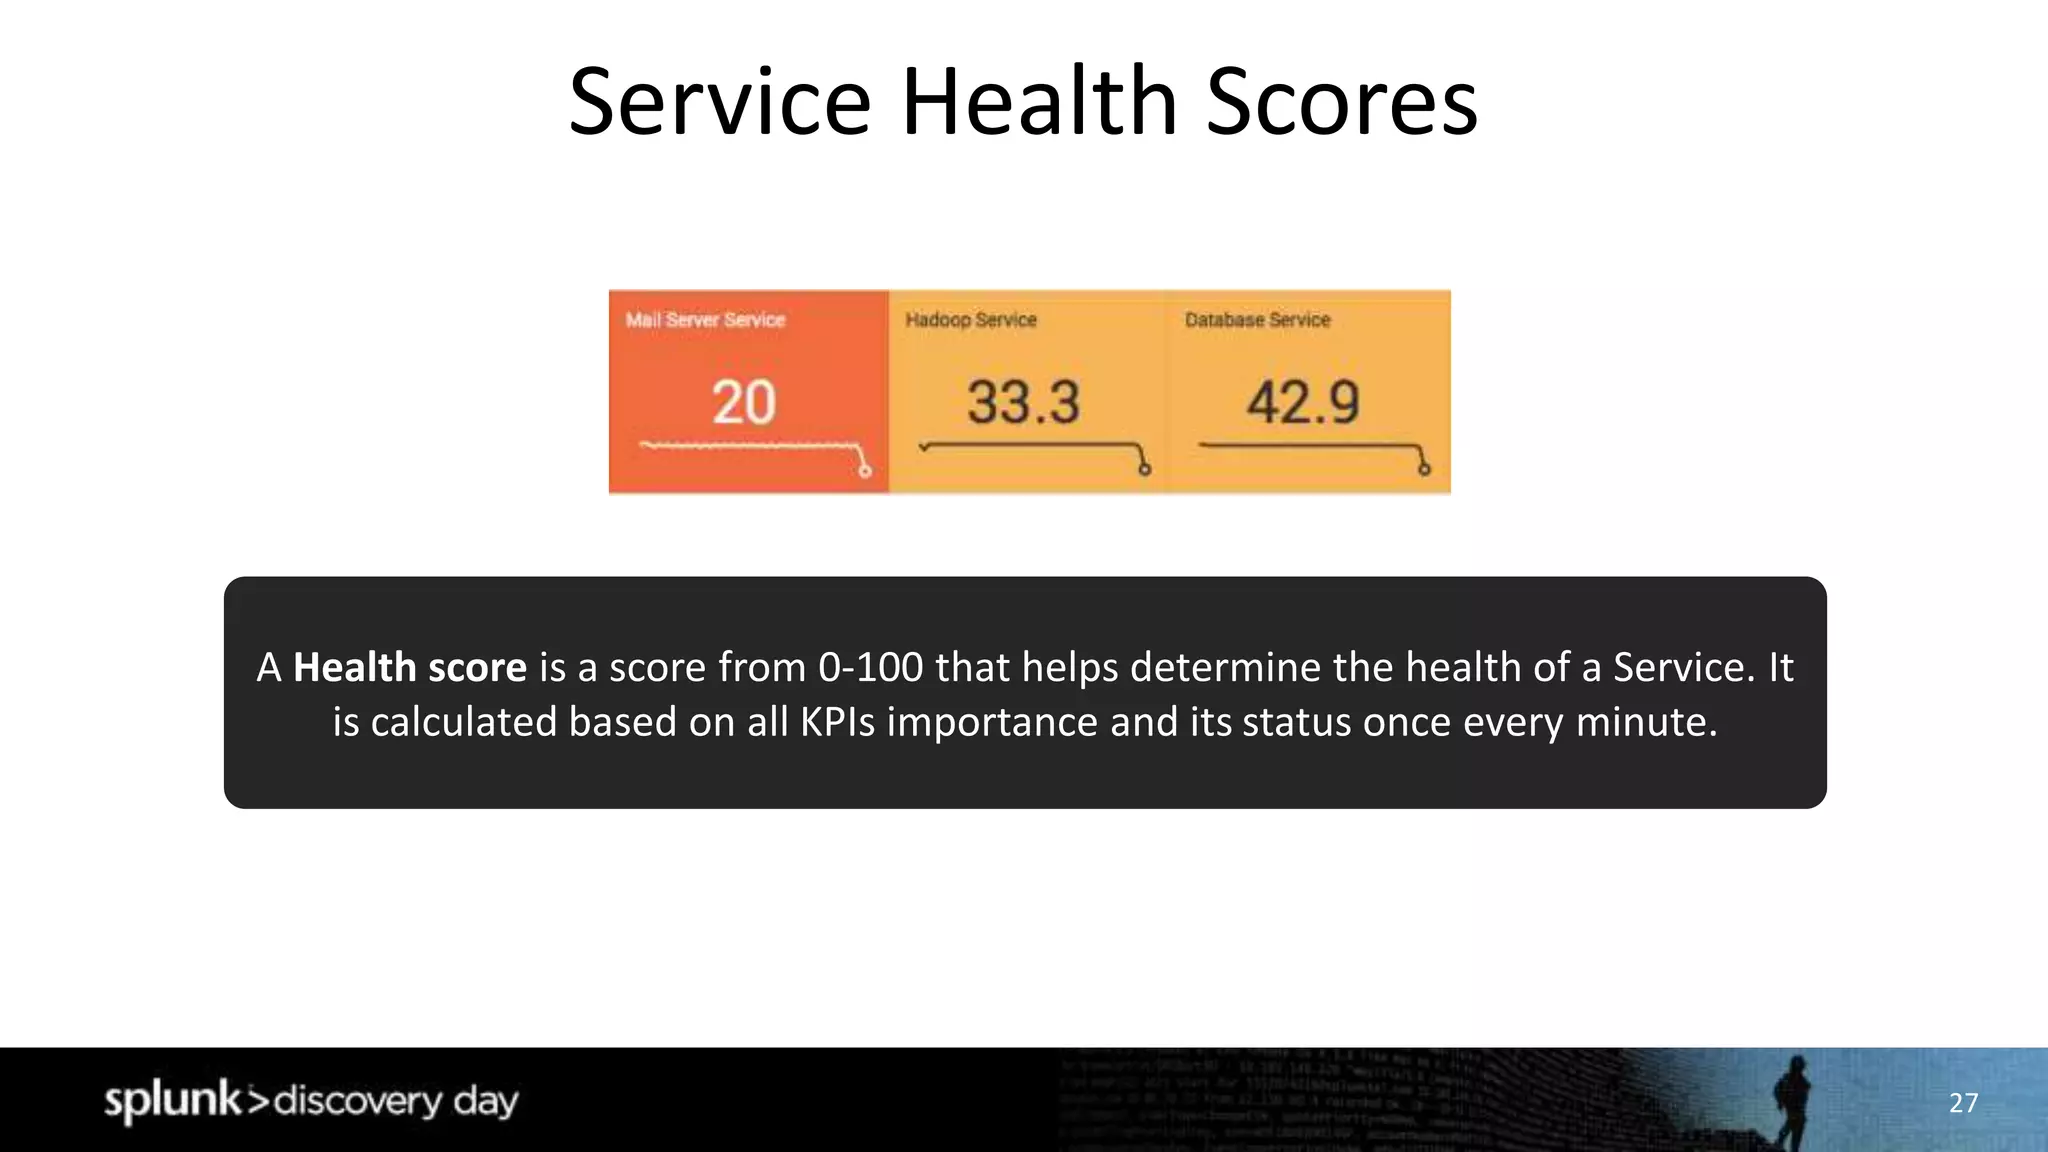
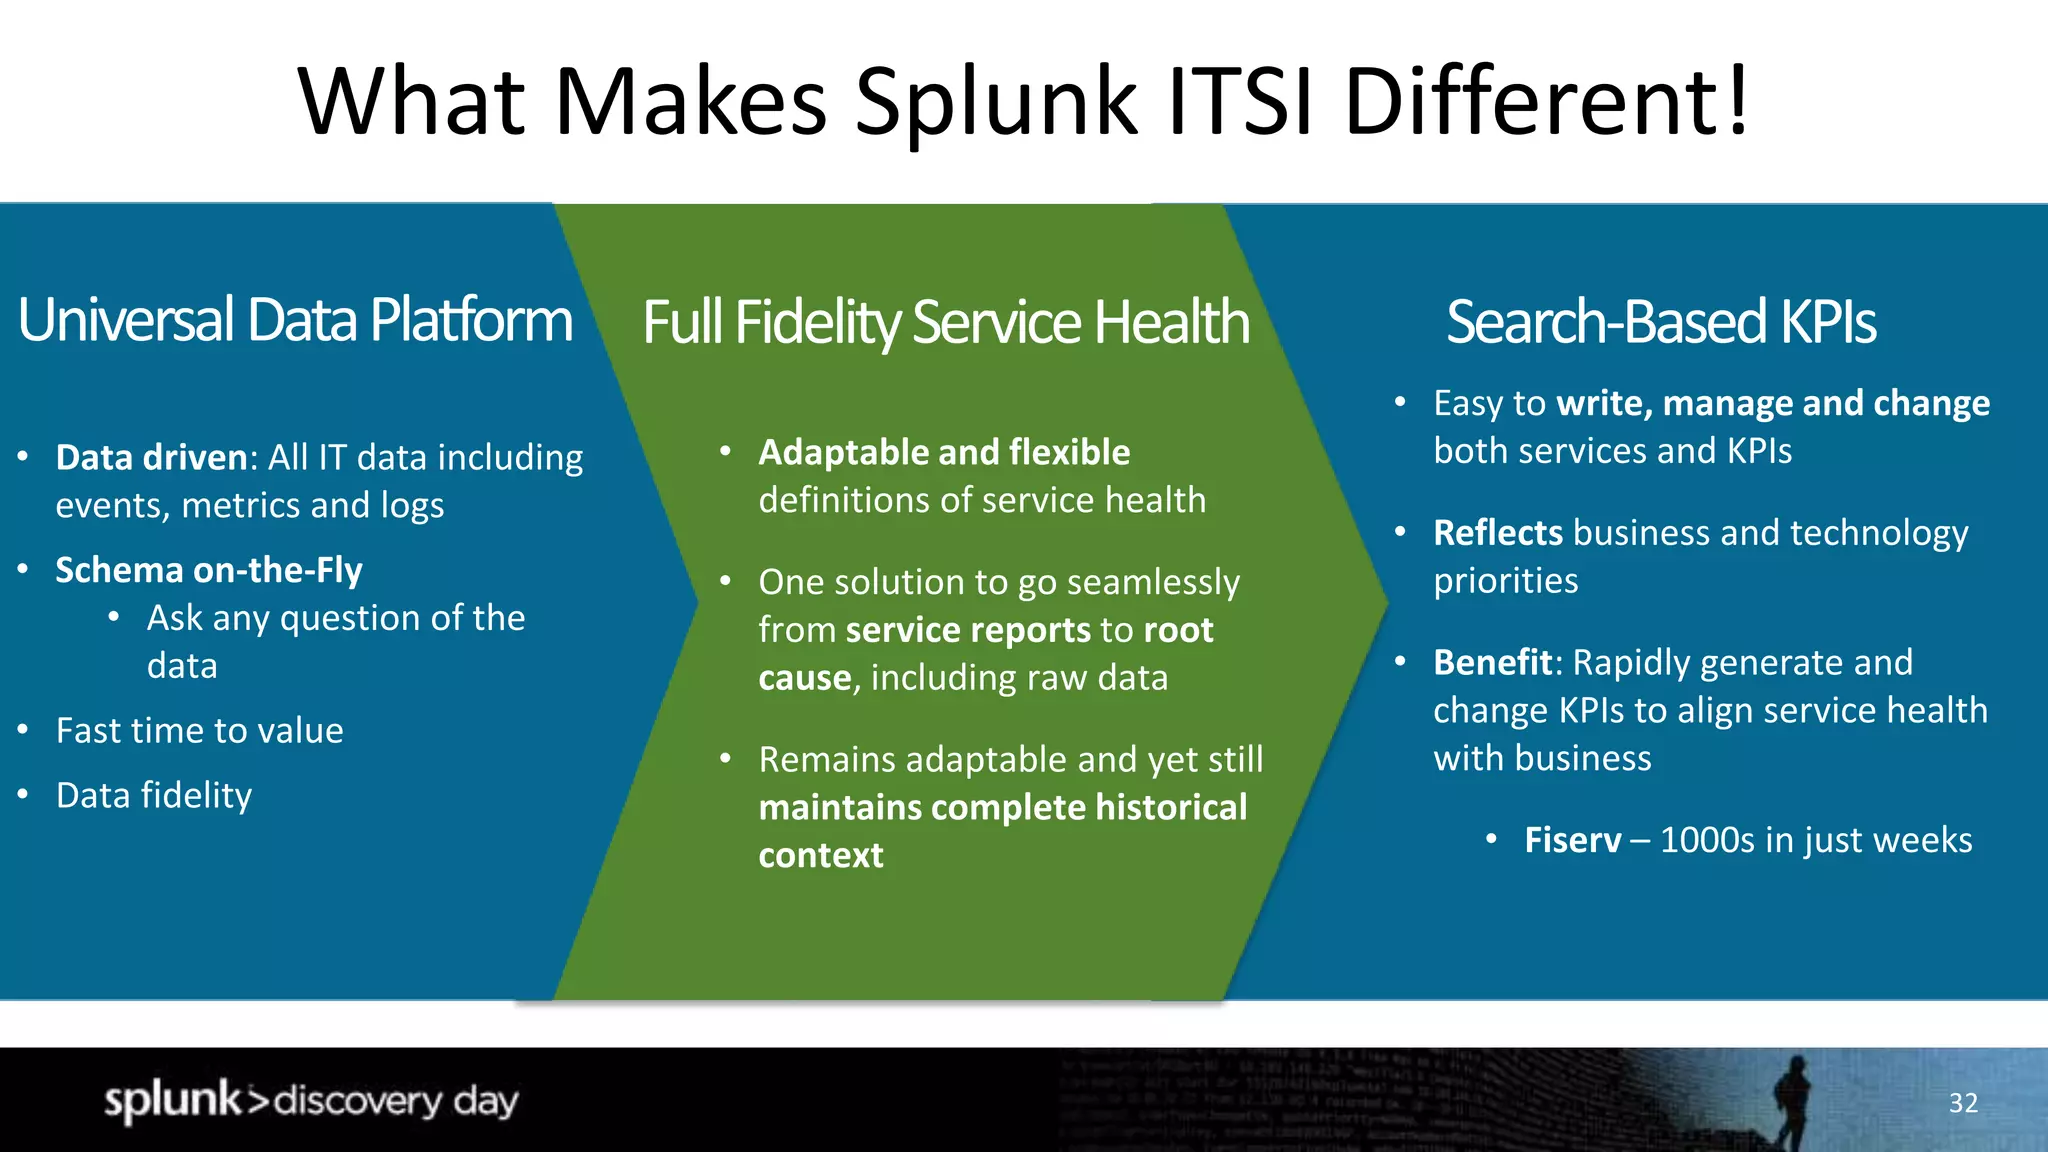
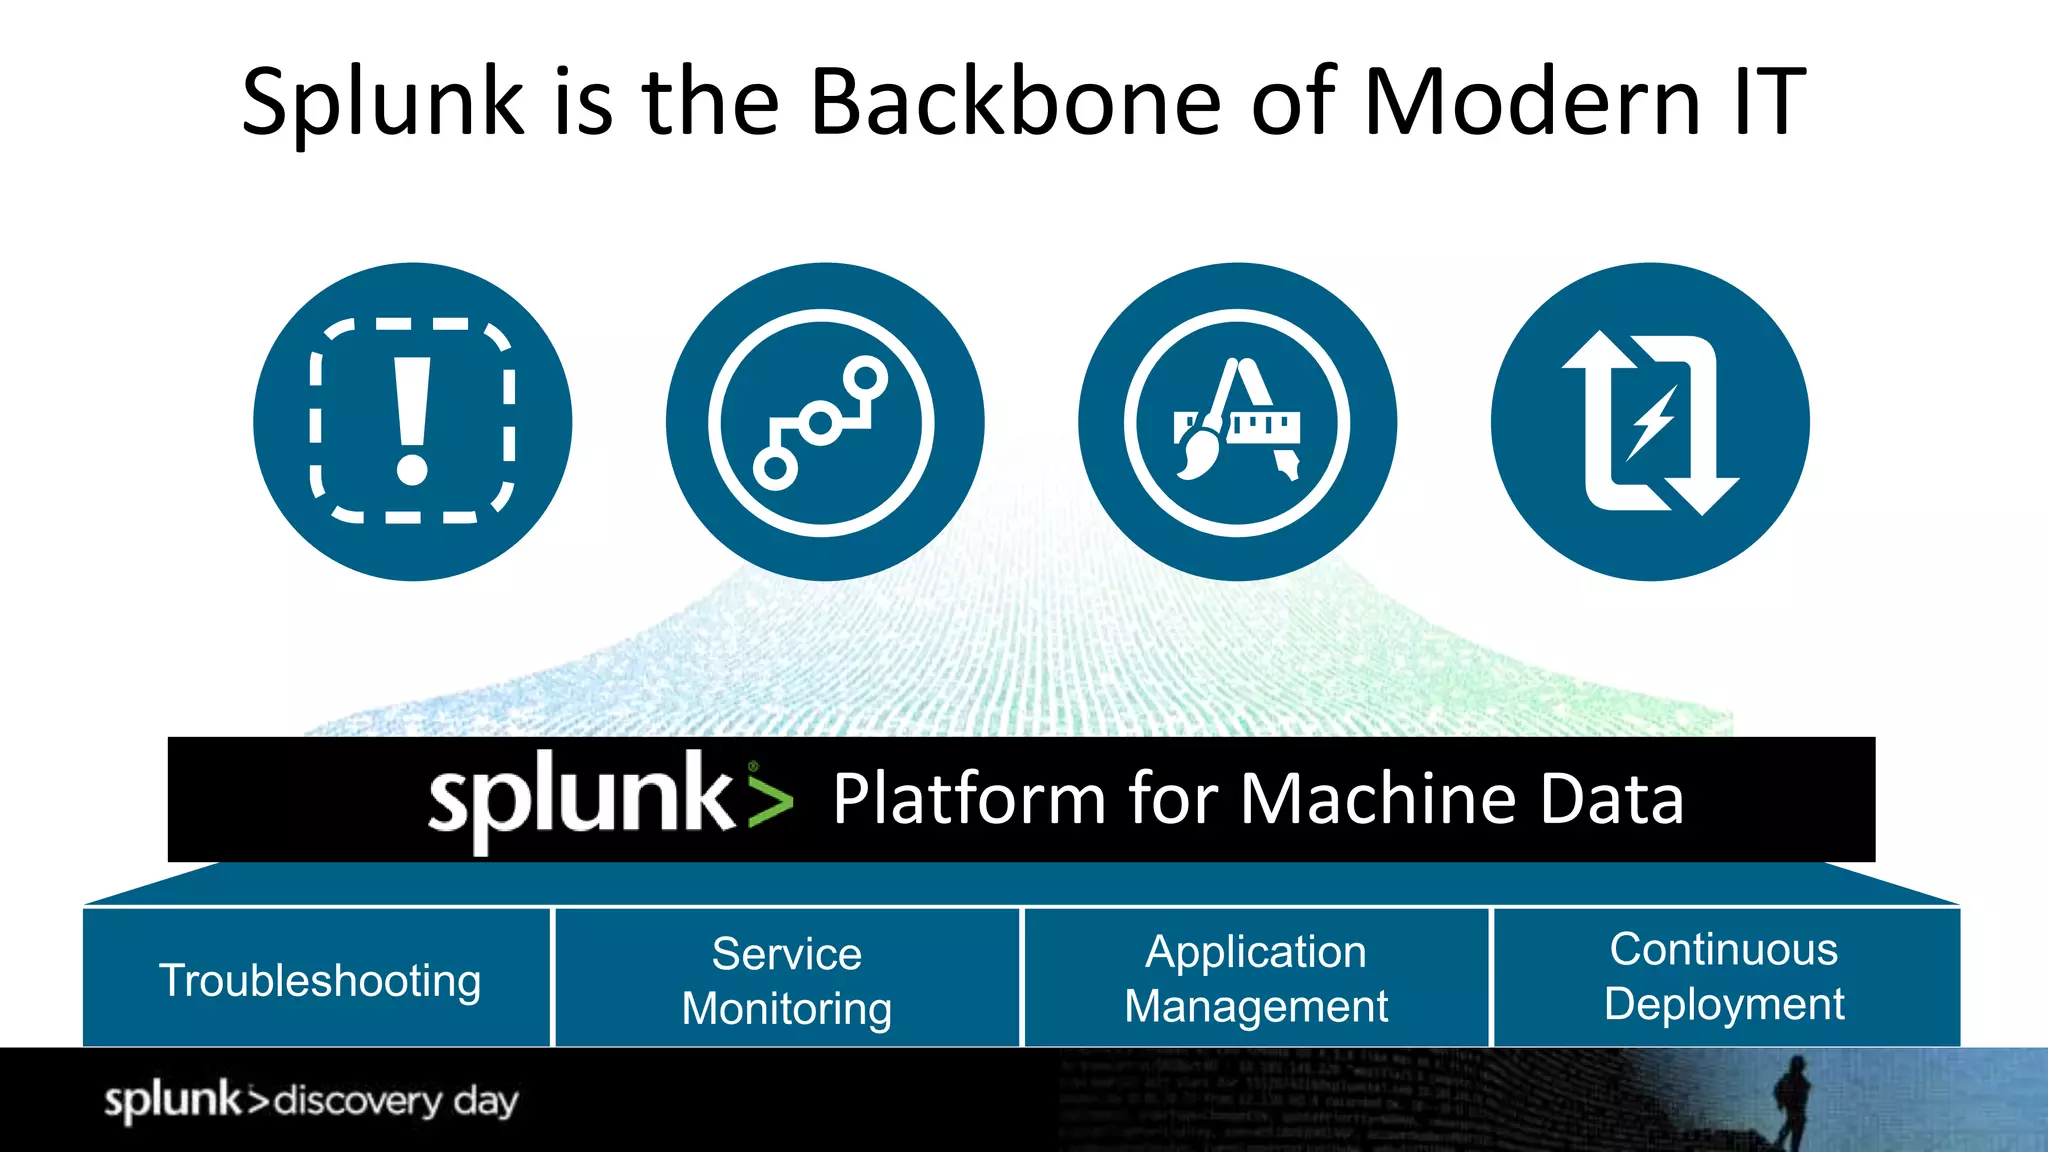
Attend to learn from our experts about ways to improve you IT Operational Intelligence by using Splunk for troubleshooting, monitoring and service-level visibility. In this hands-on session we will cover recommended approaches for end-to-end troubleshooting and monitoring across applications, OSes, and devices to resolve problems faster, reduce downtime and improve user satisfaction and customer retention. Topics will include: monitoring critical services, using commonly deployed apps and TAs to gather data for IT infrastructure uses, and using of pre-made dashboard panels to quickly build dashboards for monitoring your environment.
Taking Splunk to the Next Level - Management Breakout SessionSplunk
Taking Splunk to the Next Level for Management outlines how Splunk can help organizations quantify the business value of machine data. It provides benchmarks from 400+ customer engagements that show potential efficiencies in IT operations, application delivery, and security and compliance. These include reduced incident resolution times, increased developer productivity, and faster security incident response. The document also offers best practices for aligning a Splunk deployment with key objectives, qualifying issues it can address, quantifying anticipated benefits, and measuring success based on key metrics and customer stories.
Attend to learn from our experts about ways to improve you IT Operational Intelligence by using Splunk for troubleshooting, monitoring and service-level visibility. In this hands-on session we will cover recommended approaches for end-to-end troubleshooting and monitoring across applications, OSes, and devices to resolve problems faster, reduce downtime and improve user satisfaction and customer retention. Topics will include: monitoring critical services, using commonly deployed apps and TAs to gather data for IT infrastructure uses, and using of pre-made dashboard panels to quickly build dashboards for monitoring your environment.
The document discusses how Splunk provides a platform for operational intelligence through machine data. It outlines Splunk's capabilities including collecting any machine data, powerful search and investigation tools, and proactive monitoring. Splunk accelerates value through apps that provide deep insights into specific technologies like Exchange, VMware, and storage. The document demonstrates how Splunk apps work through demos and discusses how customers are leveraging Splunk to reduce costs and gain operational visibility across their infrastructure.
The document provides an overview of Splunk for IT operations (ITOps). It discusses how Splunk can help organizations address escalating IT complexity and issues plaguing IT operations. It introduces Splunk IT Service Intelligence, which provides data-driven service insights for root-cause isolation and improved service operations. Key concepts explained include what a service is, key performance indicators (KPIs), and service health scores. The document also highlights capabilities like service analyzer, glass tables, deep dives, multi-KPI alerts and notable events. Customer stories are presented on how enterprises use Splunk for increased uptime, reduced mean time to resolution, optimized capacity and more.
The document discusses how Splunk provides a platform for operational intelligence by unifying machine data from various IT systems and applications. It summarizes Splunk's capabilities for monitoring infrastructure components, applications, and virtual environments. The presentation includes an agenda, descriptions of IT complexity challenges and how Splunk addresses them with its platform. It also provides overviews and demonstrations of specific Splunk apps for monitoring Exchange, VMware, NetApp, and other systems.
Getting started with Splunk Breakout SessionSplunk
This document provides a summary of a presentation about Splunk. It discusses what Splunk is and how it works, including that Splunk is a platform for searching, monitoring, and analyzing machine-generated big data in real-time. It also covers key Splunk concepts like indexing, searching, reporting, alerting, and deployment options. The presentation demonstrates how to install Splunk, add sample data, perform searches, extract fields, create alerts and dashboards, and discusses integration, support resources, and the Splunk developer platform.
This summary provides an overview of a presentation about Splunk:
1. The presentation introduces Splunk, an enterprise software platform that allows users to search, monitor, and analyze machine-generated big data for security, IT and business operations.
2. Key components of Splunk include universal forwarders for data collection, indexers for data storage and search heads for data visualization. Splunk supports data ingestion from various sources like servers, databases, applications and sensors.
3. A demo section shows how to install Splunk, ingest sample data, perform searches, set up alerts and reports. It also covers dynamic field extraction, the search command language and Splunk applications.
Come and learn from our experts on ways to improve you IT Operational Visibility by using Splunk for monitoring environment health. In this hands-on session we will cover recommended approaches for end-to-end monitoring, across applications, OSes, and devices. Topics will include: critical services to monitor, use of the Splunk Common Information Model (CIM) for cross-dataset normalization, commonly deployed apps and TAs to gather data for IT infrastructure uses, and use of pre-made dashboard panels to quickly build dashboards for monitoring your environment.
Splunk IT Service Intelligence for NationwideSplunk
Splunk IT Service Intelligence is a next-generation monitoring and analytics solution that provides new levels of visibility into the health and key performance indicators of IT services.
Michael Ronnfeldt of NXP discusses implementing an Analytics and Automation Platform using Splunk to address NXP's challenges. Some key points:
- NXP is a large semiconductor company with many products and divisions facing growing IT needs
- The current situation involves manual, slow monitoring and resolution of issues
- The Analytics and Automation Platform (SNA2P) uses Splunk for automated monitoring, incident detection and remediation, discovery, and centralized reporting to provide faster, better service
- Benefits include incidents being resolved before users notice and automation enforcing security and compliance through change control
- Future roadmap includes expanding the CMDB, deployment automation, test automation, and continuous integration
How to Design, Build and Map IT and Business Services in SplunkSplunk
Your IT department supports critical business functions, processes and products. You're most effective when your technology initiatives are closely aligned and measured with specific business objectives. This session covers best practices and techniques for designing and building an effective service model, using the domain knowledge of your experts and capturing and reporting on key metrics that everyone can understand. We will design a sample service model and map them to performance indicators to track operational and business objectives. We will also show you how to make Splunk service-ware with Splunk IT Service Intelligence (ITSI).
The document discusses Splunk IT Service Intelligence, a solution from Splunk that provides data-driven service insights for IT operations. It allows monitoring of key performance indicators (KPIs) across different technical services to detect problems and improve service operations. Some key capabilities include deploying a flexible solution quickly, transforming IT monitoring with machine learning-based anomaly detection and adaptive thresholds, and redefining the role of IT through data-driven service visibility and insights.
Splunk IT Service Intelligence is a solution that provides end-to-end service visibility, reduces time to problem resolution, and allows for proactive management of IT health. It introduces a data-centric approach to service monitoring and analytics built on the Splunk platform. Key benefits include unified data insights across IT silos, easy access to actionable troubleshooting information through dynamic service models and customizable visualizations, and early warning on deviations through correlated KPI monitoring.
The document provides an overview of Splunk IT Service Intelligence (ITSI). Some key points:
- ITSI makes Splunk "service-aware" and provides insights into IT services to help accelerate customers' path to operational intelligence.
- ITSI provides search-based KPIs, full-fidelity service health monitoring, and leverages Splunk's universal data platform to provide a data-driven approach.
- Core concepts in ITSI include services, KPIs, health scores, service analyzers for monitoring services, glass tables dashboards, and deep dives for investigation.
- Notable events are also generated by correlation searches to indicate service degradation.
How to Design, Build and Map IT and Business Services in SplunkSplunk
Your IT department supports critical business functions, processes and products. You're most effective when your technology initiatives are closely aligned and measured with specific business objectives. This session covers best practices and techniques for designing and building an effective service model, using the domain knowledge of your experts and capturing and reporting on key metrics that everyone can understand. We will design a sample service model and map them to performance indicators to track operational and business objectives. We will also show you how to make Splunk service-ware with Splunk IT Service Intelligence (ITSI).
Come and learn from our experts on ways to improve you IT Operational Visibility by using Splunk for monitoring environment health. In this hands-on session we will cover recommended approaches for end to end monitoring, across applications, OSes, and devices. Topics will include: critical services to monitor, use of the Splunk Common Information Model (CIM) for cross-dataset normalization, commonly deployed apps and TAs to gather data for IT infrastructure uses, and use of pre-made dashboard panels to quickly build dashboards for monitoring your environment.
Here’s your chance to get hands-on with Splunk for the first time! Bring your modern Mac, Windows, or Linux laptop and we’ll go through a simple install of Splunk. Then, we’ll load some sample data, and see Splunk in action – we’ll cover searching, pivot, reporting, alerting, and dashboard creation. At the end of this session you’ll have a hands-on understanding of the pieces that make up the Splunk Platform, how it works, and how it fits in the landscape of Big Data. You’ll experience practical examples that differentiate Splunk while demonstrating how to gain quick time to value.
Splunk - Verwandeln Sie Datensilos in Operational IntelligenceSplunk
Splunk Software ermöglicht den Interessierten unter uns, das anzusehen, was andere ignorieren - Maschinendaten - und das zu finden, was andere niemals sehen - wertvolle Einblicke, durch die Ihr Team und Unternehmen produktiver, profitabler, wettbewerbsfähiger und sicherer wird.
Sind Sie schon neugierig, welche Informationen in Ihren Maschinendaten stecken?
In diesem Webinar zeigen wir Ihnen, warum über 11 000 Unternehmen, Splunk Software für folgendes nutzen:
- Beseitigung von Applikationsproblemen und Investigation von Security-Vorfällen in Minutenschnelle
- Vermeidung von Service-Problemen oder Ausfällen
- Einhaltung von Compliance Vorschriften zu niedrigeren Kosten
- Neue Einblicke in die Geschäftstätigkeit
Nehmen Sie teil an dieser Operational Intelligence Demo-Session und erfahren Sie mehr darüber, wie Sie und Ihr Team effizienter und produktiver arbeiten können.
This document discusses how organizations can use machine data and real-time analytics to gain insights that allow them to operate with greater commercial intensity and move at market speed. It advocates establishing a hybrid cloud infrastructure with continuous delivery and insights capabilities to provide transparency into key metrics and enable fast feedback loops. With the right culture of continuous improvement, the document argues this approach can give organizations the resources of an enterprise with the agility of a startup.
Getting Started with IT Service IntelligenceSplunk
This document discusses IT service intelligence (ITSI) concepts including defining services, key performance indicators (KPIs), service health scores, and service decomposition. A service can include multiple technology components and tiers that need to be monitored together from a user's perspective. KPIs are Splunk searches that monitor specific metrics like CPU or errors. Health scores from 0-100 indicate a service's status based on KPI status and importance. Entities that support services can come from CMDBs or searches. Services can be decomposed into sub-services and underlying processes to define relevant KPIs for monitoring. Adaptive thresholding and anomaly detection help determine normal vs abnormal behavior in dynamic or patterned data. ITSI allows
Splunk for IT Operations Breakout SessionGeorg Knon
This document discusses how IT complexity is a challenge for CIOs due to siloed technologies, disconnected point solutions, and time spent maintaining rather than innovating. It presents Splunk as a solution that provides comprehensive visibility across infrastructure, applications, databases, and more through centralized data collection and analysis. Splunk reduces problem resolution time by 67% and escalations by 90% by enabling "first responders" to search across all IT data from a single interface. The document also outlines how Splunk apps can provide insights by role and technology and its capabilities for various IT functions like virtualization, storage, and operating systems.
How to Design, Build and Map IT and Business Services in SplunkSplunk
Your IT department supports critical business functions, processes and products. You're most effective when your technology initiatives are closely aligned and measured with specific business objectives. This session covers best practices and techniques for designing and building an effective service model, using the domain knowledge of your experts and capturing and reporting on key metrics that everyone can understand. We will design a sample service model and map them to performance indicators to track operational and business objectives. We will also show you how to make Splunk service-ware with Splunk IT Service Intelligence (ITSI).
Splunk Tutorial for Beginners - What is Splunk | EdurekaEdureka!
The document discusses Splunk, a software platform used for searching, analyzing, and visualizing machine-generated data. It provides an example use case of Domino's Pizza using Splunk to gain insights from data from various systems like mobile orders, website orders, and offline orders. This helped Domino's track the impact of various promotions, compare performance metrics, and analyze factors like payment methods. The document also outlines Splunk's components like forwarders, indexers, and search heads and how they allow users to index, store, search and visualize data.
Elevate your Splunk Deployment by Better Understanding your Value Breakfast S...Splunk
This document discusses how to better understand the value of a Splunk deployment through assessing data sources. It presents a data source assessment tool to map data sources to use cases and organizational groups to identify opportunities. The tool shows which data sources are indexed and overlap between groups. It aims to maximize benefits from machine data by supporting business objectives and enabling broader impact.
Here’s your chance to get hands-on with Splunk for the first time! Bring your modern Mac, Windows, or Linux laptop and we’ll go through a simple install of Splunk. Then, we’ll load some sample data, and see Splunk in action – we’ll cover searching, pivot, reporting, alerting, and dashboard creation. At the end of this session you’ll have a hands-on understanding of the pieces that make up the Splunk Platform, how it works, and how it fits in the landscape of Big Data. You’ll experience practical examples that differentiate Splunk while demonstrating how to gain quick time to value.
Splunk provides software that allows users to search, monitor, and analyze machine-generated data. It collects data from websites, applications, servers, networks and other devices and stores large amounts of data. The software provides dashboards, reports and alerts to help users gain operational intelligence and insights. It is used by over 4,400 customers across many industries to solve IT and business challenges.
This document discusses how Splunk can help organizations address challenges related to escalating IT complexity. It notes that IT environments have become more complex with disconnected point solutions, over 70% of time spent maintaining rather than innovating, and latency in resolving issues measured in hours or days. Splunk provides a single platform to gather, analyze, and search machine data from various sources in real-time. It allows correlating data across silos for faster problem resolution. The document highlights how Splunk reduced escalations by 90% and mean time to resolution by 67% for one customer. It then discusses how Splunk offers pre-built apps for monitoring different parts of the IT infrastructure and applications.
Travis Perkins: Building a 'Lean SOC' over 'Legacy SOC'Splunk
Travis Perkins has a complex hybrid IT infrastructure and is in midst of migrating to the cloud. This session will outline the pitfalls from their initial infrastructure-heavy ‘legacy SOC’ approach with a legacy SIEM and the success they gained when they moved to a cloud-based, data-driven ‘lean SOC’.
Learn from our experts about ways to improve you IT Operational Intelligence by using Splunk for troubleshooting, monitoring and service-level visibility. In this hands-on session we will cover recommended approaches for end-to-end troubleshooting and monitoring across applications, OSes, and devices to resolve problems faster, reduce downtime and improve user satisfaction and customer retention. Topics will include: monitoring critical services, using commonly deployed apps and TAs to gather data for IT infrastructure uses, and using of pre-made dashboard panels to quickly build dashboards for monitoring your environment.
The document provides an overview of Splunk for IT operations (ITOps). It begins with an agenda for the presentation and discusses the increasing complexity facing IT operations. Splunk is introduced as an industry-leading platform for machine data that can ingest data from any source. The presentation describes how Splunk turns machine data into operational intelligence through search, investigation, proactive monitoring, and visibility. It highlights Splunk apps and add-ons that accelerate insights and the Splunk IT Service Intelligence product. The presentation concludes with a customer success story and information about the annual Splunk .conf user conference.
The document discusses Splunk IT Service Intelligence, a solution from Splunk for monitoring IT services. It provides real-time insights into key performance indicators (KPIs) for defined IT services. The solution allows customers to quickly gain visibility into the health and performance of critical services through dashboards, alerts and reports. Case studies show how Splunk IT Service Intelligence has helped customers reduce incident tickets, gain unified insights across their IT operations and support proactive, service-level monitoring.
The document is an agenda for a Splunk conference session on using Splunk for IT operations. The agenda includes an introduction to Splunk for IT operations, a discussion of Splunk apps to accelerate insights, and a presentation on Splunk IT Service Intelligence. It outlines the growing complexity faced by IT operations and how Splunk provides a platform to index and investigate machine data from any source, in order to improve troubleshooting, monitoring, and gaining operational visibility and insights.
This document discusses how IT complexity is a challenge for CIOs due to siloed technologies, disconnected point solutions, and time spent maintaining rather than innovating. It presents Splunk as a solution that provides comprehensive visibility across infrastructure, applications, and customer-facing data to help reduce problem resolution time and escalations. Specific benefits highlighted include consolidating logs from various systems into a single view, enabling faster identification and resolution of issues. The document also outlines how Splunk apps can provide insights by role and accelerate value through plug-ins and templates to analyze data from any source.
Splunk provides a fully integrated platform for collecting, analyzing, and visualizing machine data from any source. The Splunk App for AWS integrates with AWS services like CloudTrail, Config, and VPC Flow Logs to provide visibility into AWS environments. It collects data from AWS SQS queues and S3 buckets using the AWS SDK. Setting up the Splunk App for AWS requires installing the Splunk Add-on for AWS and configuring permissions for AWS services. Users add their AWS account, and then must wait 5-10 minutes for dashboards and reports to populate with AWS log data.
Splunk is used by many large financial services companies to gain operational intelligence and insights across diverse business processes. Some key uses of Splunk mentioned in the document include enabling high performance global trade infrastructure, gaining visibility across FIX order routing systems, providing end to end visibility across applications and infrastructure to deliver $6M annual ROI, enabling timely transaction settlement processing, and being integrated into a risk metrics group's high performance cloud computing offering.
SplunkLive! München 2016 - Splunk für IT OperationsSplunk
The document discusses Splunk for IT operations (ITOps). It provides an overview of how Splunk can help organizations gain operational intelligence and visibility across their IT infrastructure and applications. Some key points:
- Splunk consolidates machine data from different sources like servers, storage, networking devices, applications etc. into a single platform for monitoring, searching and analyzing data.
- It helps overcome issues of disconnected point solutions, siloed teams and outdated tools that take up majority of IT time for maintenance instead of innovation.
- Splunk provides real-time search capabilities to help IT teams act as "first responders" and reduce problem resolution time from days to minutes by quickly searching across all log data.
You Can't Protect What you Can't See. AWS Security Best Practices - Session S...Amazon Web Services
AWS utilises a shared security model where both AWS and the customer share responsibility for the security of data, applications and resources. As part of this model, it is critical that customers leverage services such as AWS CloudTrail, Config, and more. Attend this session to learn best practices on how to leverage these and other AWS services to gain end-to-end visibility and robust security on AWS. You will also hear how customers leverage third-party tools such as the Splunk App for AWS as critical elements of their security posture.
Speakers: Dan Miller, Cloud Sales Director, APAC, Splunk & Simon O'Brien, Senior Systems Engineer, Splunk
SplunkLive! Utrecht - Splunk for IT Operations - Rick FitzSplunk
This document discusses how increasing IT complexity from technologies like virtualization, SaaS applications, and custom applications has made IT operations more difficult. It presents Splunk as a solution for capturing data from all IT systems and applications in order to perform operational analytics. This allows organizations to gain insights across their IT infrastructure and applications for tasks like root cause analysis, capacity planning, security monitoring, and service level reporting. The document highlights some of Splunk's key capabilities and differentiators like indexing data once for multiple uses, scaling to large environments, and providing a fast time to value. It also includes two customer examples of how Credit Suisse and Surrey Satellite have benefited from using Splunk for IT operations.
Steven Hatch of Cox Automotive discusses how they used Splunk IT Service Intelligence (ITSI) to gain operational visibility into massive amounts of audio, video, network, and storage data from their global auction platforms. This helped them pinpoint issues, improve mean time to identify and resolve incidents, and ensure high customer satisfaction. Splunk ITSI simplified the complex technical details into intelligence through correlating key performance indicators into services and actionable events. It also empowered Cox Automotive to scale infrastructure on demand with cloud solutions and proactively replace equipment. Use of Splunk ITSI reduced auction incidents by 90% with real-time infrastructure monitoring and positively impacted reliability and the bottom line. Next steps include training partners in DevOps
Splunk Webinar: IT Operations Demo für Troubleshooting & DashboardingGeorg Knon
This document provides an overview of Splunk's IT operations software. It discusses the challenges facing IT operations, including siloed tools and reactive problem solving. It presents Splunk as a solution, with its ability to index and analyze machine data from any source in real-time. Key benefits highlighted include faster troubleshooting to reduce downtime, proactive monitoring to address issues before they become problems, and increased operational visibility across the IT environment. The document concludes with a demonstration of Splunk's IT service intelligence capabilities.
Daten getriebene Service Intelligence mit Splunk ITSISplunk
Service Intelligence Modelle sind am effektivsten, wenn Sie auch mit speziellen Geschäftszielen und Initiativen verbunden sind und wenn sie kontinuierlich diese Zielerreichung messen. In dieser Session behandeln wir Best Practices und Techniken, um Ihre Service Intelligence Initiativen voranzutreiben. Wir werden ein effektives Serivce Intelligence Modele näher analysieren und dann ein Beispiel Modell entwerfen, mit dem sich die Geschäftsziele erreichen lassen und auch die Ziele für den Gschäftsmehrwert messen lassen.
The Big Data phenomenon is being driven by the growth of machine data. Critical insights found in machine data enable IT and Security teams to ensure uptime, detect fraud and identify threats. Today, forward-thinking organizations are discovering its value to better understand their customers, improve products, optimize marketing and improve business processes. Learn how Splunk and your machine data can deliver real-time insights from this new class of data and complement your existing BI investments.
Softcat Splunk Discovery Day Manchester, March 2017Splunk
This document provides an agenda for a Splunk conference on March 15th 2017 in Manchester. The agenda includes:
- An introduction and welcome from 09:30-09:45
- Two session from 09:45-12:15 on data-driven IT operations and best practices for security investigations
- A lunch break from 12:30-13:30
- The event concludes at 13:30
CL2015 - Datacenter and Cloud Strategy and PlanningCisco
This document discusses strategies for data center and cloud transformation over the next 5 years. It outlines key digital business trends like data growth, cloud adoption, and security threats that are driving organizations' IT initiatives. These include managing increased data and applications, optimizing cloud strategies, addressing disruptive business models, and securing distributed data and applications. The document advocates adopting flexible consumption models, automation, and supporting edge/IoT applications. It positions Cisco as uniquely able to enable digital transformations through its portfolio of networking, compute, storage, automation, analytics, and security solutions.
Virtual Gov Day - Application Delivery Breakout - OverviewSplunk
Splunk is an industry-leading platform that allows users to index and search machine-generated data from any source, in any format, at any scale, in real-time and historical. It provides operational intelligence capabilities like search and investigation, proactive monitoring, and real-time business insights. Splunk delivers value across IT operations, security, compliance, fraud detection, application delivery, and business analytics.
The document summarizes Splunk Enterprise 6.3, highlighting key new features and capabilities. It discusses breakthrough performance and scale improvements including doubled search and indexing speed and 20-50% increased capacity. It also covers advanced analysis and visualization features like anomaly detection, geospatial mapping, and single-value display. New capabilities for high-volume event collection and an enterprise-scale platform with expanded management, custom alert actions, and data integrity control are also summarized.
SplunkLive! Amsterdam 2015 - IT Ops breakoutSplunk
Learn about ways to improve you IT Operational Intelligence by using Splunk for troubleshooting, monitoring and service-level visibility. In this hands-on session we will cover recommended approaches for end-to-end troubleshooting and monitoring across applications, OSes, and devices to resolve problems faster, reduce downtime and improve user satisfaction and customer retention. Topics will include: monitoring critical services, using commonly deployed apps and TAs to gather data for IT infrastructure uses, and using of pre-made dashboard panels to quickly build dashboards for monitoring your environment.
.conf Go 2023 - Raiffeisen Bank InternationalSplunk
This document discusses standardizing security operations procedures (SOPs) to increase efficiency and automation. It recommends storing SOPs in a code repository for versioning and referencing them in workbooks which are lists of standard tasks to follow for investigations. The goal is to have investigation playbooks in the security orchestration, automation and response (SOAR) tool perform the predefined investigation steps from the workbooks to automate incident response. This helps analysts automate faster without wasting time by having standard, vendor-agnostic procedures.
.conf Go 2023 - Das passende Rezept für die digitale (Security) Revolution zu...Splunk
.conf Go 2023 presentation:
"Das passende Rezept für die digitale (Security) Revolution zur Telematik Infrastruktur 2.0 im Gesundheitswesen?"
Speaker: Stefan Stein -
Teamleiter CERT | gematik GmbH M.Eng. IT-Sicherheit & Forensik,
doctorate student at TH Brandenburg & Universität Dresden
El documento describe la transición de Cellnex de un Centro de Operaciones de Seguridad (SOC) a un Equipo de Respuesta a Incidentes de Seguridad (CSIRT). La transición se debió al crecimiento de Cellnex y la necesidad de automatizar procesos y tareas para mejorar la eficiencia. Cellnex implementó Splunk SIEM y SOAR para automatizar la creación, remediación y cierre de incidentes. Esto permitió al personal concentrarse en tareas estratégicas y mejorar KPIs como tiempos de resolución y correos electrónicos anal
conf go 2023 - El camino hacia la ciberseguridad (ABANCA)Splunk
Este documento resume el recorrido de ABANCA en su camino hacia la ciberseguridad con Splunk, desde la incorporación de perfiles dedicados en 2016 hasta convertirse en un centro de monitorización y respuesta con más de 1TB de ingesta diaria y 350 casos de uso alineados con MITRE ATT&CK. También describe errores cometidos y soluciones implementadas, como la normalización de fuentes y formación de operadores, y los pilares actuales como la automatización, visibilidad y alineación con MITRE ATT&CK. Por último, señala retos
Splunk - BMW connects business and IT with data driven operations SRE and O11ySplunk
BMW is defining the next level of mobility - digital interactions and technology are the backbone to continued success with its customers. Discover how an IT team is tackling the journey of business transformation at scale whilst maintaining (and showing the importance of) business and IT service availability. Learn how BMW introduced frameworks to connect business and IT, using real-time data to mitigate customer impact, as Michael and Mark share their experience in building operations for a resilient future.
The document is a presentation on cyber security trends and Splunk security products from Matthias Maier, Product Marketing Director for Security at Splunk. The presentation covers trends in security operations like the evolution of SOCs, new security roles, and data-centric security approaches. It also provides updates on Splunk's security portfolio including recognition as a leader in SIEM by Gartner and growth in the SIEM market. Maier highlights some breakout sessions from the conference on topics like asset defense, machine learning, and building detections.
Data foundations building success, at city scale – Imperial College LondonSplunk
Universities have more in common with modern cities than traditional places of learning. This mini city needs to empower its citizens to thrive and achieve their ambitions. Operationalising data is key to building critical services; from understanding complex IT estates for smarter decision-making to robust security and a more reliable, resilient student experience. Juan will share his experience in building data foundations for a resilient future whilst enabling digital transformation at Imperial College London.
Splunk: How Vodafone established Operational Analytics in a Hybrid Environmen...Splunk
Learn how Vodafone has provided end-to-end visibility across services by building an Operational Analytics Platform. In this session, you will hear how Stefan and his team manage legacy, on premise, hybrid and public cloud services, and how they are providing a platform for complex triage and debugging to tackle use cases across Vodafone’s extensive ecosystem.
.italo operates an Essential Service by connecting more than 100 million people annually across Italy with its super fast and secure railway. And CISO Enrico Maresca has been on a whirlwind journey of his own.
Formerly a Cyber Security Engineer, Enrico started at .italo as an IT Security Manager. One year later, he was promoted to CISO and tasked with building out – and significantly increasing the maturity level – of the SOC. The result was a huge step forward for .italo.
So how did he successfully achieve this ambitious ask? Join Enrico as he reveals the key insights and lessons learned in his SOC journey, including:
Top challenges faced in improving security posture
Key KPIs implemented in order to measure success
Strategies and approaches applied in the SOC
How MITRE ATT&CK and Splunk Enterprise Security were utilised
Next steps in their maturity journey ahead
This document summarizes a presentation about observability using Splunk. It includes an agenda introducing observability and why Splunk for observability. It discusses the need for modernization initiatives in companies and the thousands of changes required. It presents that Splunk provides end-to-end visibility across metrics, traces and logs to detect, troubleshoot and optimize systems. It shares a customer case study of Accenture using Splunk observability in their hybrid cloud environment. Finally, it concludes that observability with Splunk can drive results like reduced downtime and faster innovation.
This document contains slides from a Splunk presentation covering the following topics:
- Updated Splunk logo and information about meetings in Zurich and sales engineering leads
- Ideas for confused or concerned human figures in design concepts
- Three buckets of challenges around websites slowing, apps being down, and supply chain issues
- Accelerating mean time to detect, identify, respond and resolve through cyber resilience with Splunk
- Unifying security, IT and DevOps teams
- Splunk's technology vision focusing on customer experience, hybrid/edge, unleashing data lakes, and ubiquitous machine learning
- Gaining operational resilience through correlating infrastructure, security, application and user data with business outcomes
This document summarizes a presentation about Splunk's platform. It discusses Splunk's mission of helping customers create value faster with insights from their data. It provides statistics on Splunk's daily ingest and users. It highlights examples of how Splunk has helped customers in areas like internet messaging and convergent services. It also discusses upcoming challenges and new capabilities in Splunk like federated search, flexible indexing, ingest actions, improved data onboarding and management, and increased platform resilience and security.
The document appears to be a presentation from Splunk on security topics. It includes sections on cyber security resilience, the data-centric modern SOC, application monitoring at scale, threat modeling, security monitoring journeys, self-service Splunk infrastructure, the top 3 CISO priorities of risk based alerting, use case development, a security content repository, security PVP (posture, vision, and planning) and maturity assessment, and concludes with an overview of how Splunk can provide end-to-end visibility across an organization.
Best 20 SEO Techniques To Improve Website Visibility In SERPPixlogix Infotech
Boost your website's visibility with proven SEO techniques! Our latest blog dives into essential strategies to enhance your online presence, increase traffic, and rank higher on search engines. From keyword optimization to quality content creation, learn how to make your site stand out in the crowded digital landscape. Discover actionable tips and expert insights to elevate your SEO game.
Sudheer Mechineni, Head of Application Frameworks, Standard Chartered Bank
Discover how Standard Chartered Bank harnessed the power of Neo4j to transform complex data access challenges into a dynamic, scalable graph database solution. This keynote will cover their journey from initial adoption to deploying a fully automated, enterprise-grade causal cluster, highlighting key strategies for modelling organisational changes and ensuring robust disaster recovery. Learn how these innovations have not only enhanced Standard Chartered Bank’s data infrastructure but also positioned them as pioneers in the banking sector’s adoption of graph technology.
How to Get CNIC Information System with Paksim Ga.pptxdanishmna97
Pakdata Cf is a groundbreaking system designed to streamline and facilitate access to CNIC information. This innovative platform leverages advanced technology to provide users with efficient and secure access to their CNIC details.
Programming Foundation Models with DSPy - Meetup SlidesZilliz
Prompting language models is hard, while programming language models is easy. In this talk, I will discuss the state-of-the-art framework DSPy for programming foundation models with its powerful optimizers and runtime constraint system.
Essentials of Automations: The Art of Triggers and Actions in FMESafe Software
In this second installment of our Essentials of Automations webinar series, we’ll explore the landscape of triggers and actions, guiding you through the nuances of authoring and adapting workspaces for seamless automations. Gain an understanding of the full spectrum of triggers and actions available in FME, empowering you to enhance your workspaces for efficient automation.
We’ll kick things off by showcasing the most commonly used event-based triggers, introducing you to various automation workflows like manual triggers, schedules, directory watchers, and more. Plus, see how these elements play out in real scenarios.
Whether you’re tweaking your current setup or building from the ground up, this session will arm you with the tools and insights needed to transform your FME usage into a powerhouse of productivity. Join us to discover effective strategies that simplify complex processes, enhancing your productivity and transforming your data management practices with FME. Let’s turn complexity into clarity and make your workspaces work wonders!
UiPath Test Automation using UiPath Test Suite series, part 6DianaGray10
Welcome to UiPath Test Automation using UiPath Test Suite series part 6. In this session, we will cover Test Automation with generative AI and Open AI.
UiPath Test Automation with generative AI and Open AI webinar offers an in-depth exploration of leveraging cutting-edge technologies for test automation within the UiPath platform. Attendees will delve into the integration of generative AI, a test automation solution, with Open AI advanced natural language processing capabilities.
Throughout the session, participants will discover how this synergy empowers testers to automate repetitive tasks, enhance testing accuracy, and expedite the software testing life cycle. Topics covered include the seamless integration process, practical use cases, and the benefits of harnessing AI-driven automation for UiPath testing initiatives. By attending this webinar, testers, and automation professionals can gain valuable insights into harnessing the power of AI to optimize their test automation workflows within the UiPath ecosystem, ultimately driving efficiency and quality in software development processes.
What will you get from this session?
1. Insights into integrating generative AI.
2. Understanding how this integration enhances test automation within the UiPath platform
3. Practical demonstrations
4. Exploration of real-world use cases illustrating the benefits of AI-driven test automation for UiPath
Topics covered:
What is generative AI
Test Automation with generative AI and Open AI.
UiPath integration with generative AI
Speaker:
Deepak Rai, Automation Practice Lead, Boundaryless Group and UiPath MVP
AI 101: An Introduction to the Basics and Impact of Artificial IntelligenceIndexBug
Imagine a world where machines not only perform tasks but also learn, adapt, and make decisions. This is the promise of Artificial Intelligence (AI), a technology that's not just enhancing our lives but revolutionizing entire industries.
Goodbye Windows 11: Make Way for Nitrux Linux 3.5.0!SOFTTECHHUB
As the digital landscape continually evolves, operating systems play a critical role in shaping user experiences and productivity. The launch of Nitrux Linux 3.5.0 marks a significant milestone, offering a robust alternative to traditional systems such as Windows 11. This article delves into the essence of Nitrux Linux 3.5.0, exploring its unique features, advantages, and how it stands as a compelling choice for both casual users and tech enthusiasts.
Driving Business Innovation: Latest Generative AI Advancements & Success StorySafe Software
Are you ready to revolutionize how you handle data? Join us for a webinar where we’ll bring you up to speed with the latest advancements in Generative AI technology and discover how leveraging FME with tools from giants like Google Gemini, Amazon, and Microsoft OpenAI can supercharge your workflow efficiency.
During the hour, we’ll take you through:
Guest Speaker Segment with Hannah Barrington: Dive into the world of dynamic real estate marketing with Hannah, the Marketing Manager at Workspace Group. Hear firsthand how their team generates engaging descriptions for thousands of office units by integrating diverse data sources—from PDF floorplans to web pages—using FME transformers, like OpenAIVisionConnector and AnthropicVisionConnector. This use case will show you how GenAI can streamline content creation for marketing across the board.
Ollama Use Case: Learn how Scenario Specialist Dmitri Bagh has utilized Ollama within FME to input data, create custom models, and enhance security protocols. This segment will include demos to illustrate the full capabilities of FME in AI-driven processes.
Custom AI Models: Discover how to leverage FME to build personalized AI models using your data. Whether it’s populating a model with local data for added security or integrating public AI tools, find out how FME facilitates a versatile and secure approach to AI.
We’ll wrap up with a live Q&A session where you can engage with our experts on your specific use cases, and learn more about optimizing your data workflows with AI.
This webinar is ideal for professionals seeking to harness the power of AI within their data management systems while ensuring high levels of customization and security. Whether you're a novice or an expert, gain actionable insights and strategies to elevate your data processes. Join us to see how FME and AI can revolutionize how you work with data!
GraphSummit Singapore | The Future of Agility: Supercharging Digital Transfor...Neo4j
Leonard Jayamohan, Partner & Generative AI Lead, Deloitte
This keynote will reveal how Deloitte leverages Neo4j’s graph power for groundbreaking digital twin solutions, achieving a staggering 100x performance boost. Discover the essential role knowledge graphs play in successful generative AI implementations. Plus, get an exclusive look at an innovative Neo4j + Generative AI solution Deloitte is developing in-house.
HCL Notes and Domino License Cost Reduction in the World of DLAUpanagenda
Webinar Recording: https://www.panagenda.com/webinars/hcl-notes-and-domino-license-cost-reduction-in-the-world-of-dlau/
The introduction of DLAU and the CCB & CCX licensing model caused quite a stir in the HCL community. As a Notes and Domino customer, you may have faced challenges with unexpected user counts and license costs. You probably have questions on how this new licensing approach works and how to benefit from it. Most importantly, you likely have budget constraints and want to save money where possible. Don’t worry, we can help with all of this!
We’ll show you how to fix common misconfigurations that cause higher-than-expected user counts, and how to identify accounts which you can deactivate to save money. There are also frequent patterns that can cause unnecessary cost, like using a person document instead of a mail-in for shared mailboxes. We’ll provide examples and solutions for those as well. And naturally we’ll explain the new licensing model.
Join HCL Ambassador Marc Thomas in this webinar with a special guest appearance from Franz Walder. It will give you the tools and know-how to stay on top of what is going on with Domino licensing. You will be able lower your cost through an optimized configuration and keep it low going forward.
These topics will be covered
- Reducing license cost by finding and fixing misconfigurations and superfluous accounts
- How do CCB and CCX licenses really work?
- Understanding the DLAU tool and how to best utilize it
- Tips for common problem areas, like team mailboxes, functional/test users, etc
- Practical examples and best practices to implement right away
In his public lecture, Christian Timmerer provides insights into the fascinating history of video streaming, starting from its humble beginnings before YouTube to the groundbreaking technologies that now dominate platforms like Netflix and ORF ON. Timmerer also presents provocative contributions of his own that have significantly influenced the industry. He concludes by looking at future challenges and invites the audience to join in a discussion.
Infrastructure Challenges in Scaling RAG with Custom AI modelsZilliz
Building Retrieval-Augmented Generation (RAG) systems with open-source and custom AI models is a complex task. This talk explores the challenges in productionizing RAG systems, including retrieval performance, response synthesis, and evaluation. We’ll discuss how to leverage open-source models like text embeddings, language models, and custom fine-tuned models to enhance RAG performance. Additionally, we’ll cover how BentoML can help orchestrate and scale these AI components efficiently, ensuring seamless deployment and management of RAG systems in the cloud.
Full-RAG: A modern architecture for hyper-personalizationZilliz
Mike Del Balso, CEO & Co-Founder at Tecton, presents "Full RAG," a novel approach to AI recommendation systems, aiming to push beyond the limitations of traditional models through a deep integration of contextual insights and real-time data, leveraging the Retrieval-Augmented Generation architecture. This talk will outline Full RAG's potential to significantly enhance personalization, address engineering challenges such as data management and model training, and introduce data enrichment with reranking as a key solution. Attendees will gain crucial insights into the importance of hyperpersonalization in AI, the capabilities of Full RAG for advanced personalization, and strategies for managing complex data integrations for deploying cutting-edge AI solutions.
In the rapidly evolving landscape of technologies, XML continues to play a vital role in structuring, storing, and transporting data across diverse systems. The recent advancements in artificial intelligence (AI) present new methodologies for enhancing XML development workflows, introducing efficiency, automation, and intelligent capabilities. This presentation will outline the scope and perspective of utilizing AI in XML development. The potential benefits and the possible pitfalls will be highlighted, providing a balanced view of the subject.
We will explore the capabilities of AI in understanding XML markup languages and autonomously creating structured XML content. Additionally, we will examine the capacity of AI to enrich plain text with appropriate XML markup. Practical examples and methodological guidelines will be provided to elucidate how AI can be effectively prompted to interpret and generate accurate XML markup.
Further emphasis will be placed on the role of AI in developing XSLT, or schemas such as XSD and Schematron. We will address the techniques and strategies adopted to create prompts for generating code, explaining code, or refactoring the code, and the results achieved.
The discussion will extend to how AI can be used to transform XML content. In particular, the focus will be on the use of AI XPath extension functions in XSLT, Schematron, Schematron Quick Fixes, or for XML content refactoring.
The presentation aims to deliver a comprehensive overview of AI usage in XML development, providing attendees with the necessary knowledge to make informed decisions. Whether you’re at the early stages of adopting AI or considering integrating it in advanced XML development, this presentation will cover all levels of expertise.
By highlighting the potential advantages and challenges of integrating AI with XML development tools and languages, the presentation seeks to inspire thoughtful conversation around the future of XML development. We’ll not only delve into the technical aspects of AI-powered XML development but also discuss practical implications and possible future directions.
Removing Uninteresting Bytes in Software FuzzingAftab Hussain
Imagine a world where software fuzzing, the process of mutating bytes in test seeds to uncover hidden and erroneous program behaviors, becomes faster and more effective. A lot depends on the initial seeds, which can significantly dictate the trajectory of a fuzzing campaign, particularly in terms of how long it takes to uncover interesting behaviour in your code. We introduce DIAR, a technique designed to speedup fuzzing campaigns by pinpointing and eliminating those uninteresting bytes in the seeds. Picture this: instead of wasting valuable resources on meaningless mutations in large, bloated seeds, DIAR removes the unnecessary bytes, streamlining the entire process.
In this work, we equipped AFL, a popular fuzzer, with DIAR and examined two critical Linux libraries -- Libxml's xmllint, a tool for parsing xml documents, and Binutil's readelf, an essential debugging and security analysis command-line tool used to display detailed information about ELF (Executable and Linkable Format). Our preliminary results show that AFL+DIAR does not only discover new paths more quickly but also achieves higher coverage overall. This work thus showcases how starting with lean and optimized seeds can lead to faster, more comprehensive fuzzing campaigns -- and DIAR helps you find such seeds.
- These are slides of the talk given at IEEE International Conference on Software Testing Verification and Validation Workshop, ICSTW 2022.
4. 4
Escalating IT Complexity…
SERVERS STORAGE NETWORKING
VITUALIZATION
INFRASTRUCTURE
APPLICATIONS
PACKAGED
APPLICATIONS
CUSTOM
APPLICATIONS
Identity
VPN
IP Phone
HR
Email
Finance
App Svr
DB
Web Svr SaaS/PaaS
IaaS
5. 5
… Plaguing IT Operations
SERVERS STORAGE NETWORKING
VITUALIZATION
INFRASTRUCTURE
APPLICATIONS
PACKAGED
APPLICATIONS
CUSTOM
APPLICATIONS
Identity
VPN
IP Phone
HR
Email
Finance
App Svr
DB
Web Svr SaaS/PaaS
IaaS
Complex, silo-based technologies
Disconnected and outdated point solutions
Reactive brute-force problem resolution
Over 80% of time on maintaining not innovating
6. 6
Industry Leading Platform for Machine Data
Any Machine Data
Online
Services Web
Services
Servers
Security GPS
Location
Storage
Desktops
Networks
Packaged
Applications
Custom
ApplicationsMessaging
Telecoms
Online
Shopping
Cart
Web
Clickstreams
Databases
Energy
Meters
Call Detail
Records
Smartphones
and Devices
RFID
Datacenter
Private
Cloud
Public
Cloud
Enterprise
Scalability
Search and
Investigation
Proactive
Monitoring
Operational
Visibility
Real-time
Business
Insights
Operational Intelligence
7. 7
Industry Leading Platform for Machine Data
Any Machine Data
Online
Services Web
Services
Servers
Security GPS
Location
Storage
Desktops
Networks
Packaged
Applications
Custom
ApplicationsMessaging
Telecoms
Online
Shopping
Cart
Web
Clickstreams
Databases
Energy
Meters
Call Detail
Records
Smartphones
and Devices
RFID
Datacenter
Private
Cloud
Public
Cloud
Enterprise
Scalability
Search and
Investigation
Proactive
Monitoring
Operational
Visibility
Real-time
Business
Insights
Operational Intelligence
Any amount, any location, any source
Schema-
on-the-fly
Universal
indexing
No
back-end
RDBMS
No need
to filter
data
8. 8
Developer Platform (REST API, SDKs)
The Focus
Application
Delivery
IT
Operations
Security,
Compliance,
and Fraud
Business
Analytics
Industrial Data
and the
Internet of Things
9. 9
Turning Machine Data Into Operational Intelligence
Reactive
Search
and
Investigate
Proactive
Monitoring
and Alerting
Operational
Visibility
Proactive
Real-time
Business
Insight
10. 10
Troubleshooting
Find and fix problems faster
Reduce
MTTR
Improve End User
Experience
Reduce Costs
Greater IT
productivity
11. 11
Troubleshooting
Find and fix problems faster
Reduced
MTTR
Improve End User
Experience
Reduce Costs
Greater IT
productivity
No more grepping through logs
End-to-end correlation
12. Monitoring
Find and fix problem before it becomes a problem
Increased uptime
Trends in real time
and Historical Data
Powerful
Visualizations
Alerting and
notifications
14. 14
Splunk Apps
Plug-Ins, Templates and Apps Accelerate Value From Machine Data
No rigid schemas– Add in data from any other source.
API
SDKs UI
Server, Storage,
Network
Server
Virtualization
Operating
Systems
Custom
Applications
Business
Applications
Cloud
Services
App Performance
Monitoring
Ticketing/ and Other
Web Intelligence
Mobile
Applications
Stream
15. 15
Apps Provide Deep Insights By Role
Find and resolve problems fast in individual technology areas
Exchange Admin
Service Health
Performance
Message tracking
VMware/Win/
Linux Admin
Infrastructure Health
Performance
Anomalies/Outliers
Storage Admin
Infrastructure Health
Performance
Anomalies/Outliers
17. What We Hear From Our Customers!
“My CIO is demanding we look at IT from a business service perspective.”
“Splunk is great for break-fix, but I need to show we’re meeting SLAs.”
“I need everyone to be able to see the same thing at the same time.”
“I just want to throw data at Splunk and have it find problems for me.”
“Show me what my data can do for me!”
21. 21
What is a Service?
Service
Requests
Responses
In Splunk ITSI, a Service is a logical group of technology components that a user
deems need to be monitored together.
It can often be generalized as a “black box” which we send requests and expect
responses
22. 22
What is a Service?
DNS
Requests
Responses
Technical Services
Auth
Requests
Responses
Web
Requests
Responses
Services can be technology-centric…
23. 23
What is a Service?
DNS
Requests
Responses
Technical Services
Customer
Transactions
Requests
Responses
Business Services
Auth
Requests
Responses
Web
Requests
Responses
Support Desk
Requests
Responses
… and business-centric
24. 24
What is a Service?
Packet Network
Hypervisor and Hosts
RBMDBs
Storage Tier
API Services
Web Services
CustomerTransactions
Mobile
API/Middleware
PartnerPortal
DNS
Services can encompass multiple tiers of the IT domain and may also
depend upon other services/micro-services
25. 25
What is a KPI?
DNS
Requests
Responses
KPI: Number of requests
KPI: Error rate
KPI: Average response time
KPI: Servicer CPU load
KPI: Server network I/F errors
Customer
Transactions
Requests
Responses
KPI: Number of transactions
KPI: Error rate
KPI: Average response time
KPI: Count of Incident Tickets
KPI: Synthetic Transx Health
KPIs and Health scores constitute the means by which Services are monitored.
26. 26
Key Performance Indicators (KPIs)
26
KPI: A Splunk saved search defined in Splunk ITSI that helps monitor a specific field like CPU,
Memory and so on. KPIs are contained within Services.
27. 27
Service Health Scores
27
A Health score is a score from 0-100 that helps determine the health of a Service. It
is calculated based on all KPIs importance and its status once every minute.
29. 29
Service Analyzer, Glass Tables, Deep Dives
29
Service Analyzer: Auto generated filterable and tiled view of Service health scores and KPIs
Glass Tables: Customizable free form drawing dashboards to view health scores and KPIs of choice
with visual tools to create context
Deep Dives: Swim lane analysis dashboard to show all those indicators over time for investigations
30. 30
Multi KPI Alerts, Notable Events
30
Multi KPI Alerts: Correlation searches on service degradation
Notable Events: Event framework for Multi KPI Alerts
32. 32
What Makes Splunk ITSI Different!
Search-BasedKPIs
• Easy to write, manage and change
both services and KPIs
• Reflects business and technology
priorities
• Benefit: Rapidly generate and
change KPIs to align service health
with business
• Fiserv – 1000s in just weeks
FullFidelityServiceHealth
• Adaptable and flexible
definitions of service health
• One solution to go seamlessly
from service reports to root
cause, including raw data
• Remains adaptable and yet still
maintains complete historical
context
UniversalDataPlatform
• Data driven: All IT data including
events, metrics and logs
• Schema on-the-Fly
• Ask any question of the
data
• Fast time to value
• Data fidelity
34. 34
Why Enterprises Use Splunk for IT Operations
Increased Uptime
to 99.9%
Availability
Reduced MTTR
from 2-3 days to
few minutes
Improved Margins
by protecting millions in
ad-revenue
Consolidated Tools
by retiring 27 monitoring
solutions
Optimized Capacity
by saving $500K in
SW, HW & licenses
Drives Innovation
with usage analytics on
product features
35. 35
Splunk IT Service Intelligence at
Unified insights: data
integrations from other tools
11,000 to 100s
Reduced incident
tickets
Alerting on service
KPI’s instead of
server performance
Usage baselines to
identify anomalies
36. 36
Splunk IT Service Intelligence at
Server-based to
Services-based
monitoring
Top-down and deep-
dive service insights
200+ services and
1500+ KPIs
monitored
Flexible creation and
modification of
services and KPIs
Alerting on service
KPIs instead of
server performance
Real-time, holistic
and proactive
“client” view
37. 37
Splunk IT Service Intelligence at
Replaced home-
grown tools
Real-time service
insights to LOBs
Reduced time to
resolution
There has been an explosion of growth of IT data center technologies, IoT mobile, distributed apps, virtualization. What this brought is increased efficiency and utilization, however at the same time there was escalating IT complexity. <click>
Lots of disparate and complex and siloed based solutions If you need to find a solution to a problem you maybe need to get a war room ready, finger pointing and trying to debug an issue in production environment. You maybe using hours and hours trying to find a solution. Often times it is a brute force approach when you need to restart the system, so brute-force approach is something used.
So IT is no longer spending time on innovating but losing valuable time on keeping the the lights on or fighting fires.
Splunk Enterprise is fully featured, platform for collecting, searching, monitoring and analyzing machine data and getting operational intelligence. You can monitor both real-time (as the data is streaming) and historical data. Splunk collects machine data securely and reliably from wherever it’s generated in any formant. It stores and indexes the data in real time in a centralized location and protects it with role-based access controls. You can troubleshoot your network problems and investigate security incidents in minutes (not hours or days). Monitor your end-to-end infrastructure to avoid service degradation or outages. Gain real-time visibility and critical insights into customer experience, transactions and behavior.
<click>We don’t require you to understand your data and have predefined schema and requirements. You don’t need to have expensive custom connecters to get data into Splunk. We have our own map reduced based high speed data index and retrieval mechanism. We can index the data from any part of your infrastructure. We scale from a single server to petabytes of data and you can use commodity x86 hardware. And you can store data in the cloud as well if you don’t want to manage your Splunk instance. So what you can start getting into the core of the problem, If you have a system that does not have proactive capabilities you can do that with Splunk Enterprise. And expand from there into security, capacity planning applications management – truly big gold mine of use cases from your data. And our customers once they start to gain that operational visibility they evolve to getting deeper insights from your data. No database in the backend as we apply schema on the fly. You need raw data to be able to re-use it. We are creating intelligence on top of the data therefore easy scaling.
Most companies start using Splunk in one of these 5 areas, and typically as more teams use Splunk it traverses each of these 5 areas. Both IT and business professionals can analyze machine data to get real-time visibility and operational intelligence. With our platform for machine data, organizations can meaningfully improve their performance in a wide range of areas e.g. meet service levels, reduce costs, mitigate security risks, maintain compliance and gain insights.
Today we are going to focus on some of the major use cases and values related to the IT Operations space.
In IT Operations, this maturity model is a great template/mainstay when it comes to how Splunk is utilized. Most teams have downloaded Splunk on a laptop and from there it gets scaled to a server and to multiple server, etc. The idea from an ITOps maturity model is very much the same—
Search and investigation. Using Splunk, organizations identify and resolve issues up to 70% faster and reduce costly escalations by up to 90%. Splunk is one place to find and fix problems, and investigate incidents across all your IT systems and infrastructure.
Proactive monitoring. Monitor IT systems in real time to identify issues, problems and attacks before they impact your customers, services and revenue. Splunk keeps watch of specific patterns, trends and thresholds in your machine data so you don't have to. Trigger notifications in real-time via email or RSS, execute a script to take remedial actions, send an SNMP trap to your system management console or generate a service desk ticket.
Operational visibility. See the whole picture, track performance and make better decisions. Visualize usage trends to better plan for capacity; spot SLA infractions, track how you are being measured by the business. Do all of this using your existing machine data without spending millions of dollars instrumenting your IT infrastructure.
Real-time business insight. Make better-informed business decisions by understanding trends, patterns and gaining Operational Intelligence from your machine data. See the success of new online services by channel or demographic, reconcile 3rd-party service provider fees against actual use, find your heaviest users and heaviest abusers, and more. Because machine data captures every behavior, the possibilities are game changing. You'll find the lead times to get to this intelligence dramatically less than other solutions - measured in minutes/hours instead of months.
Who is at Search and Investigate? Raise your Hands. Proactive Monitoring and Alerting? Raise your Hands. Operational Visibility? Raise your Hands. Real-time Business Insight? Raise your Hands.
Who thinks it makes sense for all of us to have our business at Real-time Business Insight? Why?
So how do we get there?
Reduce MTTR
Correlate data from all levels/layers of the stack
Time series
Flexible search and drill down
No more grepping through logs
Reduce MTTR
Correlate data from all levels/layers of the stack
Time series
Flexible search and drill down
No more grepping through logs
Increase uptime
See trends of realtime data and historical data
Powerful visualizations
Alerting
Let’s take a look.
[INTRODUCE DEMO PRESENTER]
[HAND OFF AV TO DEMO MACHINE FEED]
Over the last couple of years Splunk has evolved from an engine for machine data to a platform for machine data – nothing is a testimony of this more than our Apps store apps which range from plugins and templates to full fledged apps that help you collect, analyze and harness data from every layer of your technology stack. These apps are built by our customers, technology partners such as Cisco, NetApp, or others and Splunk employees. We are a platform as it is very easy to get data into Splunk and out of Splunk. We are complementing other solutions in the data center
Two important things to remember:
If a logo you have doesn't show up here, Splunk still doesn't’t limit you – you can always index data from that technology – Splunk extensions simply help you accelerate the process.
We provide a full featured REST API and a variety of SDKs that help you build your own custom apps for technologies and insights custom to your business. This is to help you create a specific interface to your data in special format and development languages your team is used to.
Lastly, each of the Splunk extensions is not comparable to point solutions in every silo, simply because your data from each silo is more valuable when in context of other data from other technology tiers. Splunk apps simply help you get to the point faster where you can see correlations and comparisons of machine data ACROSS silos.
We also recently introduced the 2 new offerings – one to collect wire data, with the Splunk App for Stream (stemming from the acquisition of Cloudmeter) and MINT (Mobile Intelligence) that stems from our acquisition of Bugsense. The Splunk App for Stream enables the capture of real-time streaming wire data, which is the data transmitted between applications over the network. It enables visibility into application, business and user activity without the need for instrumentation, enhancing various operational use cases across IT, security and the business.
And Splunk MINT helps you gain visibility into mobile app performance and quality, so you can deliver better mobile apps
Splunk MINT helps you combine and correlate mobile app data with other data in Splunk so you can pinpoint problems faster and analyze user experience/behavior across mobile, desktop and web channels.
The main value from the apps is providing context for data from silos and making it available inside Splunk for correlation with other data from other silos.
In addition to prebuilt apps, customers can also build their own.
What have developers been building using Splunk Enterprise? Examples include the following:
Run searches and retrieve Splunk data from existing Customer Service/Call Center applications (Comcast use case)
Integrate Splunk data into existing BI tools and dashboard (Tableau, MS Excel)
Build mobile applications with KPI dashboards and alerts powered by Splunk (Otto Group use case)
Log directly to Splunk from remote devices (Bosch use cases)
Build customer-facing dashboards powered by user-specific data in Splunk (Socialize, Hurricane Labs use cases)
Programmatically extract data from Splunk for long-term data warehousing
We hope this is just the beginning. We hope to open up a whole new world of enterprise apps.
With Apps, you can accelerate insights into specific issue or a problem area. For example if you are focusing on Exchange, you want to understand what is the service health are messages going through, do I have any security issues. If you are a Virtualization or storage admin, you want to understand what is going on with your infrastructure, Am I forecasting proper resources for capacity growth? How are my applications affected by storage latency? Do I have enough storage capacity? Our Apps can provide you with these insights since we have visibility into specific siloes.
Let’s take a look at deeper dive.
Splunk is a scalable platform for machine data, that allows you to interact with the data to solve various use-cases. Initially we were founded one enabling IT administrators to solve IT challenges but over the years we’ve manifested this into various other use cases including Application Management, Security and Compliance (the top 3 being our core use-cases) and the evolving use cases are around Business Analytics and IoT, all of which has been led by our customers.
As our customers grow their asks from Splunk also began to evolve. They were looking for an integrated holistic packaged solution that will not only help them break-down silos, but apply machine learning to enable their IT practitioners to help arm them with the right data at the right time. They want to exploit the data they have within Splunk to discover new ways to improve their operations and drive business priorities and growth. Our customers wanted to up-level the insight machine data gave them. Not only did they want to immediately address the operational problems but also wanted visibility into whether they are meeting SLA’s, what impact performance is having to the business.
That brings us to Splunk IT Service Intelligence – a packaged solution that enables real-time visibility into services driven by machine data.
Splunk ITSI speeds and simplifies service monitoring and analytics and enables IT to make better, smarter and informed business decisions.
This solution allows you to gain a deep understanding of your services. With Splunk ITSI, you have real-time views into the health of your services, and can use advanced analytics to find patterns, detect anomalies and trends to proactively monitor and address issues.
As a result you have improved service visibility, reduced resolution times, and a transformative approach to monitoring and analytics driven by machine-data.
The foundation principles of Splunk ITSI was to leverage the power of our platform and maximize the value you can get from not only the machine data indexed but also from all the flexibility and fast time to value we’ve already proven that we can deliver on. Our platform and Splunk ITSI can scale to index terabytes of data (in the Cloud and On-premise) and it does not require months of implementation. Additionally, the solution is flexible – you can customize your insights on-the-fly and on-demand. As your IT and business needs evolve you can customize your views in Splunk ITSI to gain real-time insights into these new performance and business indicators/needs. The ability to interact with the data on-the-fly without costly customizations is a huge plus.
Secondly, we wanted to surface the analytics capabilities to enable machine-data driven monitoring. The solution uses machine learning to detect anomalies, identify baselines and have the system dynamically adapt thresholds. You can proactively notify events thru pre-defined cross KPI correlations and there’s more. Essentially, we’re transforming the approach to monitoring with analytics driven by machine data.
Lastly, and very much to the response of our customers, we wanted to redefine the role of IT as being strategic to the business. For the longest time, there has been a persisting need for IT to align with the business. With Splunk ITSI, we enable both IT and the business stakeholders of various services to gain real-time insights into critical performance indicators, in a way that makes most sense to them.
With ITSI, we’re fast tracking how you get insights into your services and key performance indicators, whether that insight is focused on individual technology silos or services, micro-services, applications or business processes using a platform you already love.
A services can literally be sources of data a customer wants to group together to monitor in a single healthscore or just wants to logically group together because they need to be managed by a specific team or needs to be reported in such a way. Services derive their value when KPIs are defined within them or dependencies are defined to other services. Therefore you could have a more abstractly defined service which only depends on other services to derive its own health. E.g. Partner portal is a conceptual service which depends on the API service which in turn has its own KPIs but depends on Web Services. Alternatively you could have Partner portal depend on each and every one in blue, or not even have all the ones in blue and have all the Kpis be inside Partner portal. Everything you see in the diagram above could be a service in ITSI.
KPIs are created by the user and the user has to define which Splunk field to monitor, what stat operations to use (e.g. avg cpu, max cpu etc.), what the thresholds for good bad ugly should be, what the frequency of monitoring that field should be and how important it is towards the health of the service.
Images: KPIs on the left, health scores on the right.
These are the 4 main dashboards that are in ITSI, SA is for the quick view and quick filtering to see only the Services and KPIs of choice, Glass table is for those who want to represent their own workflow and want to take the time to make things look pretty. Deep Dive is for the investigative work when things go wrong, Multi KPI alerts is to build alerts for when there is a desire to be alerted by email or just view the notable event review dashboard (like Incident review in ES).
Think ES when talking about notable events. They are nearly identical to ES notable events other than the fact that they are some other fields like Service and the actions you can perform on them are a little different. Like going to Deep Dive or creating ticket in service now. The correlation searches that create these notable events can be designed through the correlation search interface like in ES, or through the Multi KPI alert UI. They are stored in the notable events summary index.
Available on HOD
What makes Splunk ITSI different is not only all the cool visualizations that you just saw in the premium solution, but more importantly, the platform that it was built on top of.
Just about every CIO or Ops Executive we talk to is frustrated with Manual Integration within and across tools and Correlation issues with their current Service Management and Monitoring Solutions. The number of tools they’ve had to buy, deploy, administer, and attempt to integrate just don’t live up to their original promises.
An impact of this lack of integration and correlation is the customer’s difficulty meeting or accurately measuring their SLAs.
One way that Splunk differs from existing approaches is that it is a Universal Machine Data Platform which allows you to reliably collect, index, prepare and store data from tens of thousands of sources, in real time -- any type, any format, any location with no pre-defined schema. We are data driven. We take in all the data. Splunk is also in network latent real time and can leverage historical data as well.
To avoid the problems associated with adding or changing Alerts, Splunk delivers Schema on the Fly to provide for rapid creation of alerts from either KPIs or raw data to adapt to business needs quickly. Splunk applies structure at search time, making it easy to search, visualize and analyze your data without any knowledge of the underlying structure. No DBA is required! We also use machine learning to baseline normal operations, detect anomalous behavior to drive meaningful actions, and enable highly correlated searches to create meaningful “alerts” off your KPIs, not ours. And, you get the information from the data that you need when you need it. With Splunk, you can ask any question of the data any time!
Splunk’s powerful platform helps you to realize faster time to value as it leverages all of the data, allows you to answer any questions of the data and empowers the greatest data fidelity
With existing Event Driven solutions, our customers tell us that getting true Service Intelligence is a challenge. Today, Service Owners tell us that they determine Service Health through summarized events that have limited retention time.
The business impact here surrounds the time and expense in identifying root cause and fixing the problem
To address this, Splunk ITSI delivers a 360 degree view of service health from one place. We call this Full Fidelity Service Health. We allow for adaptable and flexible definitions of service health. Customers can now move seamlessly from Business Service Reports to Remediation, all while providing complete historical context. Our solution remains adaptable and yet still maintains complete historical context. Want to visualize and measure what was happening 10 minutes ago?… an hour ago?… Not a problem. This unique differentiation enables Splunk ITSI to deliver a seamless, connected experience from reporting through to remediation.
The ability to leverage Deep Dive Incident Reviews, delivers event, metrics and KPIs – including ad hoc, on the fly searches – you can see and correlate complex interactions easily. And like we just discussed, with full access to historical data, you can compare any two time ranges for all data sets side by side to quickly understand what’s ‘normal’ for that Service by minute, hour, day or week regardless of size or scale.
Every day we hear from customers that change is a constant and the Legacy Service Management solutions struggle with keeping up. With Legacy Solutions, Service Definitions come from Legacy CMDBs that come with questionable data quality. We also hear that it is hard to create new KPIs to keep everything relevant to the Business.
The impact that we hear from Service Owners is that the business perceives IT as being inefficient.
So what else does Splunk ITSI do here that is different? Search Based KPIs deliver a flexible way to impose schema only at retrieval, without a pre-defined schema or hard coded collectors. Often the business may need to see new KPIs or change existing ones. You can easily write, manage and change both services and KPIs so that you can best align business and technology priorities. An example of this in action comes from one of our Beta customers, Fiserve. With Splunk ITSI, Fiserve was able to generate 1000s of KPIs in a manner of weeks. They were able to easily write, manage and change both services and KPIs.
Splunk runs on-prem, in the Cloud or in hybrid environments while collecting data from all the newest technologies.
Our visualizations and analytics are one-of-a-kind. They can be personalized, meaningful, and contextual. Better visualizations and analytics provide and enable IT with actionable insights. Every one can look at the data in the manner that is most relevant to them.
We have many. And now More than 9000 enterprises, government agencies, universities and service providers in 100 countries use Splunk software to deepen business and customer understanding
Here we see the benefits customers are getting from Splunk they presented their use cases at recent Splunk Lives
Quest Diagnostics – within one hour time there are processing one million of dollars worth of revenue. In their web facing application they were reliant on manual Perl and Unix information to actually look at that data. After they introduced Splunk Enterprise, they were able to monitor that data from applications availability and infrastructure and increased up time to 99.9%
Safeway they have many monitoring tools in their environment. They use Splunk as a centralized platform to monitor that data. They saved huge amount of money by consolidating their monitoring tools and retiring 27 tools and Splunk is deployed as centralized monitor across their data.
DirectTV: They Introduced NFL streaming service (2011) . They did not realize the impact on the infrastructure. They ended up spending ~150k to beef up the servers and that still did not help. Post Splunk they were able to improve their margins because now they were able to dynamically adapt their infrastructure to the service they are offering.
Vodafone is the world’s second largest telecommunications company and provides voice, messaging, data, and fixed communications to over 400 million customers. Vodafone’s offshore IT operations team lacked visibility into the health and performance of the services that were getting rolled out constantly by the project teams, designers and architects in Germany. For example, Vodafone recently rolled out Identity Access Manager, a complex Oracle & WebLogic stack‐based application that governs identity management for Vodafone. Vodafone, an existing Splunk customer, now relies on Splunk IT Service Intelligence to provide its offshore team with the insights they need to support, troubleshoot and monitor services, in real-time. Splunk IT Service Intelligence is integrated with HP Business Service Management and the team can now use the KPIs in IT Service Intelligence to see trends and detect patterns and anomalies, enabling them to act upon that data proactively. With data from Vodafone’s Remedy systems the operations team can also easily see various KPIs including number of open tickets, the status of these tickets and number of impacted users.
With Splunk IT Service Intelligence, Vodafone is able to gain end-to-end visibility of the performance and behavior of their IT services, allowing them to improve the performance and uptime of critical services and reducing the number of incident tickets opened every day from over 11,000 to hundreds, improving customer satisfaction and reducing support costs.
“Splunk IT Service Intelligence gives Vodafone a real-time understanding of how our services are performing overall and at the more granular level," said Oliver Hoppe, solutions architect, Vodafone. "We have KPIs mapped to critical service components and can provide relevant insights to stakeholders across the business, including management, service owners and the security team. The glass table visualizations in Splunk ITSI make it quick and easy to identify and resolve any issues, preventing any impact on our users. Now we can be much more proactive about our services.
Fiserv is a global financial services technology provider behind essential services such as mobile and online banking, payments, risk management, data analytics and core account processing - more than 1 in 3 U.S. financial institutions rely on Fiserv for core processing services. Lacking a consistent monitoring approach and frustrated with too many tools, Fiserv initially deployed Splunk Enterprise to deploy Splunk to collect and process data that can feed into existing incident management process. While Splunk Enterprise was supporting faster troubleshooting and issue resolutions, Fiserv needed a way to quickly react to changing environment conditions to alert and prevent reoccurring events BEFORE they happened. The team was struggling to build Splunk dashboards that surfaced the right information and led to decisive action. Fiserv also needed to perform continual education across business units, across support tiers and across shifts on the latest dashboards that looks for specific client impacting conditions. The team had a mandate to achieve these goals in just 90 days. Enter Splunk IT Service Intelligence – with Splunk ITSI, Fiserv was able to:
Deliver service based monitoring in a much shorter time frame
Empower a tier 1 user with a tool kit to triage and act as a higher tier
Develop model out of a problem review to add new KPIs to roll into the service as a hole.
Easily correlate issues through a drill down and determine cause vs effect and then dive right into the logs
Fiserv leveraged Splunk IT Service Intelligence to enhance their service-based monitoring and empower their users. With Splunk IT Service Intelligence, the Fiserv team is able to collect and process data from multiple sources and locations and integrate that data into an existing incident management process.
…all within 90 days from inception to delivery.
AdvancedMD is a leading provider of cloud-based, software solutions for independent physician practices. As a critical part of their business, AdvancedMD must closely monitor the delivery of its services to up to 15,000 users who log into its systems daily. The firm’s IT staff must make sure that applications are always available and the supporting infrastructure is not overtaxed and can meet demand. Existing monitoring tools could not provide an end-to-end view of the services they needed to maintain, particularly their claims service. AdvancedMD has thousands of daily global users who initiate claims, and they’re using Splunk IT Service Intelligence to monitor the end-to-end health of their claims service, which spans multiple systems and environments, and is critical to their business. With Splunk ITSI, Advanced MD was able to reduce MTTR, replace brittle home-grown monitoring tools and improve the uptime and reliability.
“Splunk IT Service Intelligence was delivering insights days after installing, instead of the months it can take legacy monitoring solutions. Splunk ITSI helps us ensure that the claims service stays up and running at all times.” - Tyler Germer, director of information technology, AdvancedMD.
Let’s take a closer look at few of the apps we are highlighting here. We will mention few Splunk supported Apps. We are investing in these apps and provide full support for them.
Splunk provides a platform for IT and the business to gain visibility, insights and intelligence from all machine data
Strong ecosystem of apps to deliver end-to-end operational visibility enabling IT to reduce costs, consolidate tools and eliminate silos
Splunk delivers Operational Intelligence allowing IT to go beyond troubleshooting & maintenance to enabling business insights and growth