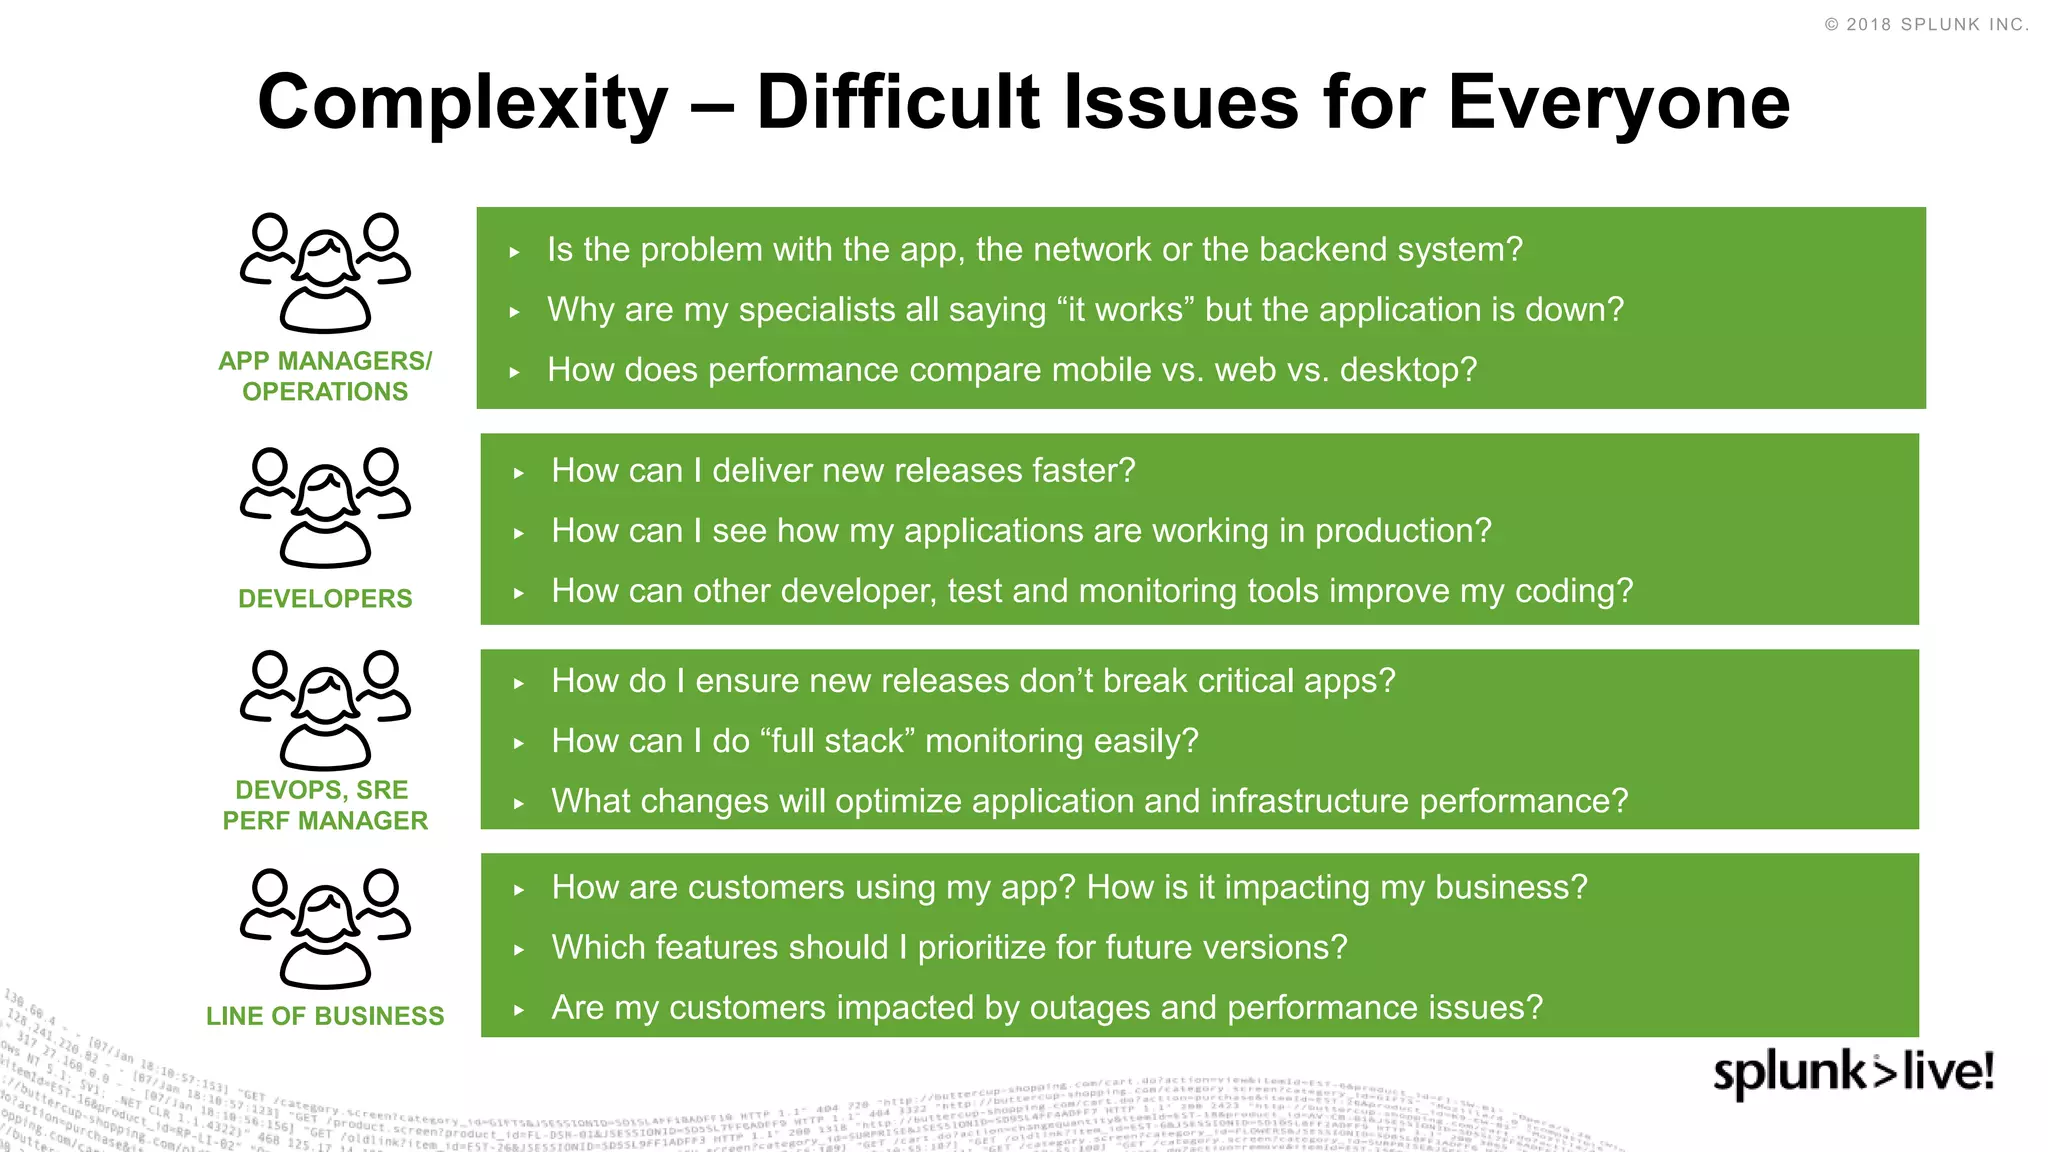
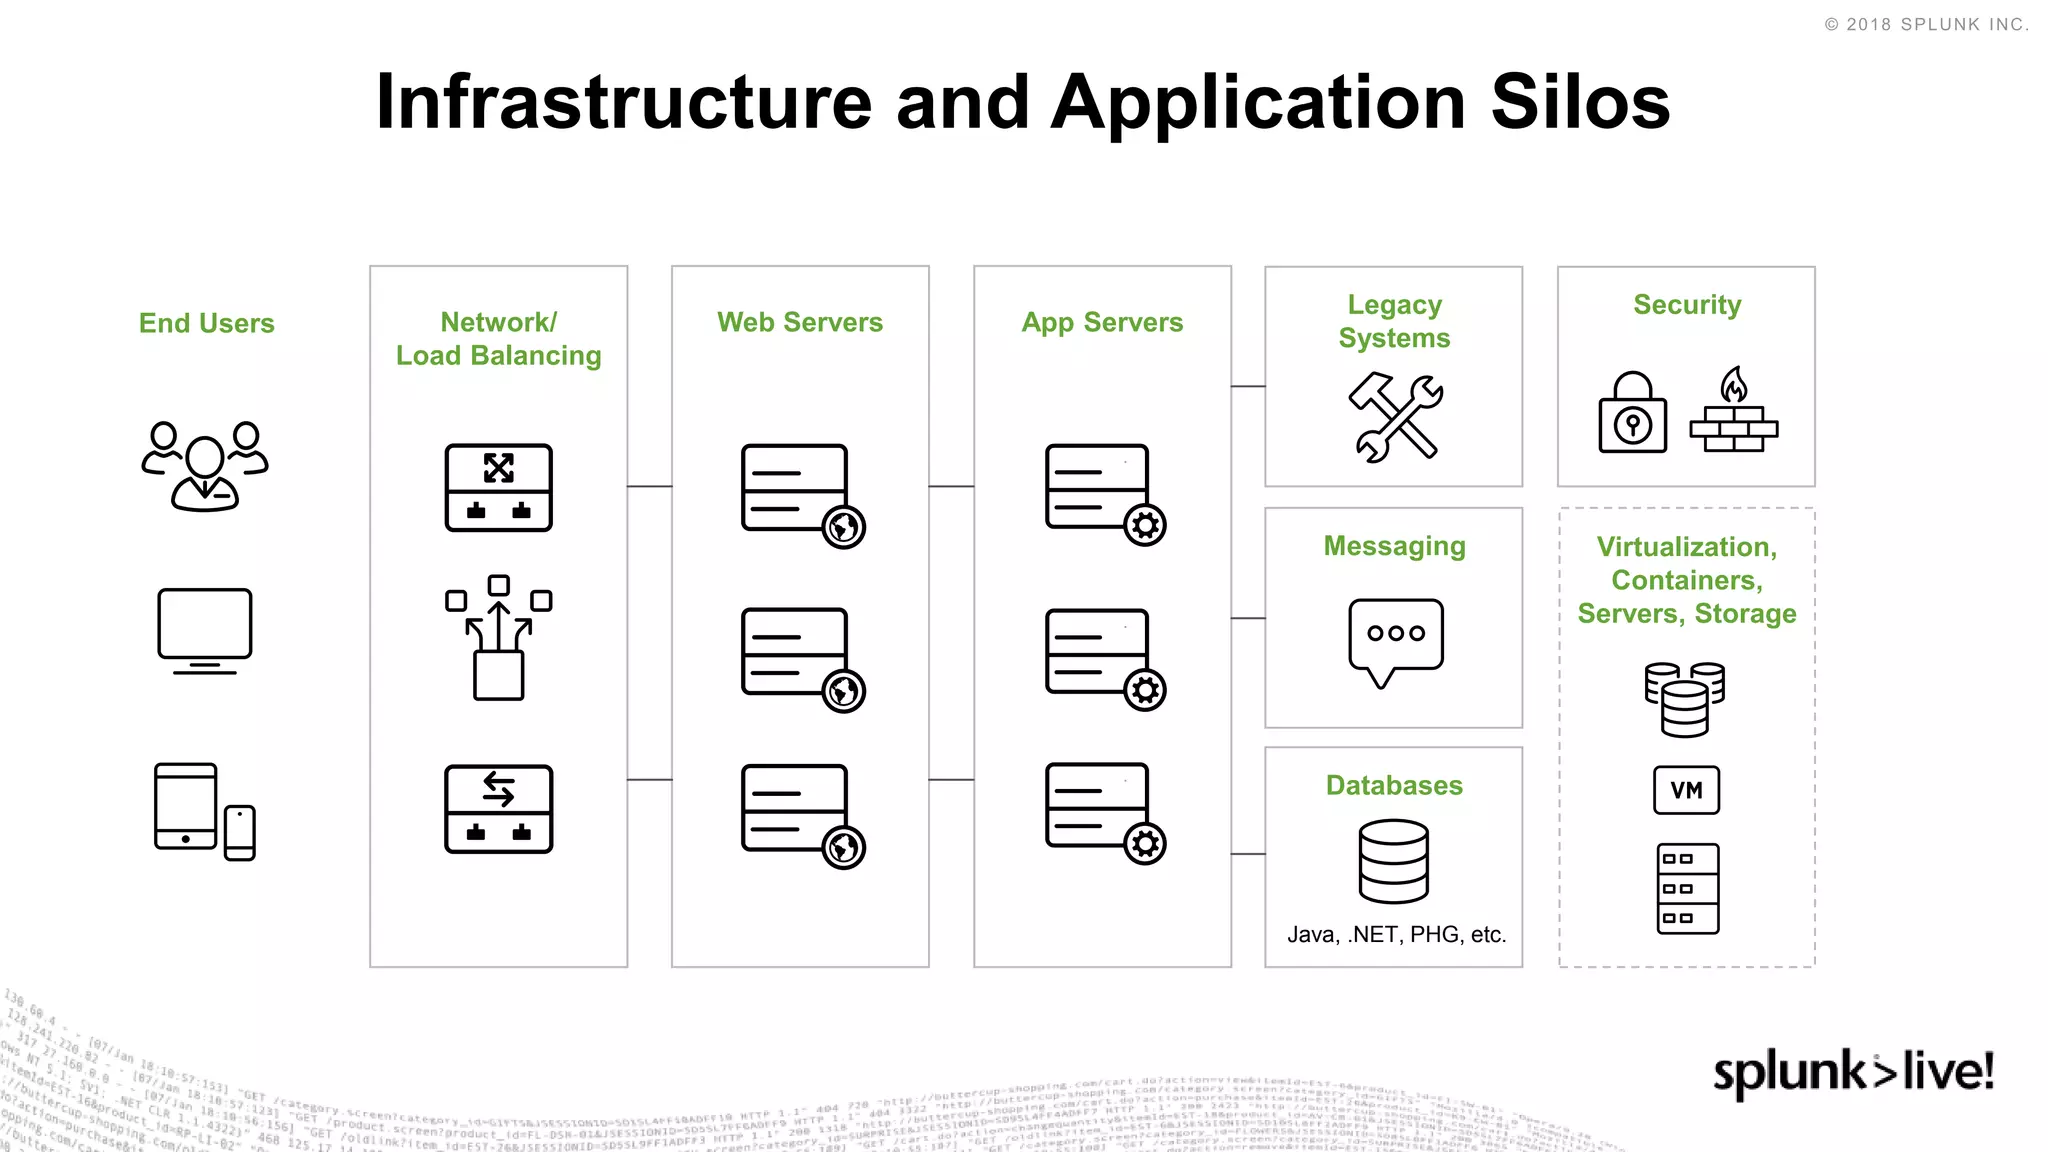
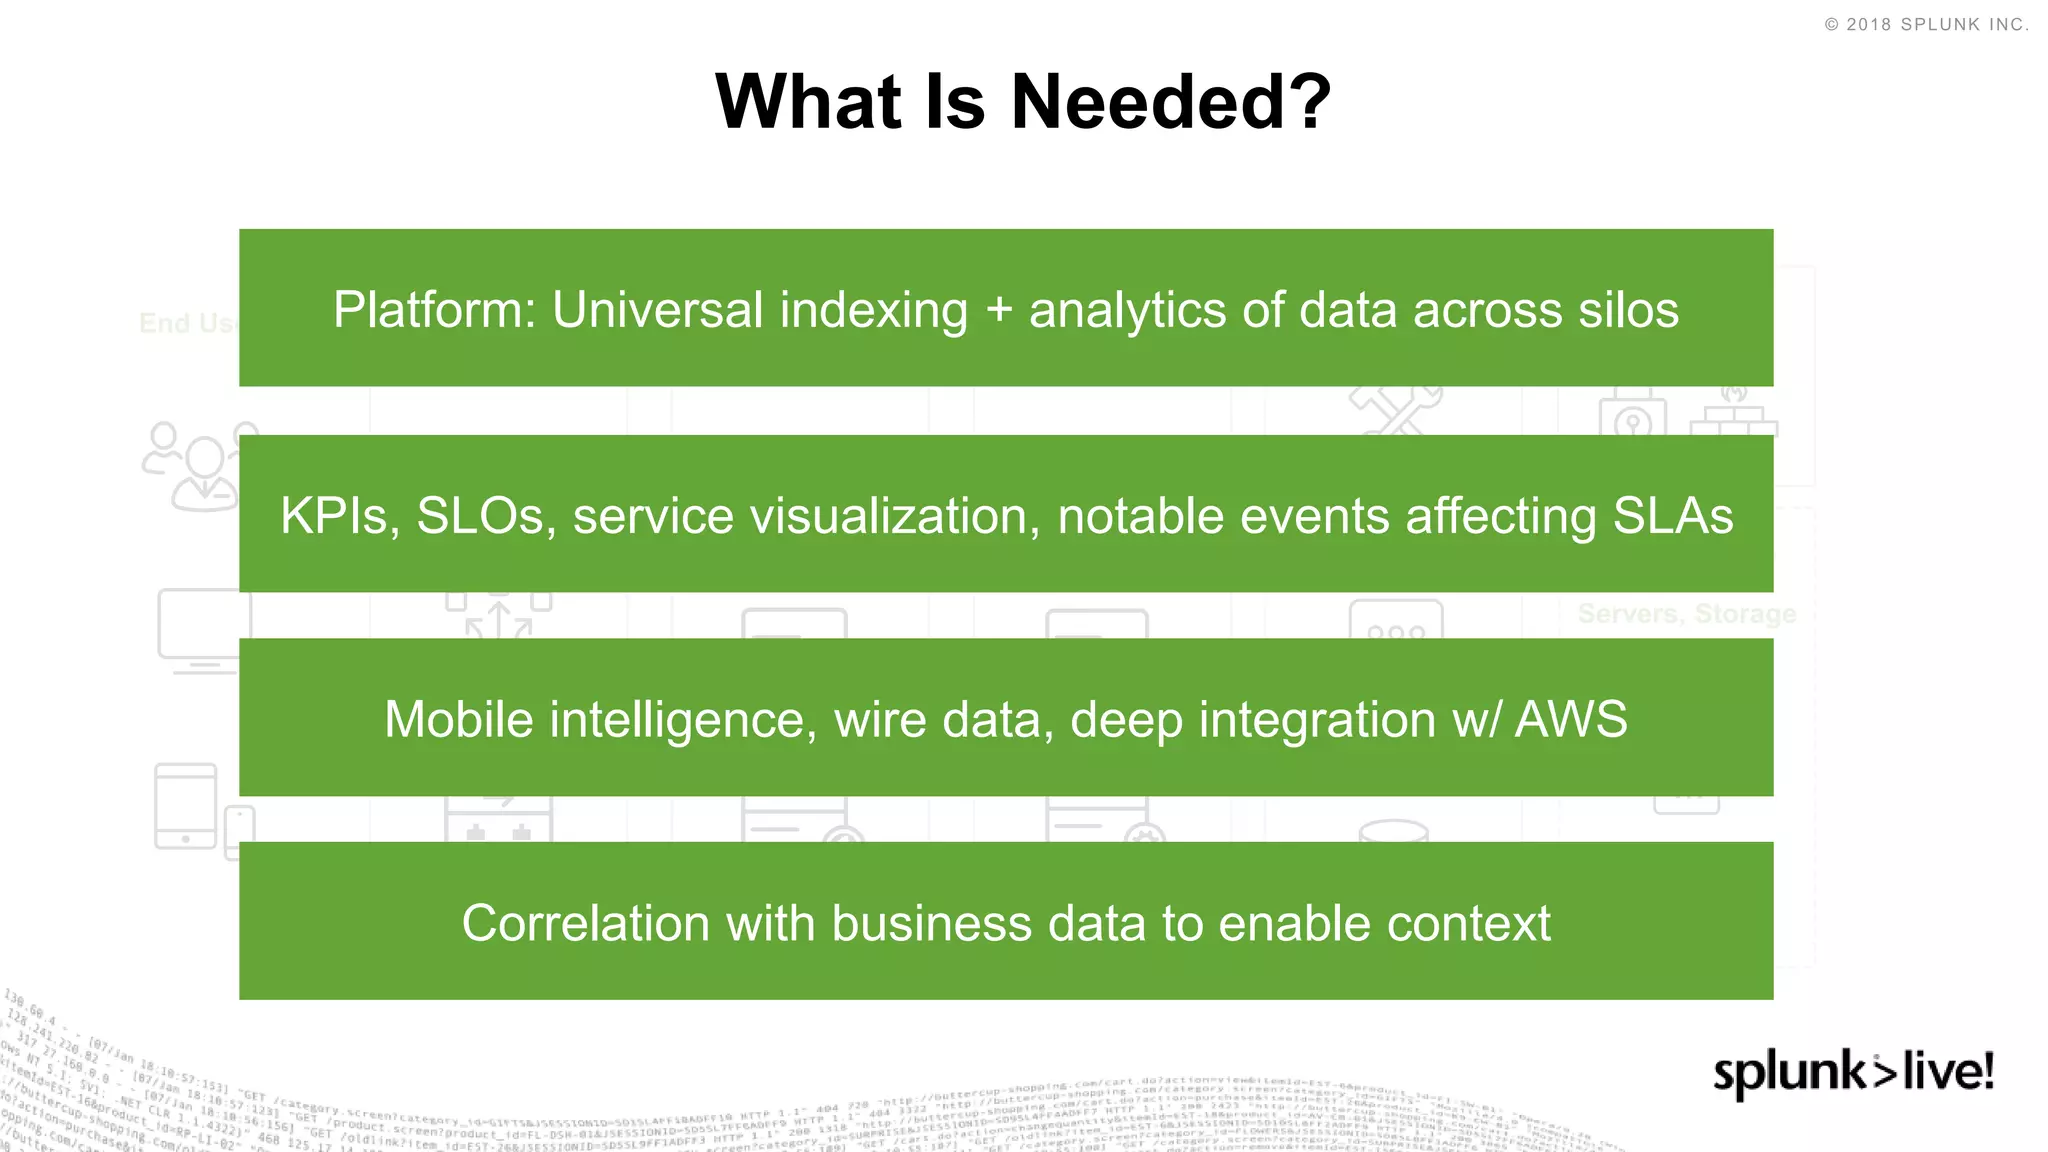
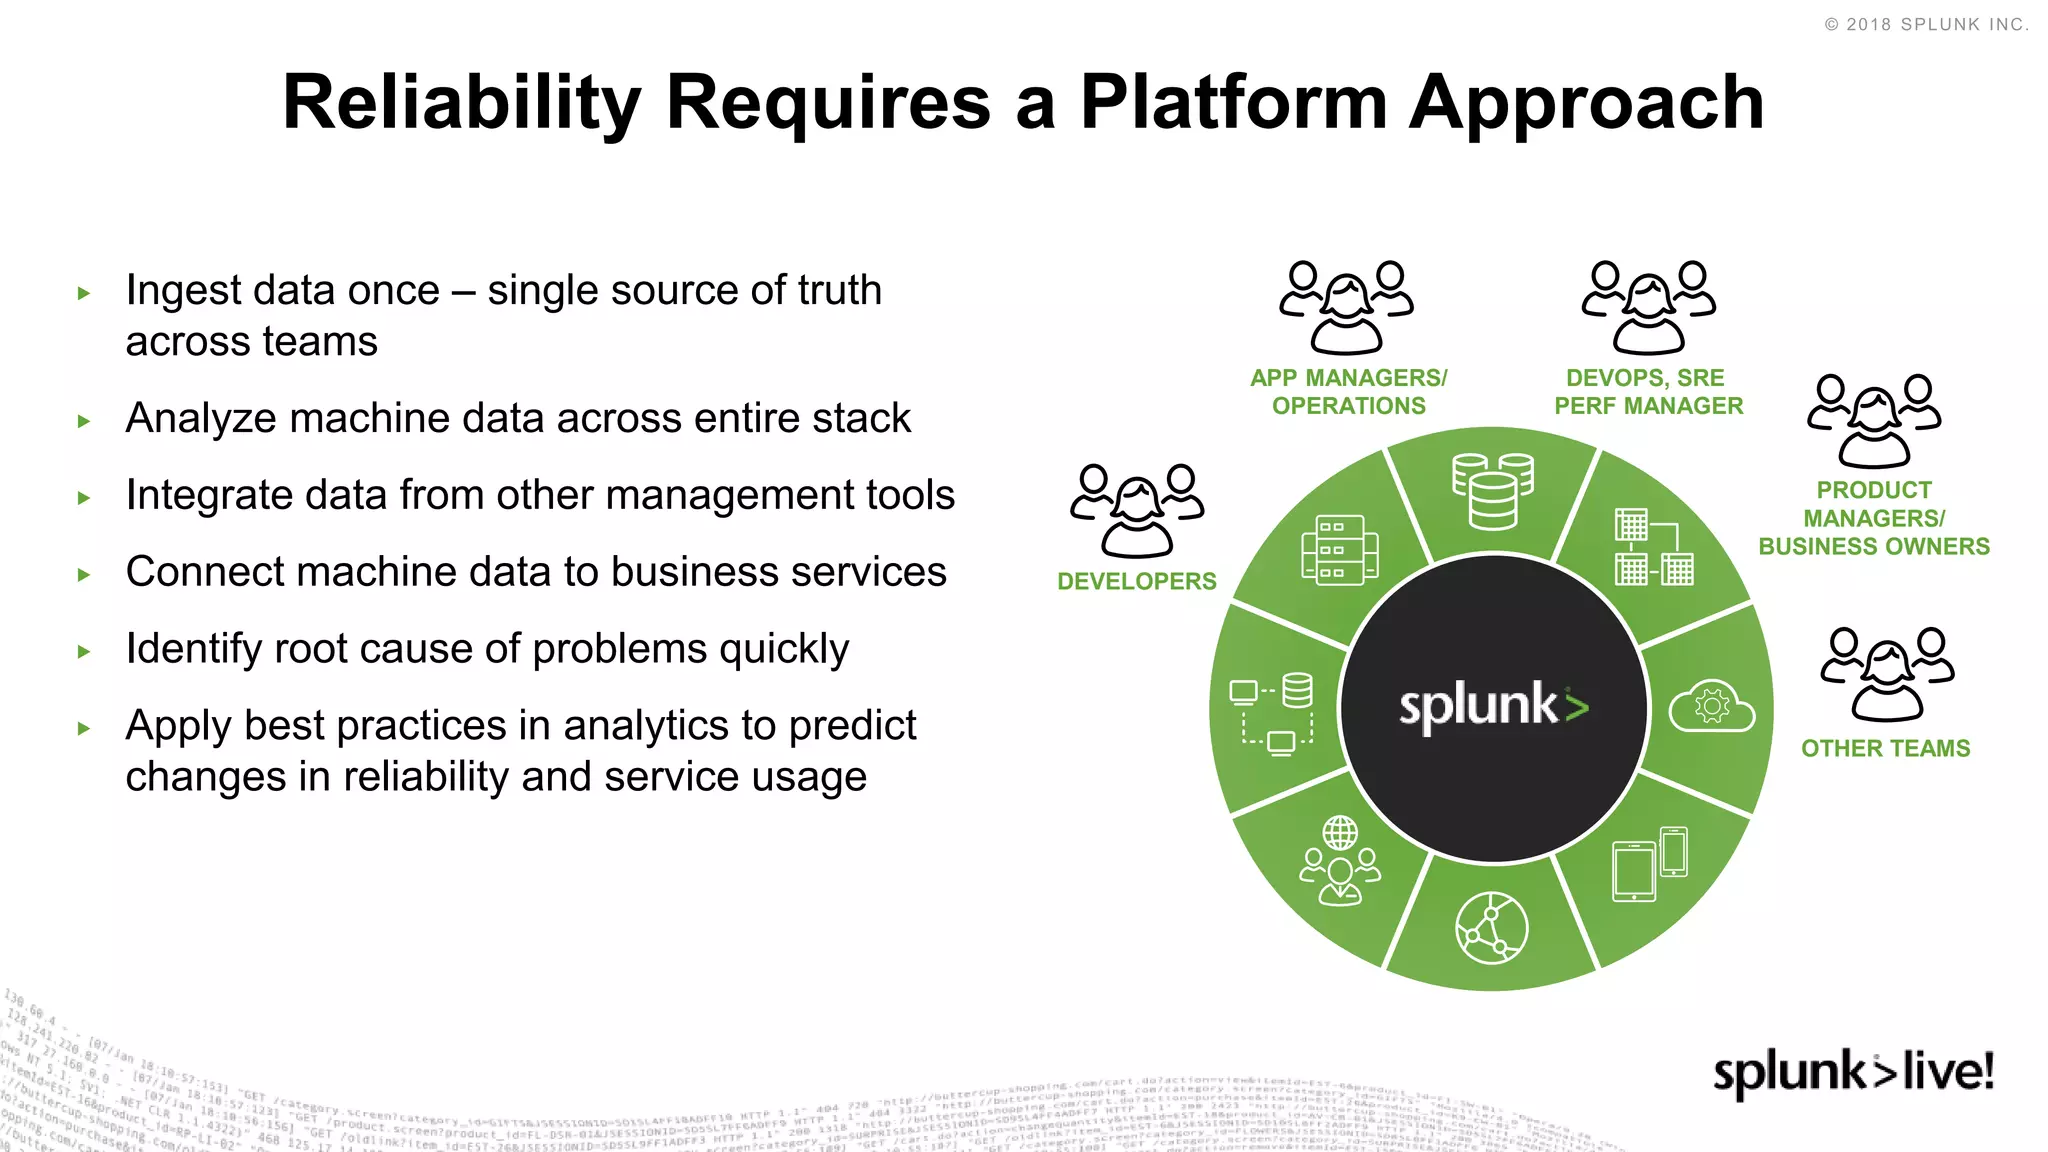
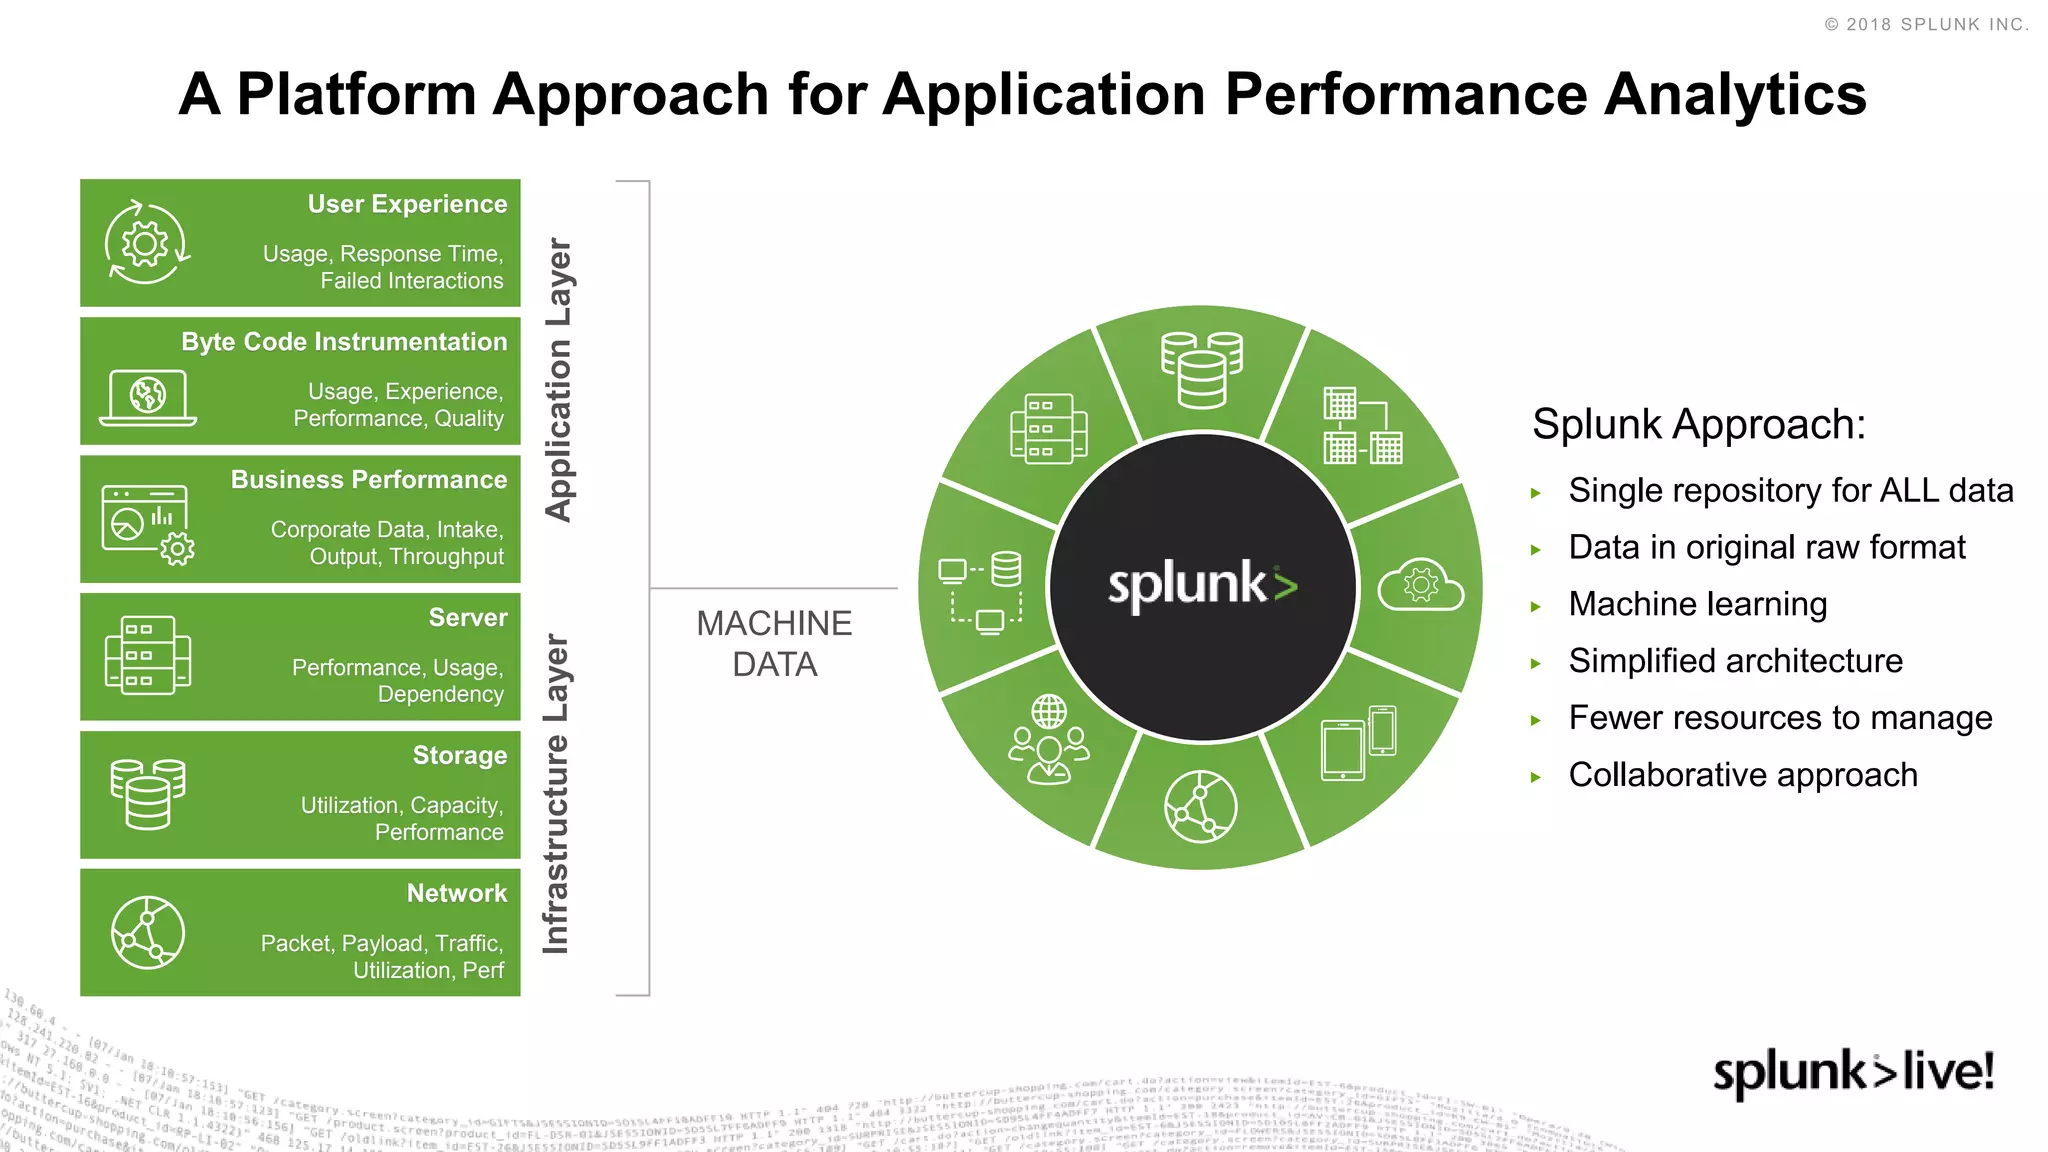
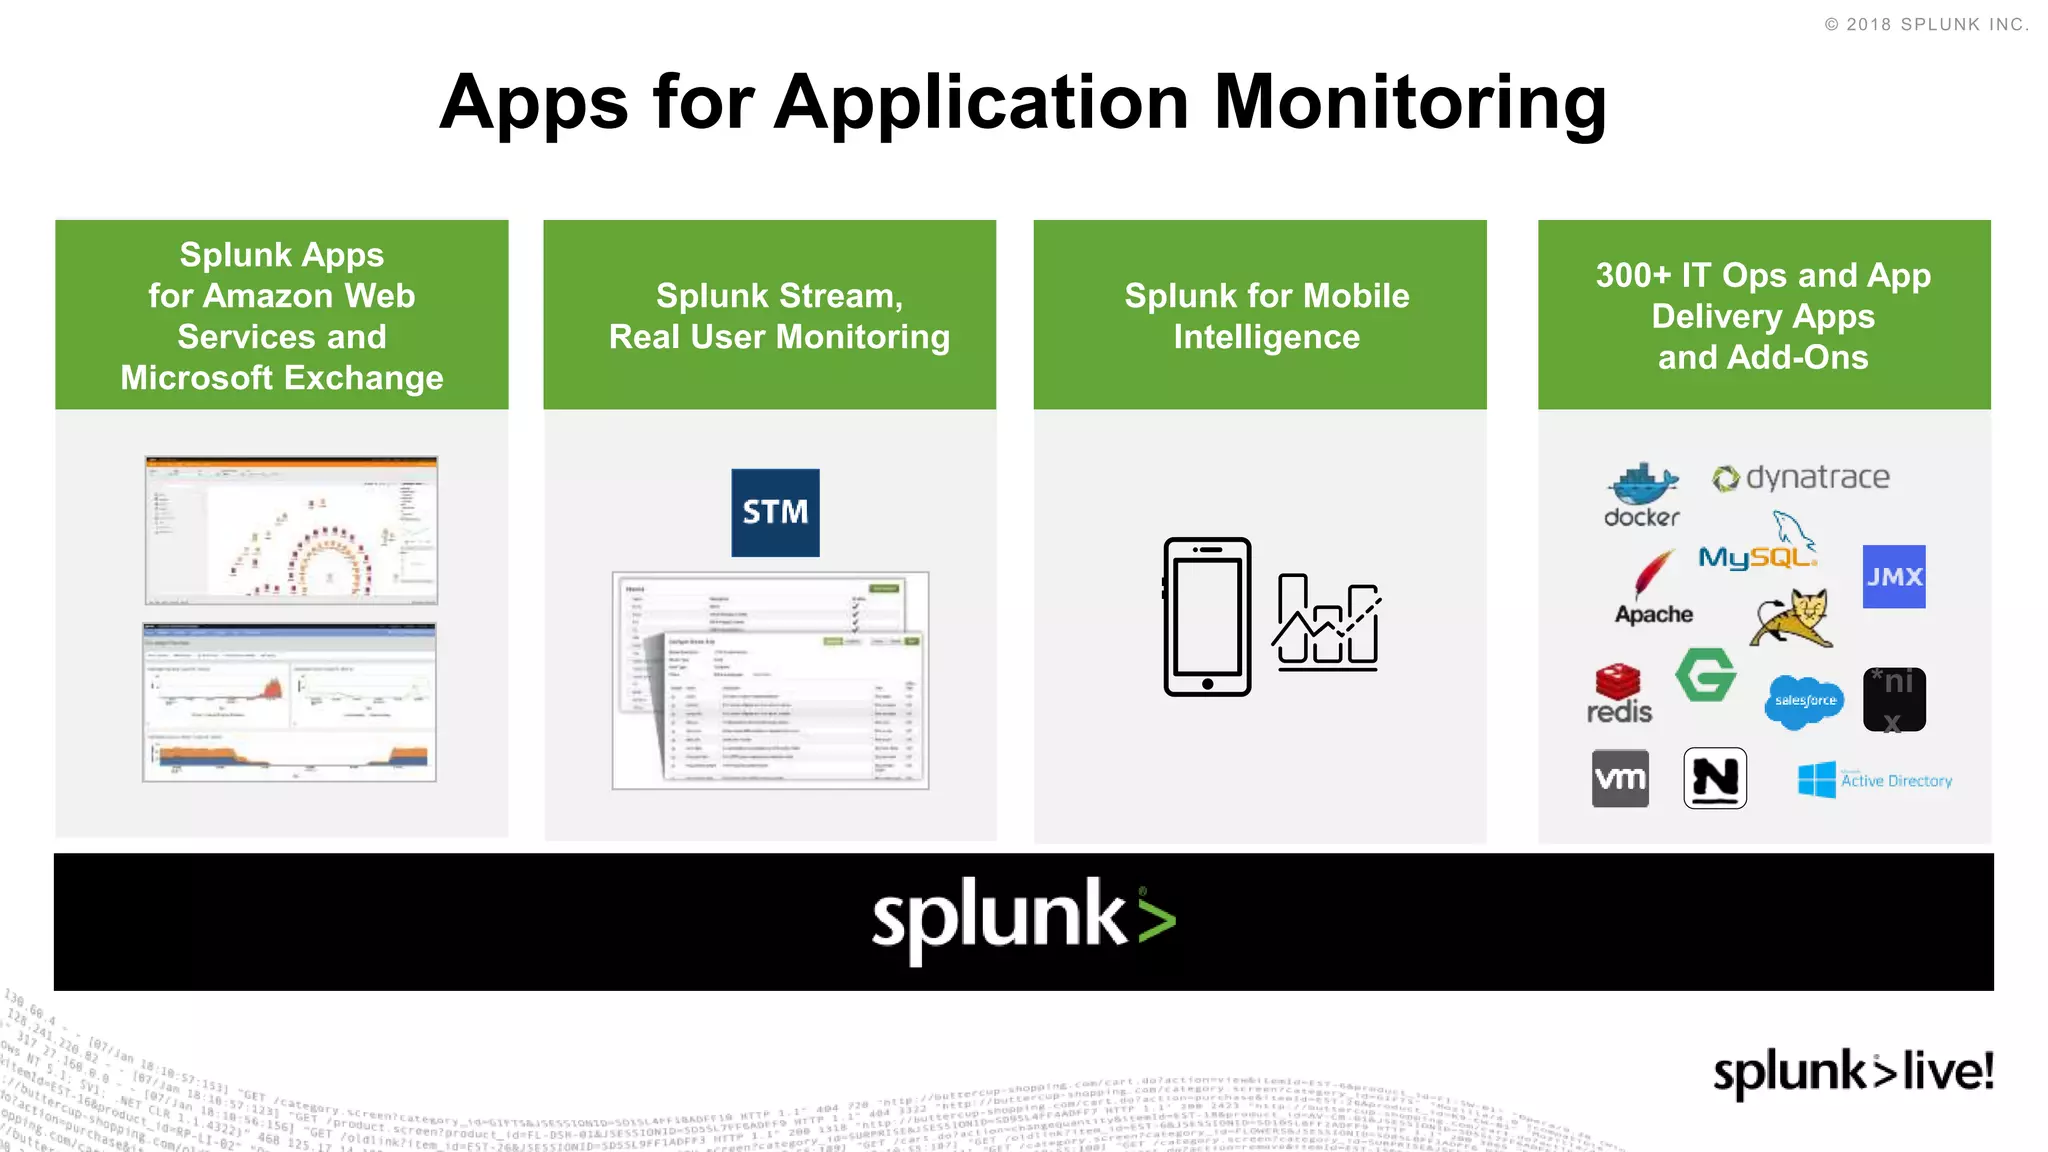
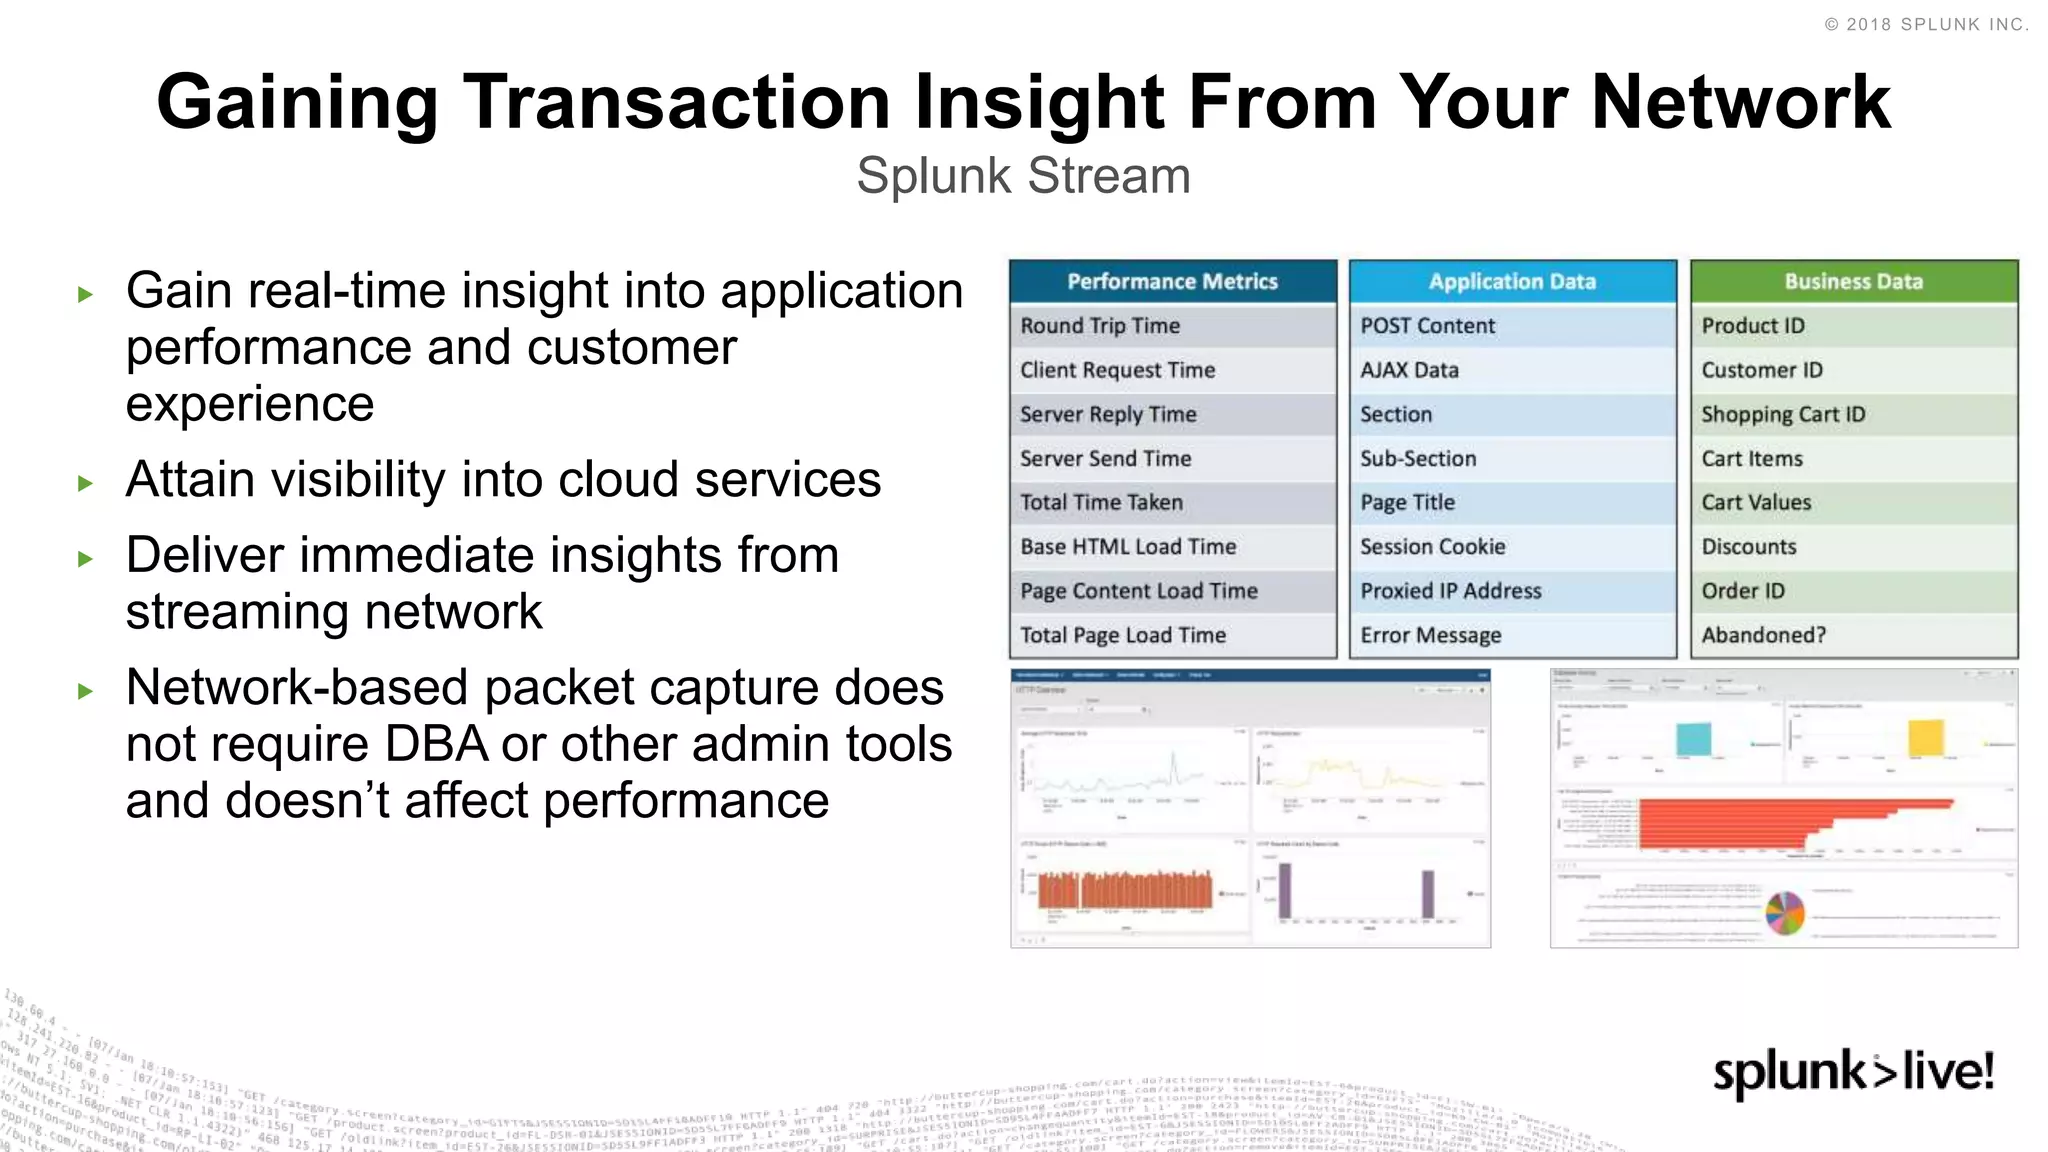
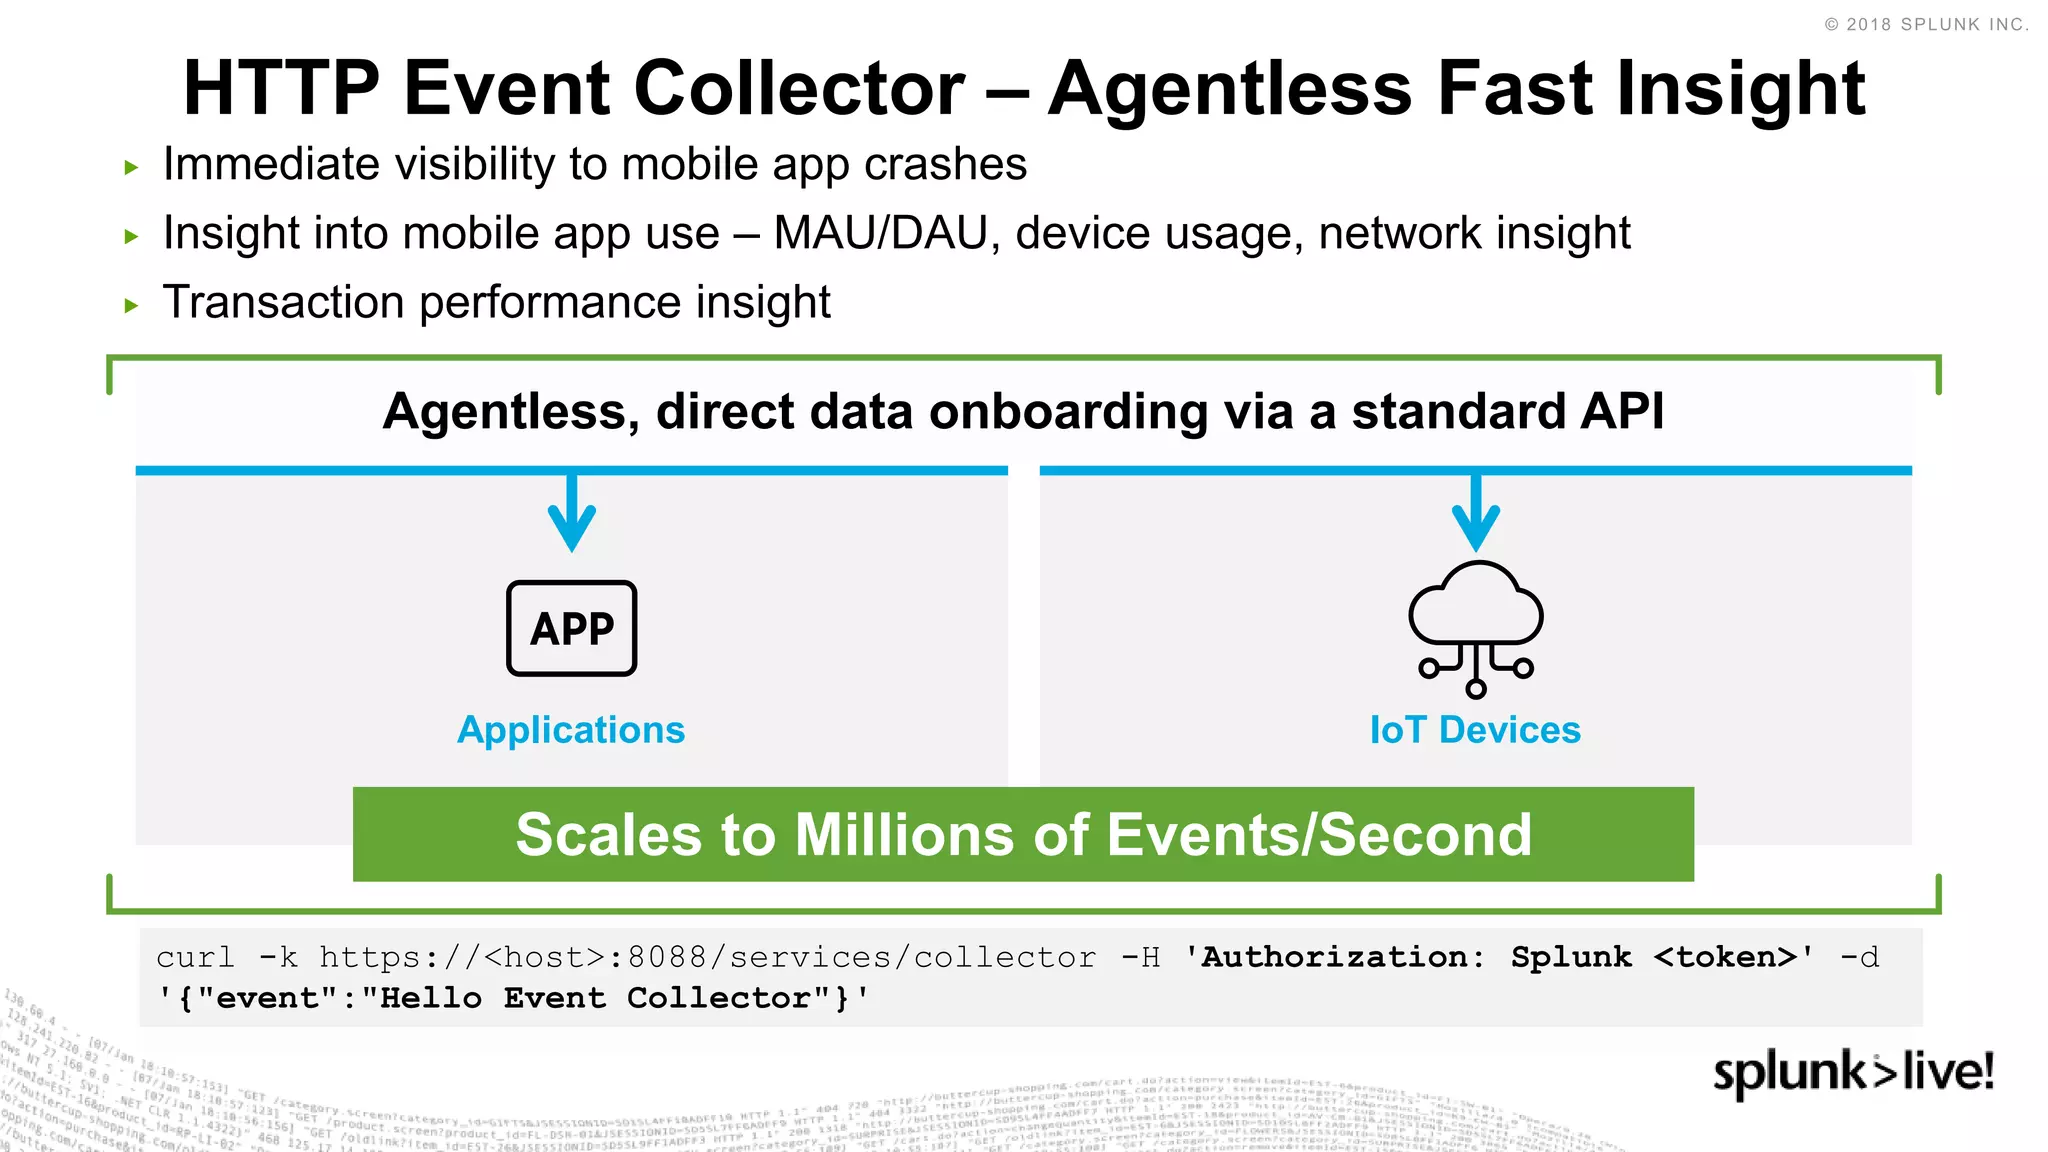
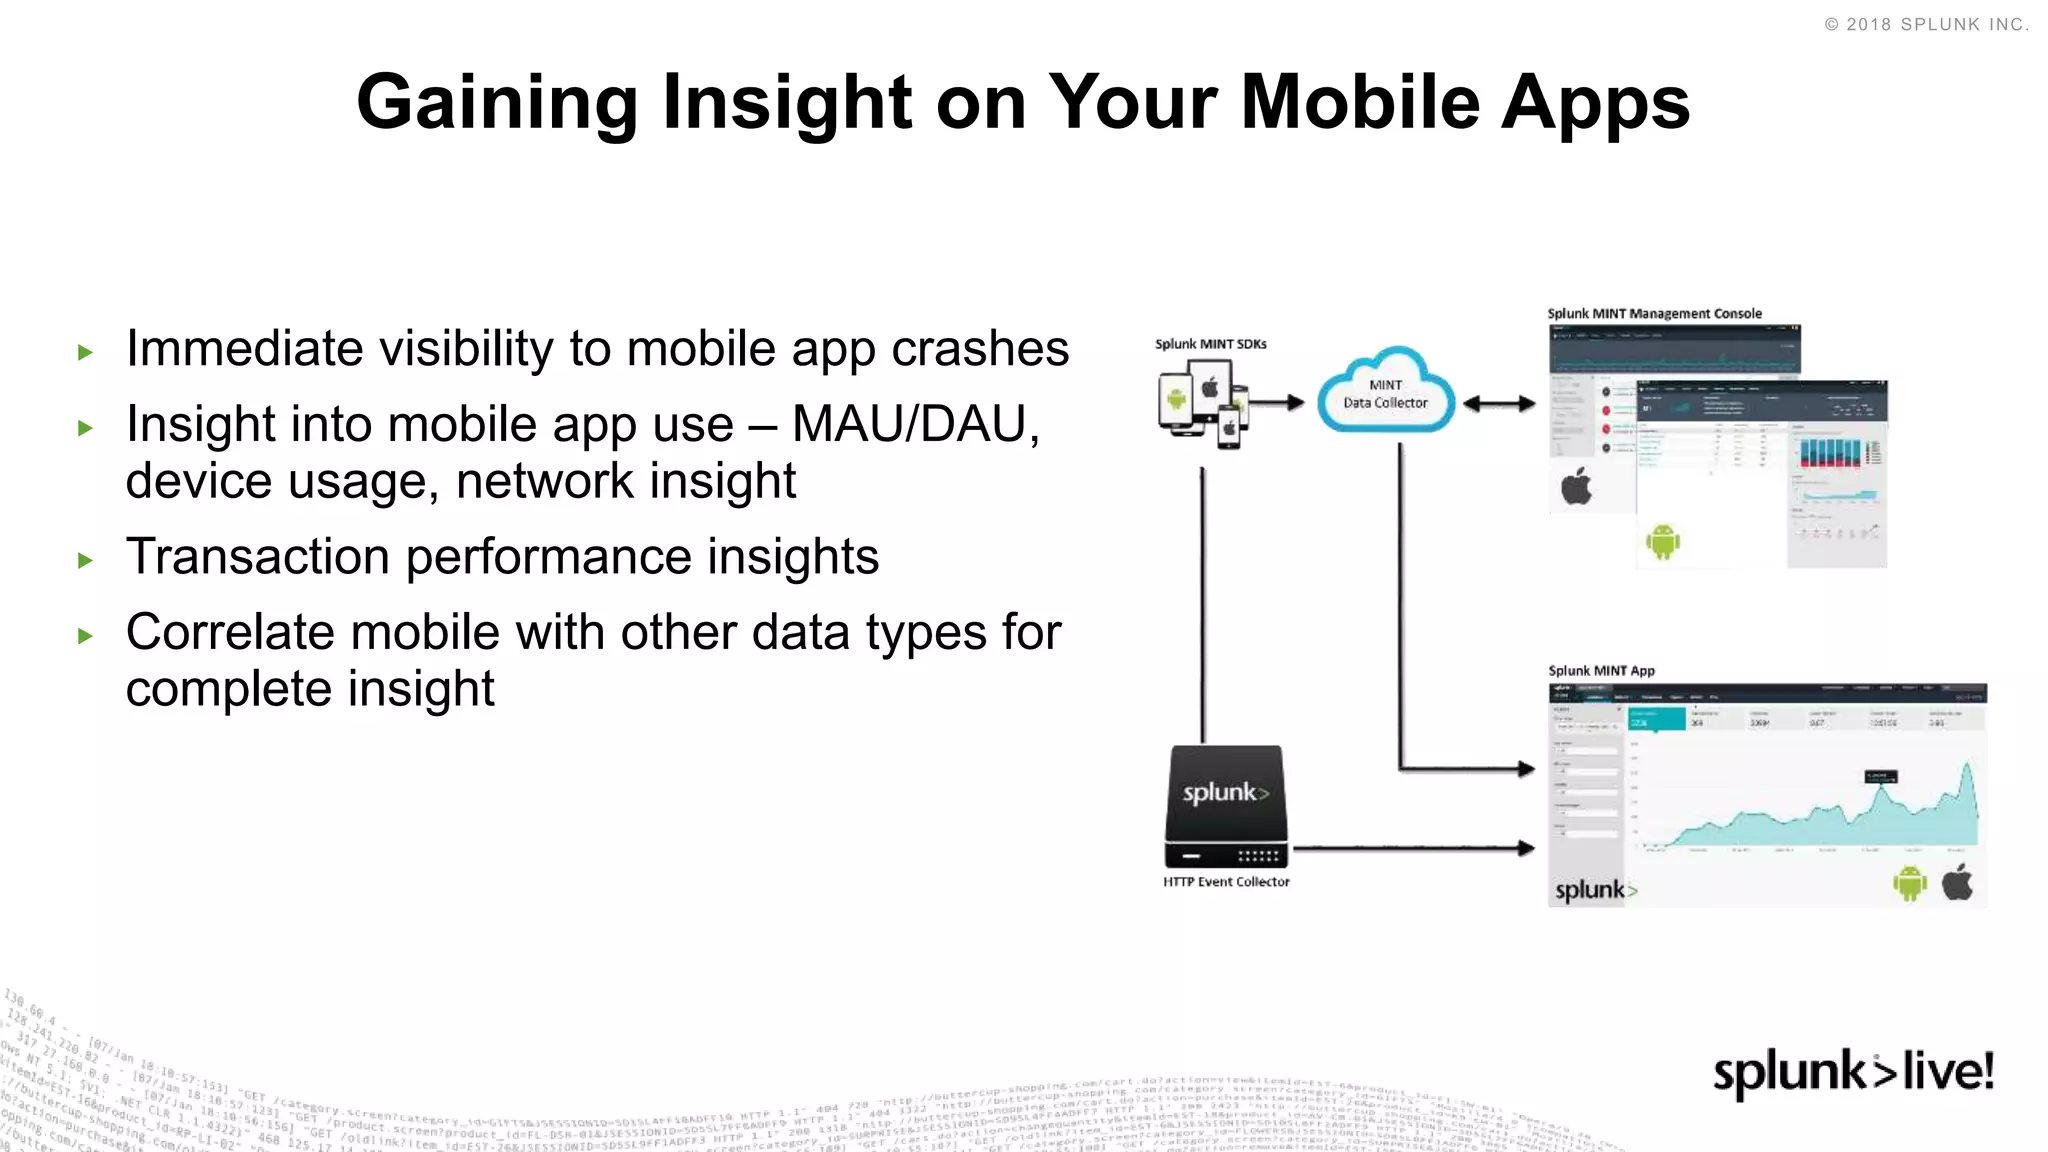
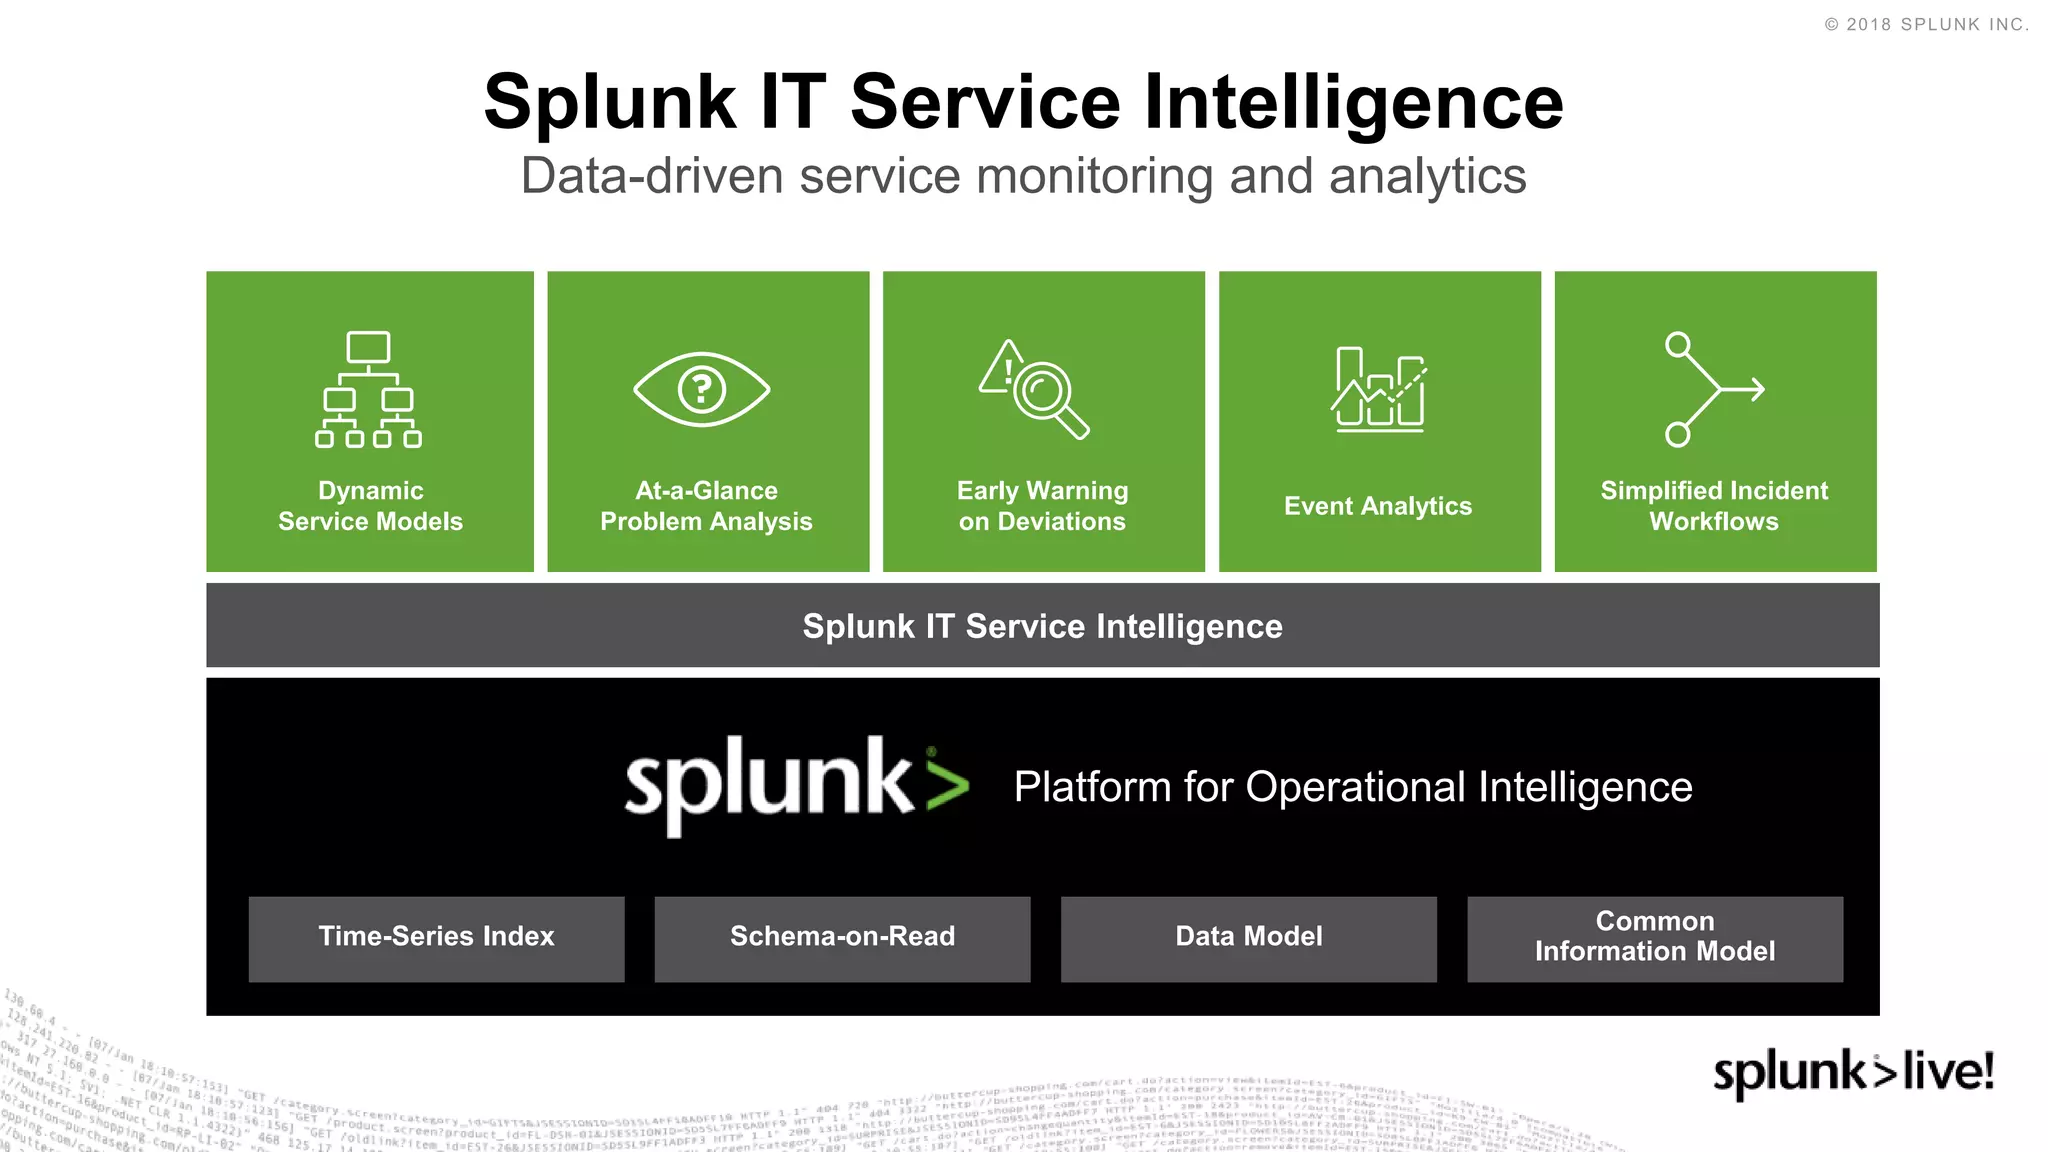
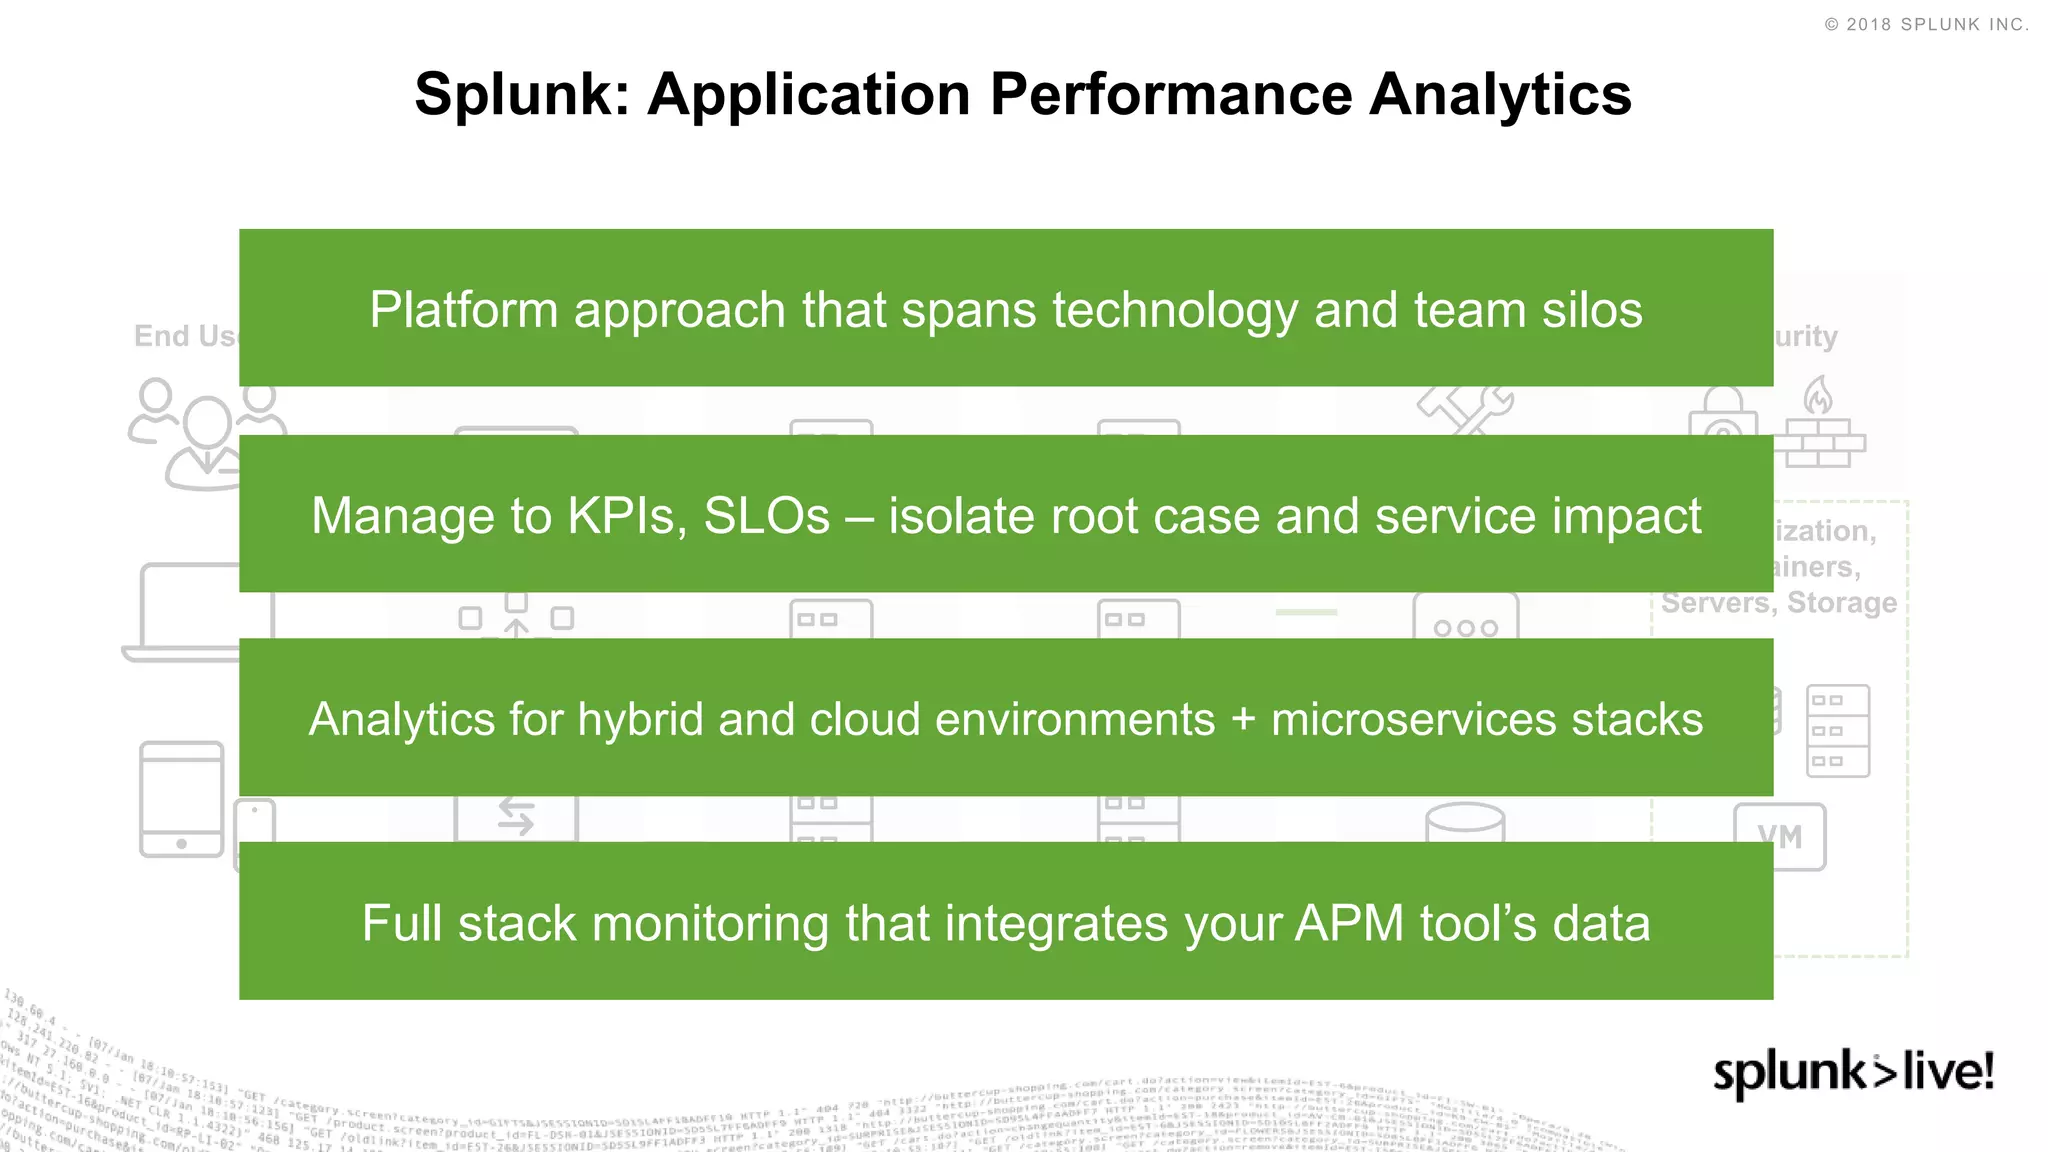
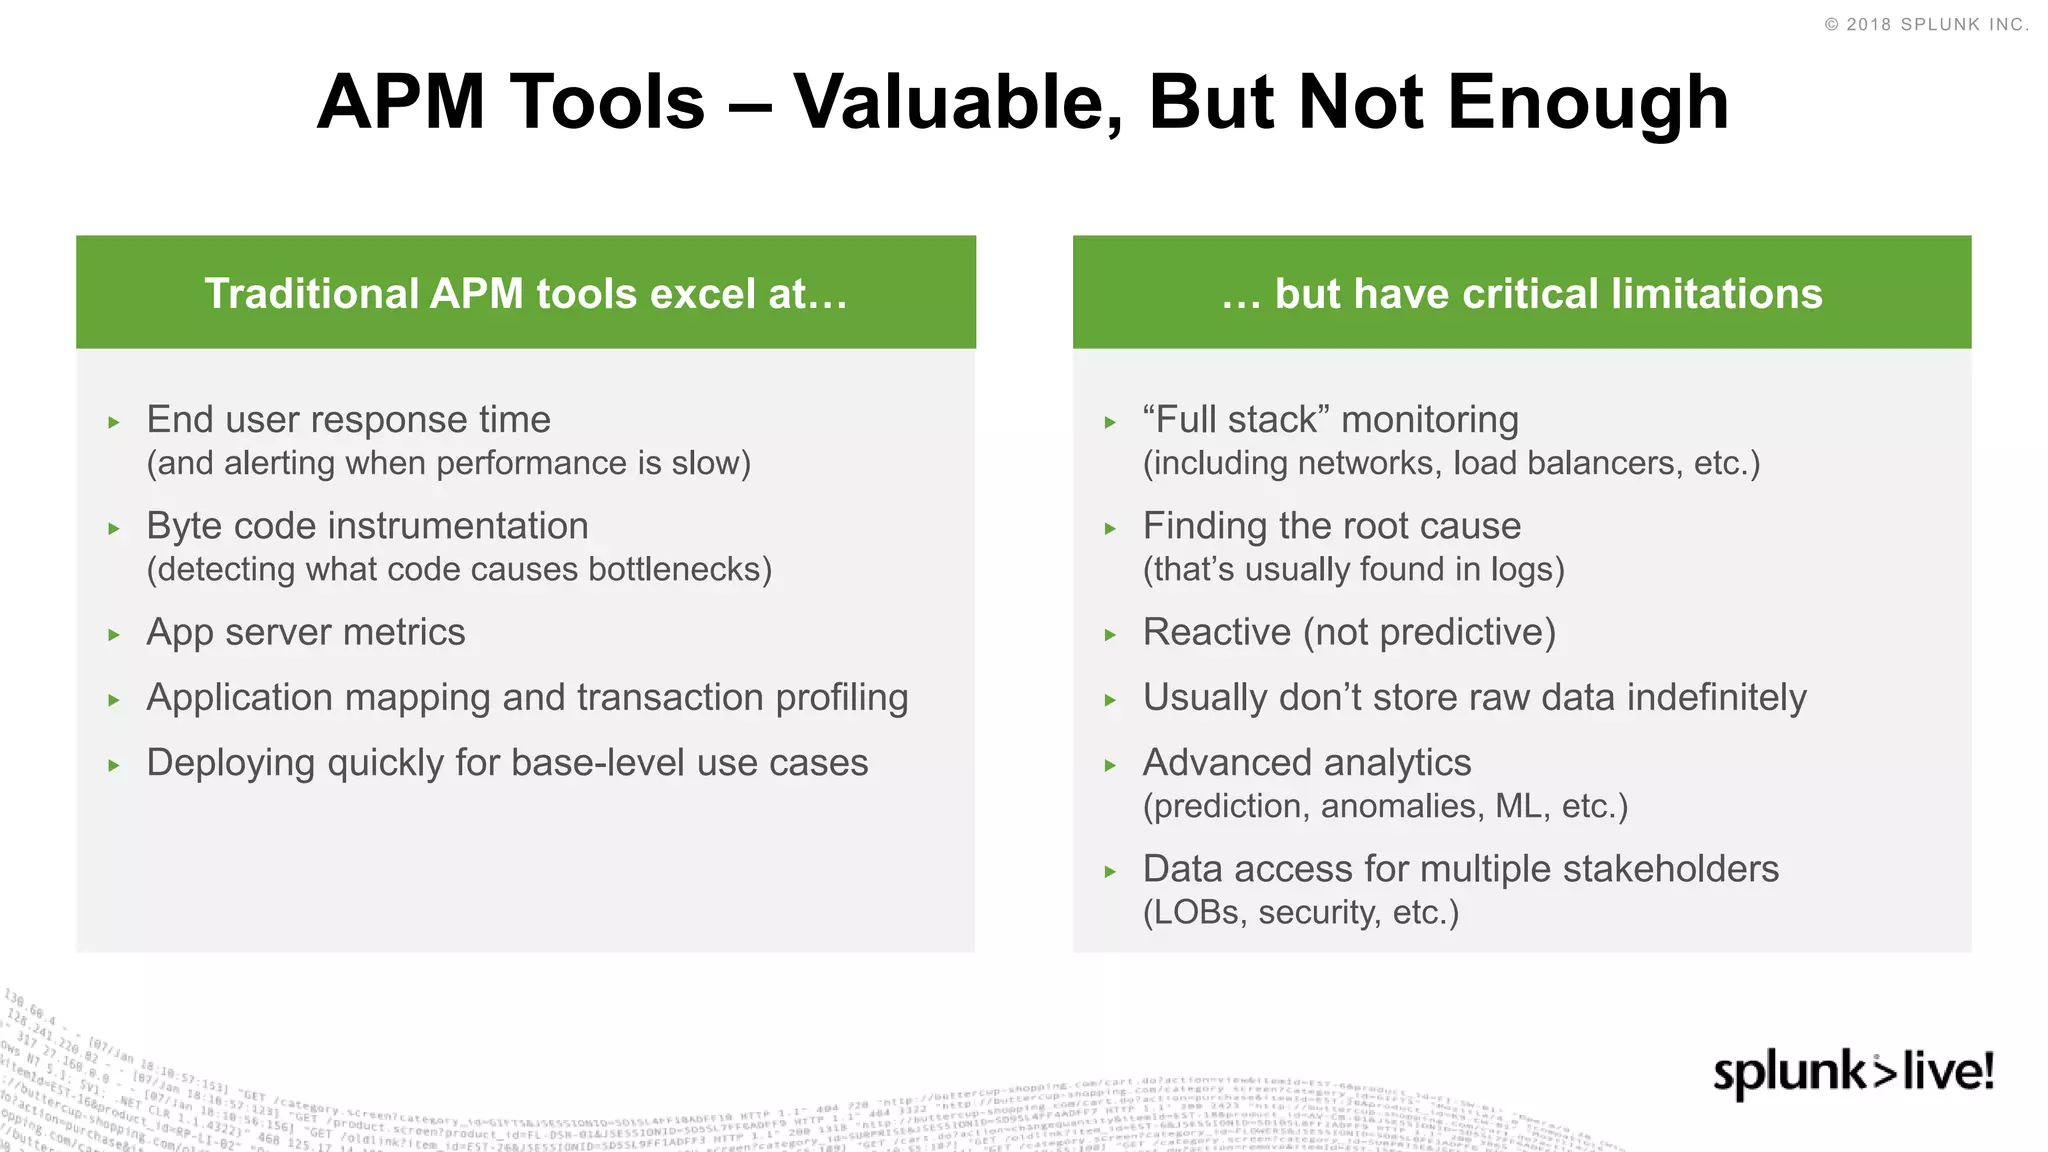
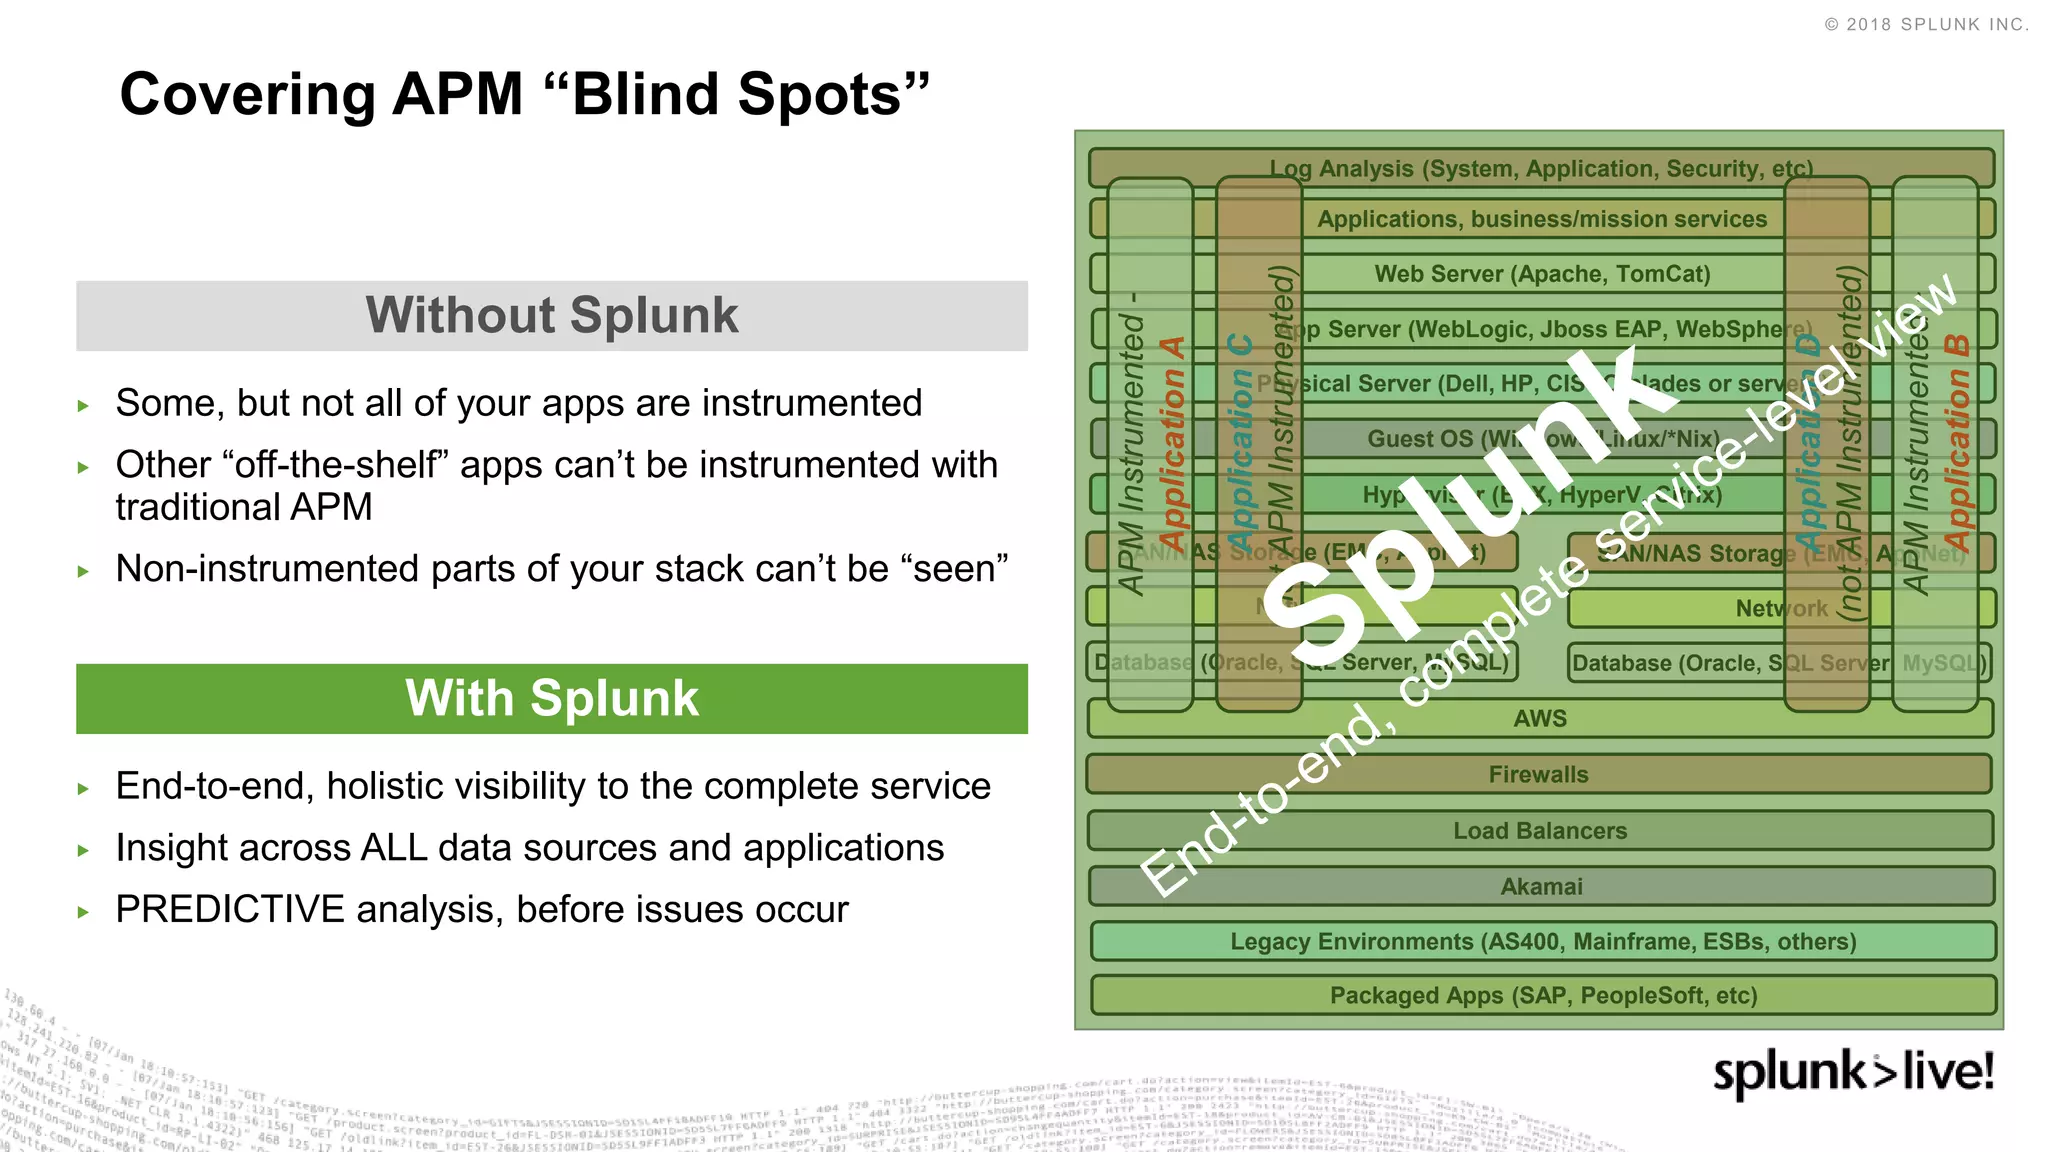
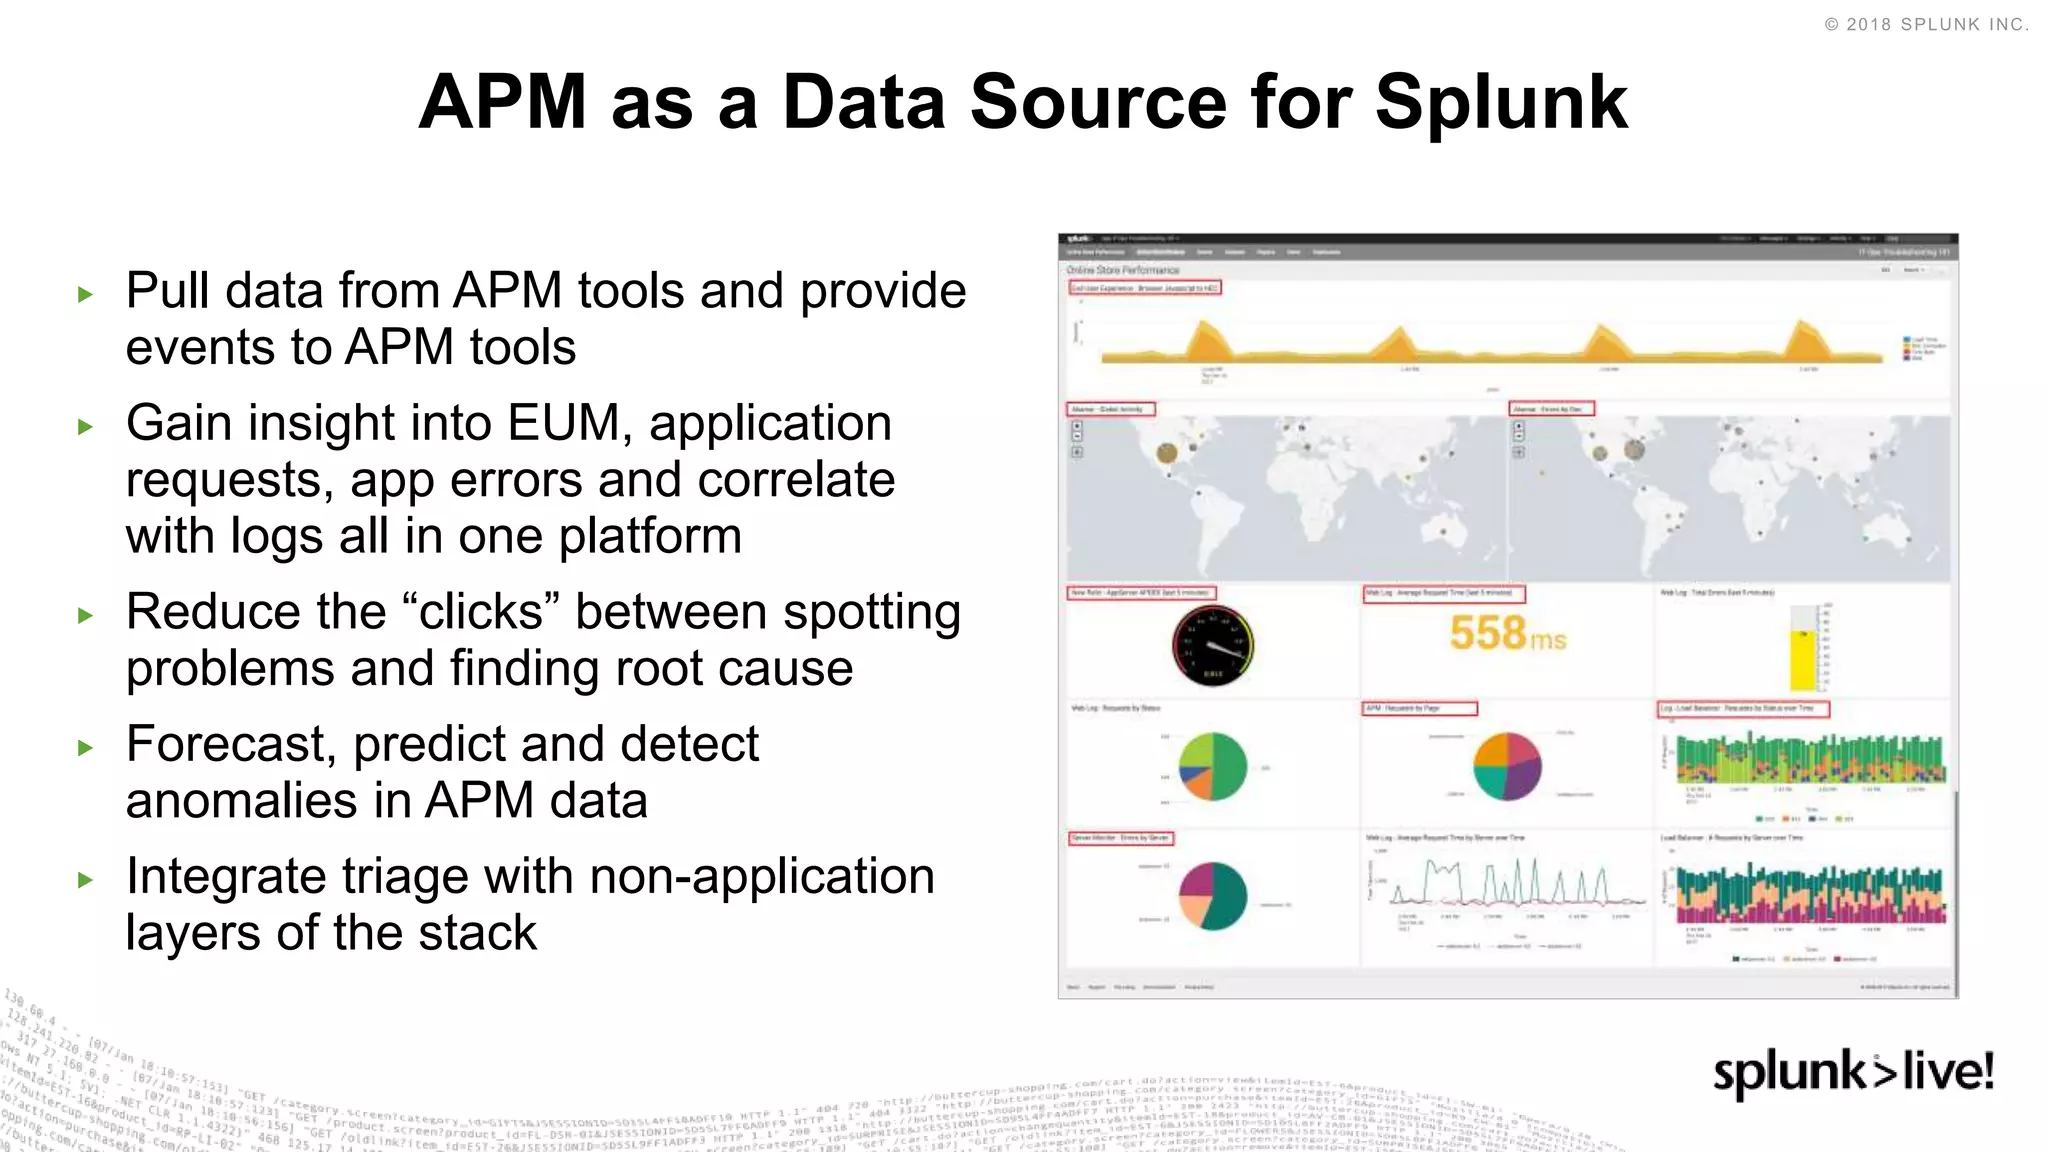
SlideShare a Scribd company logo
Monitoring the End User
Experience with Splunk
Gain insight on both the experience, and the
“why” behind the experience
Dirk Nitschke | Senior Sales Engineer
8th May 2018 | Zurich
During the course of this presentation, we may make forward-looking statements regarding future events or
the expected performance of the company. We caution you that such statements reflect our current
expectations and estimates based on factors currently known to us and that actual events or results could
differ materially. For important factors that may cause actual results to differ from those contained in our
forward-looking statements, please review our filings with the SEC.
The forward-looking statements made in this presentation are being made as of the time and date of its live
presentation. If reviewed after its live presentation, this presentation may not contain current or accurate
information. We do not assume any obligation to update any forward looking statements we may make. In
addition, any information about our roadmap outlines our general product direction and is subject to change
at any time without notice. It is for informational purposes only and shall not be incorporated into any contract
or other commitment. Splunk undertakes no obligation either to develop the features or functionality
described or to include any such feature or functionality in a future release.
Splunk, Splunk>, Listen to Your Data, The Engine for Machine Data, Splunk Cloud, Splunk Light and SPL are trademarks and registered trademarks of Splunk Inc. in
the United States and other countries. All other brand names, product names, or trademarks belong to their respective owners. ©2018 Splunk Inc. All rights reserved.
Forward-Looking Statements
Monitoring App
Experience…
And the App
Complexity – Difficult Issues for Everyone
▶ Is the problem with the app, the network or the backend system?
▶ Why are my specialists all saying “it works” but the application is down?
▶ How does performance compare mobile vs. web vs. desktop?APP MANAGERS/
OPERATIONS
▶ How can I deliver new releases faster?
▶ How can I see how my applications are working in production?
▶ How can other developer, test and monitoring tools improve my coding?DEVELOPERS
▶ How do I ensure new releases don’t break critical apps?
▶ How can I do “full stack” monitoring easily?
▶ What changes will optimize application and infrastructure performance?DEVOPS, SRE
PERF MANAGER
▶ How are customers using my app? How is it impacting my business?
▶ Which features should I prioritize for future versions?
▶ Are my customers impacted by outages and performance issues?LINE OF BUSINESS
Infrastructure and Application Silos
Web Servers
Legacy
Systems
End Users Network/
Load Balancing
Messaging
Databases
Java, .NET, PHG, etc.
App Servers
Security
Virtualization,
Containers,
Servers, Storage
What Is Needed?
Web Servers
Legacy
Systems
End Users Network/
Load Balancing
Messaging
Databases
Java,.NET, PHG, etc.
App Servers
Security
Virtualization,
Containers,
Servers, Storage
KPIs, SLOs, service visualization, notable events affecting SLAs
Mobile intelligence, wire data, deep integration w/ AWS
Correlation with business data to enable context
Platform: Universal indexing + analytics of data across silos
▶ Ingest data once – single source of truth
across teams
▶ Analyze machine data across entire stack
▶ Integrate data from other management tools
▶ Connect machine data to business services
▶ Identify root cause of problems quickly
▶ Apply best practices in analytics to predict
changes in reliability and service usage
Reliability Requires a Platform Approach
OTHER TEAMS
PRODUCT
MANAGERS/
BUSINESS OWNERS
DEVOPS, SRE
PERF MANAGER
APP MANAGERS/
OPERATIONS
DEVELOPERS
A Platform Approach for Application Performance Analytics
Network
InfrastructureLayer
Packet, Payload, Traffic,
Utilization, Perf
Storage
Utilization, Capacity,
Performance
Server
Performance, Usage,
Dependency
ApplicationLayer
User Experience
Usage, Response Time,
Failed Interactions
Byte Code Instrumentation
Usage, Experience,
Performance, Quality
Business Performance
Corporate Data, Intake,
Output, Throughput
Splunk Approach:
▶ Single repository for ALL data
▶ Data in original raw format
▶ Machine learning
▶ Simplified architecture
▶ Fewer resources to manage
▶ Collaborative approach
MACHINE
DATA
Apps for Application Monitoring
*ni
x
Splunk Stream,
Real User Monitoring
300+ IT Ops and App
Delivery Apps
and Add-Ons
Splunk for Mobile
Intelligence
Splunk Apps
for Amazon Web
Services and
Microsoft Exchange
▶ Gain real-time insight into application
performance and customer
experience
▶ Attain visibility into cloud services
▶ Deliver immediate insights from
streaming network
▶ Network-based packet capture does
not require DBA or other admin tools
and doesn’t affect performance
Gaining Transaction Insight From Your Network
Splunk Stream
HTTP Event Collector – Agentless Fast Insight
▶ Immediate visibility to mobile app crashes
▶ Insight into mobile app use – MAU/DAU, device usage, network insight
▶ Transaction performance insight
curl -k https://<host>:8088/services/collector -H 'Authorization: Splunk <token>' -d
'{"event":"Hello Event Collector"}'
Applications IoT Devices
Agentless, direct data onboarding via a standard API
Scales to Millions of Events/Second
▶ Immediate visibility to mobile app crashes
▶ Insight into mobile app use – MAU/DAU,
device usage, network insight
▶ Transaction performance insights
▶ Correlate mobile with other data types for
complete insight
Gaining Insight on Your Mobile Apps
Splunk IT Service Intelligence
Data-driven service monitoring and analytics
Splunk IT Service Intelligence
Time-Series Index
Platform for Operational Intelligence
Dynamic
Service Models
Schema-on-Read Data Model
Common
Information Model
At-a-Glance
Problem Analysis
Early Warning
on Deviations
Event Analytics
Simplified Incident
Workflows
Splunk: Application Performance Analytics
End Users
Networking/
Load-balancing Web Servers App Servers
Legacy
Systems
Messaging
Databases
Security
Virtualization,
Containers,
Servers, Storage
Java, .NET, PHP, etc.
Manage to KPIs, SLOs – isolate root case and service impact
Analytics for hybrid and cloud environments + microservices stacks
Full stack monitoring that integrates your APM tool’s data
Platform approach that spans technology and team silos
Splunk and APM
Section subtitle goes here
Traditional APM tools excel at… … but have critical limitations
▶ End user response time
(and alerting when performance is slow)
▶ Byte code instrumentation
(detecting what code causes bottlenecks)
▶ App server metrics
▶ Application mapping and transaction profiling
▶ Deploying quickly for base-level use cases
▶ “Full stack” monitoring
(including networks, load balancers, etc.)
▶ Finding the root cause
(that’s usually found in logs)
▶ Reactive (not predictive)
▶ Usually don’t store raw data indefinitely
▶ Advanced analytics
(prediction, anomalies, ML, etc.)
▶ Data access for multiple stakeholders
(LOBs, security, etc.)
APM Tools – Valuable, But Not Enough
▶ Some, but not all of your apps are instrumented
▶ Other “off-the-shelf” apps can’t be instrumented with
traditional APM
▶ Non-instrumented parts of your stack can’t be “seen”
Covering APM “Blind Spots”
Without Splunk
Physical Server (Dell, HP, CISCO blades or servers)
Guest OS (Windows/Linux/*Nix)
Database (Oracle, SQL Server, MySQL)
Hypervisor (ESX, HyperV, Citrix)
Applications, business/mission services
App Server (WebLogic, Jboss EAP, WebSphere)
Web Server (Apache, TomCat)
SAN/NAS Storage (EMC, AppNet)
Network
AWS
Firewalls
Database (Oracle, SQL Server, MySQL)
SAN/NAS Storage (EMC, AppNet)
Network
Load Balancers
Legacy Environments (AS400, Mainframe, ESBs, others)
Akamai
Packaged Apps (SAP, PeopleSoft, etc)
Log Analysis (System, Application, Security, etc)
APMInstrumented-
ApplicationA
APMInstrumented-
ApplicationB
ApplicationD
(notAPMInstrumented)
ApplicationC
(notAPMInstrumented)
▶ End-to-end, holistic visibility to the complete service
▶ Insight across ALL data sources and applications
▶ PREDICTIVE analysis, before issues occur
With Splunk
▶ Pull data from APM tools and provide
events to APM tools
▶ Gain insight into EUM, application
requests, app errors and correlate
with logs all in one platform
▶ Reduce the “clicks” between spotting
problems and finding root cause
▶ Forecast, predict and detect
anomalies in APM data
▶ Integrate triage with non-application
layers of the stack
APM as a Data Source for Splunk
APM Tools
▶ Splunk Add-on and App for New Relic
▶ Splunk Add-on and App for AppDynamics
▶ Dynatrace App (provided by Dynatrace)
Other Notable APM Apps
▶ Web Performance (based on boomerang.js)
▶ Splunk Mobile Intelligence (Splunk MINT)
▶ Splunk Stream
splunkbase.splunk.com
Splunk Apps for APM
Splunk Demo
Presented by Buttercup Splunker
© 2018 SPLUNK INC.
▶ Ensures continuous uptime thanks to real-time operational
insights into service and quality metrics
▶ Gains digital intelligence by comparing customer
engagement across Zillow sites
▶ Improves DevOps collaboration for faster release cycles
Gaining Real-Time Visibility
Into Site Operations
“Being part of the larger Splunk ecosystem is extremely valuable
to us. We couldn't replicate that if we tried to build something on
our own… We have given teams enough autonomy to create
their own solutions on top of the Splunk platform. It's all
predicated on the fact that Splunk is an enterprise-wide self-
service utility now within Zillow.”
– Director of Site Operations, Zillow
ONLINE SERVICES – IT OPERATIONS, APPLICATION DELIVERY
© 2018 SPLUNK INC.
▶ Improving website uptime with real-time notifications
▶ Quickly and reliably delivering application features
to users
▶ Uncovering business insights and improving the
customer experience
Democratizing Data to Ensure
Great Customer Experience
“I don’t believe there is any other product on the market
that is able to quickly bring together diverse data sets,
offer a powerful language to engineers for data analysis
and then ultimately deliver beautiful, visual, actionable
reports to the business users.”
– Vice President of Engineering, Yelp Reservations
TECHNOLOGY – IT OPERATIONS, BUSINESS ANALYTICS
© 2018 SPLUNK INC.
1. Transcend the silos
2. Ask any question of your data
3. Liberate your APM data
Key
Takeaways
Thank You!
Don't forget to rate this session on Pony Poll
https://ponypoll.com/Zurich2018
▶ Splunk Usergroup Zürich
▶ Regular Splunk User get-togethers
▶ Frequent Splunk Ninja Presentations (D/E)
▶ Meetings throughout all major german
speaking cities (not only Zurich)
▶ Amtssprache deutsch
▶ Not a sales thing
▶ Kick-off soon
▶ Join now:
▶ https://usergroups.splunk.com/group/splunk-
user-group-zurich.html
Splunk Usergroup Zurich
http://bit.do/SPLUGZ

More Related Content

What's hot

SplunkLive! Munich 2018: Intro to Security Analytics Methods
SplunkLive! Munich 2018: Intro to Security Analytics MethodsSplunkLive! Munich 2018: Intro to Security Analytics Methods
SplunkLive! Munich 2018: Intro to Security Analytics Methods
Splunk
 
SplunkLive! Frankfurt 2018 - Use Splunk for Incident Response, Orchestration ...
SplunkLive! Frankfurt 2018 - Use Splunk for Incident Response, Orchestration ...SplunkLive! Frankfurt 2018 - Use Splunk for Incident Response, Orchestration ...
SplunkLive! Frankfurt 2018 - Use Splunk for Incident Response, Orchestration ...
Splunk
 
SplunkLive! Frankfurt 2018 - Get More From Your Machine Data with Splunk AI
SplunkLive! Frankfurt 2018 - Get More From Your Machine Data with Splunk AISplunkLive! Frankfurt 2018 - Get More From Your Machine Data with Splunk AI
SplunkLive! Frankfurt 2018 - Get More From Your Machine Data with Splunk AI
Splunk
 
SplunkLive! Munich 2018: Get More From Your Machine Data Splunk & AI
SplunkLive! Munich 2018: Get More From Your Machine Data Splunk & AISplunkLive! Munich 2018: Get More From Your Machine Data Splunk & AI
SplunkLive! Munich 2018: Get More From Your Machine Data Splunk & AI
Splunk
 
SplunkLive! Frankfurt 2018 - Intro to Security Analytics Methods
SplunkLive! Frankfurt 2018 - Intro to Security Analytics MethodsSplunkLive! Frankfurt 2018 - Intro to Security Analytics Methods
SplunkLive! Frankfurt 2018 - Intro to Security Analytics Methods
Splunk
 
SplunkLive! Munich 2018: Use Splunk for incident Response, Orchestration and ...
SplunkLive! Munich 2018: Use Splunk for incident Response, Orchestration and ...SplunkLive! Munich 2018: Use Splunk for incident Response, Orchestration and ...
SplunkLive! Munich 2018: Use Splunk for incident Response, Orchestration and ...
Splunk
 
SplunkLive! Frankfurt 2018 - Predictive, Proactive, and Collaborative ML with...
SplunkLive! Frankfurt 2018 - Predictive, Proactive, and Collaborative ML with...SplunkLive! Frankfurt 2018 - Predictive, Proactive, and Collaborative ML with...
SplunkLive! Frankfurt 2018 - Predictive, Proactive, and Collaborative ML with...
Splunk
 
SplunkLive! Munich 2018: Getting Started with Splunk Enterprise
SplunkLive! Munich 2018: Getting Started with Splunk EnterpriseSplunkLive! Munich 2018: Getting Started with Splunk Enterprise
SplunkLive! Munich 2018: Getting Started with Splunk Enterprise
Splunk
 
SplunkLive! Munich 2018: Data Onboarding Overview
SplunkLive! Munich 2018: Data Onboarding OverviewSplunkLive! Munich 2018: Data Onboarding Overview
SplunkLive! Munich 2018: Data Onboarding Overview
Splunk
 
SplunkLive! Paris 2018: Event Management Is Dead
SplunkLive! Paris 2018: Event Management Is DeadSplunkLive! Paris 2018: Event Management Is Dead
SplunkLive! Paris 2018: Event Management Is Dead
Splunk
 
SplunkLive! Zurich 2018: Use Splunk for Incident Response, Orchestration and ...
SplunkLive! Zurich 2018: Use Splunk for Incident Response, Orchestration and ...SplunkLive! Zurich 2018: Use Splunk for Incident Response, Orchestration and ...
SplunkLive! Zurich 2018: Use Splunk for Incident Response, Orchestration and ...
Splunk
 
SplunkLive! Frankfurt 2018 - Legacy SIEM to Splunk, How to Conquer Migration ...
SplunkLive! Frankfurt 2018 - Legacy SIEM to Splunk, How to Conquer Migration ...SplunkLive! Frankfurt 2018 - Legacy SIEM to Splunk, How to Conquer Migration ...
SplunkLive! Frankfurt 2018 - Legacy SIEM to Splunk, How to Conquer Migration ...
Splunk
 
SplunkLive! Munich 2018: Integrating Metrics and Logs
SplunkLive! Munich 2018: Integrating Metrics and LogsSplunkLive! Munich 2018: Integrating Metrics and Logs
SplunkLive! Munich 2018: Integrating Metrics and Logs
Splunk
 
SplunkLive! Frankfurt 2018 - Monitoring the End User Experience with Splunk
SplunkLive! Frankfurt 2018 - Monitoring the End User Experience with SplunkSplunkLive! Frankfurt 2018 - Monitoring the End User Experience with Splunk
SplunkLive! Frankfurt 2018 - Monitoring the End User Experience with Splunk
Splunk
 
SplunkLive! Paris 2018: Plenary Session
SplunkLive! Paris 2018: Plenary SessionSplunkLive! Paris 2018: Plenary Session
SplunkLive! Paris 2018: Plenary Session
Splunk
 
SplunkLive! Zurich 2018: Event Analytics
SplunkLive! Zurich 2018: Event AnalyticsSplunkLive! Zurich 2018: Event Analytics
SplunkLive! Zurich 2018: Event Analytics
Splunk
 
SplunkLive! Frankfurt 2018 - Integrating Metrics & Logs
SplunkLive! Frankfurt 2018 - Integrating Metrics & LogsSplunkLive! Frankfurt 2018 - Integrating Metrics & Logs
SplunkLive! Frankfurt 2018 - Integrating Metrics & Logs
Splunk
 
SplunkLive! Paris 2018: Delivering New Visibility And Analytics For IT Operat...
SplunkLive! Paris 2018: Delivering New Visibility And Analytics For IT Operat...SplunkLive! Paris 2018: Delivering New Visibility And Analytics For IT Operat...
SplunkLive! Paris 2018: Delivering New Visibility And Analytics For IT Operat...
Splunk
 
Splunk Discovery: Warsaw 2018 - Solve Your Security Challenges with Splunk En...
Splunk Discovery: Warsaw 2018 - Solve Your Security Challenges with Splunk En...Splunk Discovery: Warsaw 2018 - Solve Your Security Challenges with Splunk En...
Splunk Discovery: Warsaw 2018 - Solve Your Security Challenges with Splunk En...
Splunk
 
Splunk for Enterprise Security featuring User Behavior Analytics
Splunk for Enterprise Security featuring User Behavior Analytics Splunk for Enterprise Security featuring User Behavior Analytics
Splunk for Enterprise Security featuring User Behavior Analytics
Splunk
 

What's hot (20)

SplunkLive! Munich 2018: Intro to Security Analytics Methods
SplunkLive! Munich 2018: Intro to Security Analytics MethodsSplunkLive! Munich 2018: Intro to Security Analytics Methods
SplunkLive! Munich 2018: Intro to Security Analytics Methods
 
SplunkLive! Frankfurt 2018 - Use Splunk for Incident Response, Orchestration ...
SplunkLive! Frankfurt 2018 - Use Splunk for Incident Response, Orchestration ...SplunkLive! Frankfurt 2018 - Use Splunk for Incident Response, Orchestration ...
SplunkLive! Frankfurt 2018 - Use Splunk for Incident Response, Orchestration ...
 
SplunkLive! Frankfurt 2018 - Get More From Your Machine Data with Splunk AI
SplunkLive! Frankfurt 2018 - Get More From Your Machine Data with Splunk AISplunkLive! Frankfurt 2018 - Get More From Your Machine Data with Splunk AI
SplunkLive! Frankfurt 2018 - Get More From Your Machine Data with Splunk AI
 
SplunkLive! Munich 2018: Get More From Your Machine Data Splunk & AI
SplunkLive! Munich 2018: Get More From Your Machine Data Splunk & AISplunkLive! Munich 2018: Get More From Your Machine Data Splunk & AI
SplunkLive! Munich 2018: Get More From Your Machine Data Splunk & AI
 
SplunkLive! Frankfurt 2018 - Intro to Security Analytics Methods
SplunkLive! Frankfurt 2018 - Intro to Security Analytics MethodsSplunkLive! Frankfurt 2018 - Intro to Security Analytics Methods
SplunkLive! Frankfurt 2018 - Intro to Security Analytics Methods
 
SplunkLive! Munich 2018: Use Splunk for incident Response, Orchestration and ...
SplunkLive! Munich 2018: Use Splunk for incident Response, Orchestration and ...SplunkLive! Munich 2018: Use Splunk for incident Response, Orchestration and ...
SplunkLive! Munich 2018: Use Splunk for incident Response, Orchestration and ...
 
SplunkLive! Frankfurt 2018 - Predictive, Proactive, and Collaborative ML with...
SplunkLive! Frankfurt 2018 - Predictive, Proactive, and Collaborative ML with...SplunkLive! Frankfurt 2018 - Predictive, Proactive, and Collaborative ML with...
SplunkLive! Frankfurt 2018 - Predictive, Proactive, and Collaborative ML with...
 
SplunkLive! Munich 2018: Getting Started with Splunk Enterprise
SplunkLive! Munich 2018: Getting Started with Splunk EnterpriseSplunkLive! Munich 2018: Getting Started with Splunk Enterprise
SplunkLive! Munich 2018: Getting Started with Splunk Enterprise
 
SplunkLive! Munich 2018: Data Onboarding Overview
SplunkLive! Munich 2018: Data Onboarding OverviewSplunkLive! Munich 2018: Data Onboarding Overview
SplunkLive! Munich 2018: Data Onboarding Overview
 
SplunkLive! Paris 2018: Event Management Is Dead
SplunkLive! Paris 2018: Event Management Is DeadSplunkLive! Paris 2018: Event Management Is Dead
SplunkLive! Paris 2018: Event Management Is Dead
 
SplunkLive! Zurich 2018: Use Splunk for Incident Response, Orchestration and ...
SplunkLive! Zurich 2018: Use Splunk for Incident Response, Orchestration and ...SplunkLive! Zurich 2018: Use Splunk for Incident Response, Orchestration and ...
SplunkLive! Zurich 2018: Use Splunk for Incident Response, Orchestration and ...
 
SplunkLive! Frankfurt 2018 - Legacy SIEM to Splunk, How to Conquer Migration ...
SplunkLive! Frankfurt 2018 - Legacy SIEM to Splunk, How to Conquer Migration ...SplunkLive! Frankfurt 2018 - Legacy SIEM to Splunk, How to Conquer Migration ...
SplunkLive! Frankfurt 2018 - Legacy SIEM to Splunk, How to Conquer Migration ...
 
SplunkLive! Munich 2018: Integrating Metrics and Logs
SplunkLive! Munich 2018: Integrating Metrics and LogsSplunkLive! Munich 2018: Integrating Metrics and Logs
SplunkLive! Munich 2018: Integrating Metrics and Logs
 
SplunkLive! Frankfurt 2018 - Monitoring the End User Experience with Splunk
SplunkLive! Frankfurt 2018 - Monitoring the End User Experience with SplunkSplunkLive! Frankfurt 2018 - Monitoring the End User Experience with Splunk
SplunkLive! Frankfurt 2018 - Monitoring the End User Experience with Splunk
 
SplunkLive! Paris 2018: Plenary Session
SplunkLive! Paris 2018: Plenary SessionSplunkLive! Paris 2018: Plenary Session
SplunkLive! Paris 2018: Plenary Session
 
SplunkLive! Zurich 2018: Event Analytics
SplunkLive! Zurich 2018: Event AnalyticsSplunkLive! Zurich 2018: Event Analytics
SplunkLive! Zurich 2018: Event Analytics
 
SplunkLive! Frankfurt 2018 - Integrating Metrics & Logs
SplunkLive! Frankfurt 2018 - Integrating Metrics & LogsSplunkLive! Frankfurt 2018 - Integrating Metrics & Logs
SplunkLive! Frankfurt 2018 - Integrating Metrics & Logs
 
SplunkLive! Paris 2018: Delivering New Visibility And Analytics For IT Operat...
SplunkLive! Paris 2018: Delivering New Visibility And Analytics For IT Operat...SplunkLive! Paris 2018: Delivering New Visibility And Analytics For IT Operat...
SplunkLive! Paris 2018: Delivering New Visibility And Analytics For IT Operat...
 
Splunk Discovery: Warsaw 2018 - Solve Your Security Challenges with Splunk En...
Splunk Discovery: Warsaw 2018 - Solve Your Security Challenges with Splunk En...Splunk Discovery: Warsaw 2018 - Solve Your Security Challenges with Splunk En...
Splunk Discovery: Warsaw 2018 - Solve Your Security Challenges with Splunk En...
 
Splunk for Enterprise Security featuring User Behavior Analytics
Splunk for Enterprise Security featuring User Behavior Analytics Splunk for Enterprise Security featuring User Behavior Analytics
Splunk for Enterprise Security featuring User Behavior Analytics
 

Similar to SplunkLive! Zurich 2018: Monitoring the End User Experience with Splunk

SplunkLive! London 2017 - Happy Apps, Happy Users
SplunkLive! London 2017 - Happy Apps, Happy UsersSplunkLive! London 2017 - Happy Apps, Happy Users
SplunkLive! London 2017 - Happy Apps, Happy Users
Splunk
 
SplunkLive! Paris 2018: Integrating Metrics and Logs
SplunkLive! Paris 2018: Integrating Metrics and LogsSplunkLive! Paris 2018: Integrating Metrics and Logs
SplunkLive! Paris 2018: Integrating Metrics and Logs
Splunk
 
How to Move from Monitoring to Observability, On-Premises and in a Multi-Clou...
How to Move from Monitoring to Observability, On-Premises and in a Multi-Clou...How to Move from Monitoring to Observability, On-Premises and in a Multi-Clou...
How to Move from Monitoring to Observability, On-Premises and in a Multi-Clou...
Splunk
 
Splunk MINT and Stream Breakout
Splunk MINT and Stream BreakoutSplunk MINT and Stream Breakout
Splunk MINT and Stream Breakout
Splunk
 
Monitoring End User Experiences with New Relic & Splunk
Monitoring End User Experiences with New Relic & SplunkMonitoring End User Experiences with New Relic & Splunk
Monitoring End User Experiences with New Relic & Splunk
Abner Germanow
 
Splunk MINT for Mobile Intelligence and Splunk App for Stream for Enhanced Op...
Splunk MINT for Mobile Intelligence and Splunk App for Stream for Enhanced Op...Splunk MINT for Mobile Intelligence and Splunk App for Stream for Enhanced Op...
Splunk MINT for Mobile Intelligence and Splunk App for Stream for Enhanced Op...
Splunk
 
Splunk Webinar: IT Operations Demo für Troubleshooting & Dashboarding
Splunk Webinar: IT Operations Demo für Troubleshooting & DashboardingSplunk Webinar: IT Operations Demo für Troubleshooting & Dashboarding
Splunk Webinar: IT Operations Demo für Troubleshooting & Dashboarding
Georg Knon
 
Splunk in Staples: IT Operations
Splunk in Staples: IT OperationsSplunk in Staples: IT Operations
Splunk in Staples: IT Operations
Timur Bagirov
 
What’s New: Splunk App for Stream and Splunk MINT
What’s New: Splunk App for Stream and Splunk MINTWhat’s New: Splunk App for Stream and Splunk MINT
What’s New: Splunk App for Stream and Splunk MINT
Splunk
 
SplunkLive! London 2017 - DevOps Powered by Splunk
SplunkLive! London 2017 - DevOps Powered by SplunkSplunkLive! London 2017 - DevOps Powered by Splunk
SplunkLive! London 2017 - DevOps Powered by Splunk
Splunk
 
SplunkLive! Zurich 2018: Integrating Metrics and Logs
SplunkLive! Zurich 2018: Integrating Metrics and LogsSplunkLive! Zurich 2018: Integrating Metrics and Logs
SplunkLive! Zurich 2018: Integrating Metrics and Logs
Splunk
 
Splunk Data Onboarding Overview - Splunk Data Collection Architecture
Splunk Data Onboarding Overview - Splunk Data Collection ArchitectureSplunk Data Onboarding Overview - Splunk Data Collection Architecture
Splunk Data Onboarding Overview - Splunk Data Collection Architecture
Splunk
 
Getting Started with Splunk Enterprise
Getting Started with Splunk EnterpriseGetting Started with Splunk Enterprise
Getting Started with Splunk Enterprise
Splunk
 
SplunkLive! Zurich 2017 - Advanced Analytics / Machine Learning
SplunkLive! Zurich 2017 - Advanced Analytics / Machine LearningSplunkLive! Zurich 2017 - Advanced Analytics / Machine Learning
SplunkLive! Zurich 2017 - Advanced Analytics / Machine Learning
Splunk
 
SplunkLive! Paris 2018: Splunk And AI 101
SplunkLive! Paris 2018: Splunk And AI 101SplunkLive! Paris 2018: Splunk And AI 101
SplunkLive! Paris 2018: Splunk And AI 101
Splunk
 
Splunk bangalore user group 2020-06-01
Splunk bangalore user group   2020-06-01Splunk bangalore user group   2020-06-01
Splunk bangalore user group 2020-06-01
NiketNilay
 
Splunk-Presentation
Splunk-Presentation Splunk-Presentation
Splunk-Presentation
PrasadThorat23
 
SplunkLive! Zurich 2018: Get More From Your Machine Data with Splunk & AI
SplunkLive! Zurich 2018: Get More From Your Machine Data with Splunk & AISplunkLive! Zurich 2018: Get More From Your Machine Data with Splunk & AI
SplunkLive! Zurich 2018: Get More From Your Machine Data with Splunk & AI
Splunk
 
SplunkLive! London 2017 - Splunk Enterprise for IT Troubleshooting
SplunkLive! London 2017 - Splunk Enterprise for IT TroubleshootingSplunkLive! London 2017 - Splunk Enterprise for IT Troubleshooting
SplunkLive! London 2017 - Splunk Enterprise for IT Troubleshooting
Splunk
 
Introducing the E.P.I.C. APM: Stimulate User-Loyalty and Differentiation
Introducing the E.P.I.C. APM: Stimulate User-Loyalty and DifferentiationIntroducing the E.P.I.C. APM: Stimulate User-Loyalty and Differentiation
Introducing the E.P.I.C. APM: Stimulate User-Loyalty and Differentiation
CA Technologies
 

Similar to SplunkLive! Zurich 2018: Monitoring the End User Experience with Splunk (20)

SplunkLive! London 2017 - Happy Apps, Happy Users
SplunkLive! London 2017 - Happy Apps, Happy UsersSplunkLive! London 2017 - Happy Apps, Happy Users
SplunkLive! London 2017 - Happy Apps, Happy Users
 
SplunkLive! Paris 2018: Integrating Metrics and Logs
SplunkLive! Paris 2018: Integrating Metrics and LogsSplunkLive! Paris 2018: Integrating Metrics and Logs
SplunkLive! Paris 2018: Integrating Metrics and Logs
 
How to Move from Monitoring to Observability, On-Premises and in a Multi-Clou...
How to Move from Monitoring to Observability, On-Premises and in a Multi-Clou...How to Move from Monitoring to Observability, On-Premises and in a Multi-Clou...
How to Move from Monitoring to Observability, On-Premises and in a Multi-Clou...
 
Splunk MINT and Stream Breakout
Splunk MINT and Stream BreakoutSplunk MINT and Stream Breakout
Splunk MINT and Stream Breakout
 
Monitoring End User Experiences with New Relic & Splunk
Monitoring End User Experiences with New Relic & SplunkMonitoring End User Experiences with New Relic & Splunk
Monitoring End User Experiences with New Relic & Splunk
 
Splunk MINT for Mobile Intelligence and Splunk App for Stream for Enhanced Op...
Splunk MINT for Mobile Intelligence and Splunk App for Stream for Enhanced Op...Splunk MINT for Mobile Intelligence and Splunk App for Stream for Enhanced Op...
Splunk MINT for Mobile Intelligence and Splunk App for Stream for Enhanced Op...
 
Splunk Webinar: IT Operations Demo für Troubleshooting & Dashboarding
Splunk Webinar: IT Operations Demo für Troubleshooting & DashboardingSplunk Webinar: IT Operations Demo für Troubleshooting & Dashboarding
Splunk Webinar: IT Operations Demo für Troubleshooting & Dashboarding
 
Splunk in Staples: IT Operations
Splunk in Staples: IT OperationsSplunk in Staples: IT Operations
Splunk in Staples: IT Operations
 
What’s New: Splunk App for Stream and Splunk MINT
What’s New: Splunk App for Stream and Splunk MINTWhat’s New: Splunk App for Stream and Splunk MINT
What’s New: Splunk App for Stream and Splunk MINT
 
SplunkLive! London 2017 - DevOps Powered by Splunk
SplunkLive! London 2017 - DevOps Powered by SplunkSplunkLive! London 2017 - DevOps Powered by Splunk
SplunkLive! London 2017 - DevOps Powered by Splunk
 
SplunkLive! Zurich 2018: Integrating Metrics and Logs
SplunkLive! Zurich 2018: Integrating Metrics and LogsSplunkLive! Zurich 2018: Integrating Metrics and Logs
SplunkLive! Zurich 2018: Integrating Metrics and Logs
 
Splunk Data Onboarding Overview - Splunk Data Collection Architecture
Splunk Data Onboarding Overview - Splunk Data Collection ArchitectureSplunk Data Onboarding Overview - Splunk Data Collection Architecture
Splunk Data Onboarding Overview - Splunk Data Collection Architecture
 
Getting Started with Splunk Enterprise
Getting Started with Splunk EnterpriseGetting Started with Splunk Enterprise
Getting Started with Splunk Enterprise
 
SplunkLive! Zurich 2017 - Advanced Analytics / Machine Learning
SplunkLive! Zurich 2017 - Advanced Analytics / Machine LearningSplunkLive! Zurich 2017 - Advanced Analytics / Machine Learning
SplunkLive! Zurich 2017 - Advanced Analytics / Machine Learning
 
SplunkLive! Paris 2018: Splunk And AI 101
SplunkLive! Paris 2018: Splunk And AI 101SplunkLive! Paris 2018: Splunk And AI 101
SplunkLive! Paris 2018: Splunk And AI 101
 
Splunk bangalore user group 2020-06-01
Splunk bangalore user group   2020-06-01Splunk bangalore user group   2020-06-01
Splunk bangalore user group 2020-06-01
 
Splunk-Presentation
Splunk-Presentation Splunk-Presentation
Splunk-Presentation
 
SplunkLive! Zurich 2018: Get More From Your Machine Data with Splunk & AI
SplunkLive! Zurich 2018: Get More From Your Machine Data with Splunk & AISplunkLive! Zurich 2018: Get More From Your Machine Data with Splunk & AI
SplunkLive! Zurich 2018: Get More From Your Machine Data with Splunk & AI
 
SplunkLive! London 2017 - Splunk Enterprise for IT Troubleshooting
SplunkLive! London 2017 - Splunk Enterprise for IT TroubleshootingSplunkLive! London 2017 - Splunk Enterprise for IT Troubleshooting
SplunkLive! London 2017 - Splunk Enterprise for IT Troubleshooting
 
Introducing the E.P.I.C. APM: Stimulate User-Loyalty and Differentiation
Introducing the E.P.I.C. APM: Stimulate User-Loyalty and DifferentiationIntroducing the E.P.I.C. APM: Stimulate User-Loyalty and Differentiation
Introducing the E.P.I.C. APM: Stimulate User-Loyalty and Differentiation
 

More from Splunk

.conf Go 2023 - Data analysis as a routine
.conf Go 2023 - Data analysis as a routine.conf Go 2023 - Data analysis as a routine
.conf Go 2023 - Data analysis as a routine
Splunk
 
.conf Go 2023 - How KPN drives Customer Satisfaction on IPTV
.conf Go 2023 - How KPN drives Customer Satisfaction on IPTV.conf Go 2023 - How KPN drives Customer Satisfaction on IPTV
.conf Go 2023 - How KPN drives Customer Satisfaction on IPTV
Splunk
 
.conf Go 2023 - Navegando la normativa SOX (Telefónica)
.conf Go 2023 - Navegando la normativa SOX (Telefónica).conf Go 2023 - Navegando la normativa SOX (Telefónica)
.conf Go 2023 - Navegando la normativa SOX (Telefónica)
Splunk
 
.conf Go 2023 - Raiffeisen Bank International
.conf Go 2023 - Raiffeisen Bank International.conf Go 2023 - Raiffeisen Bank International
.conf Go 2023 - Raiffeisen Bank International
Splunk
 
.conf Go 2023 - På liv og død Om sikkerhetsarbeid i Norsk helsenett
.conf Go 2023 - På liv og død Om sikkerhetsarbeid i Norsk helsenett .conf Go 2023 - På liv og død Om sikkerhetsarbeid i Norsk helsenett
.conf Go 2023 - På liv og død Om sikkerhetsarbeid i Norsk helsenett
Splunk
 
.conf Go 2023 - Many roads lead to Rome - this was our journey (Julius Bär)
.conf Go 2023 - Many roads lead to Rome - this was our journey (Julius Bär).conf Go 2023 - Many roads lead to Rome - this was our journey (Julius Bär)
.conf Go 2023 - Many roads lead to Rome - this was our journey (Julius Bär)
Splunk
 
.conf Go 2023 - Das passende Rezept für die digitale (Security) Revolution zu...
.conf Go 2023 - Das passende Rezept für die digitale (Security) Revolution zu....conf Go 2023 - Das passende Rezept für die digitale (Security) Revolution zu...
.conf Go 2023 - Das passende Rezept für die digitale (Security) Revolution zu...
Splunk
 
.conf go 2023 - Cyber Resilienz – Herausforderungen und Ansatz für Energiever...
.conf go 2023 - Cyber Resilienz – Herausforderungen und Ansatz für Energiever....conf go 2023 - Cyber Resilienz – Herausforderungen und Ansatz für Energiever...
.conf go 2023 - Cyber Resilienz – Herausforderungen und Ansatz für Energiever...
Splunk
 
.conf go 2023 - De NOC a CSIRT (Cellnex)
.conf go 2023 - De NOC a CSIRT (Cellnex).conf go 2023 - De NOC a CSIRT (Cellnex)
.conf go 2023 - De NOC a CSIRT (Cellnex)
Splunk
 
conf go 2023 - El camino hacia la ciberseguridad (ABANCA)
conf go 2023 - El camino hacia la ciberseguridad (ABANCA)conf go 2023 - El camino hacia la ciberseguridad (ABANCA)
conf go 2023 - El camino hacia la ciberseguridad (ABANCA)
Splunk
 
Splunk - BMW connects business and IT with data driven operations SRE and O11y
Splunk - BMW connects business and IT with data driven operations SRE and O11ySplunk - BMW connects business and IT with data driven operations SRE and O11y
Splunk - BMW connects business and IT with data driven operations SRE and O11y
Splunk
 
Splunk x Freenet - .conf Go Köln
Splunk x Freenet - .conf Go KölnSplunk x Freenet - .conf Go Köln
Splunk x Freenet - .conf Go Köln
Splunk
 
Splunk Security Session - .conf Go Köln
Splunk Security Session - .conf Go KölnSplunk Security Session - .conf Go Köln
Splunk Security Session - .conf Go Köln
Splunk
 
Data foundations building success, at city scale – Imperial College London
 Data foundations building success, at city scale – Imperial College London Data foundations building success, at city scale – Imperial College London
Data foundations building success, at city scale – Imperial College London
Splunk
 
Splunk: How Vodafone established Operational Analytics in a Hybrid Environmen...
Splunk: How Vodafone established Operational Analytics in a Hybrid Environmen...Splunk: How Vodafone established Operational Analytics in a Hybrid Environmen...
Splunk: How Vodafone established Operational Analytics in a Hybrid Environmen...
Splunk
 
SOC, Amore Mio! | Security Webinar
SOC, Amore Mio! | Security WebinarSOC, Amore Mio! | Security Webinar
SOC, Amore Mio! | Security Webinar
Splunk
 
.conf Go 2022 - Observability Session
.conf Go 2022 - Observability Session.conf Go 2022 - Observability Session
.conf Go 2022 - Observability Session
Splunk
 
.conf Go Zurich 2022 - Keynote
.conf Go Zurich 2022 - Keynote.conf Go Zurich 2022 - Keynote
.conf Go Zurich 2022 - Keynote
Splunk
 
.conf Go Zurich 2022 - Platform Session
.conf Go Zurich 2022 - Platform Session.conf Go Zurich 2022 - Platform Session
.conf Go Zurich 2022 - Platform Session
Splunk
 
.conf Go Zurich 2022 - Security Session
.conf Go Zurich 2022 - Security Session.conf Go Zurich 2022 - Security Session
.conf Go Zurich 2022 - Security Session
Splunk
 

More from Splunk (20)

.conf Go 2023 - Data analysis as a routine
.conf Go 2023 - Data analysis as a routine.conf Go 2023 - Data analysis as a routine
.conf Go 2023 - Data analysis as a routine
 
.conf Go 2023 - How KPN drives Customer Satisfaction on IPTV
.conf Go 2023 - How KPN drives Customer Satisfaction on IPTV.conf Go 2023 - How KPN drives Customer Satisfaction on IPTV
.conf Go 2023 - How KPN drives Customer Satisfaction on IPTV
 
.conf Go 2023 - Navegando la normativa SOX (Telefónica)
.conf Go 2023 - Navegando la normativa SOX (Telefónica).conf Go 2023 - Navegando la normativa SOX (Telefónica)
.conf Go 2023 - Navegando la normativa SOX (Telefónica)
 
.conf Go 2023 - Raiffeisen Bank International
.conf Go 2023 - Raiffeisen Bank International.conf Go 2023 - Raiffeisen Bank International
.conf Go 2023 - Raiffeisen Bank International
 
.conf Go 2023 - På liv og død Om sikkerhetsarbeid i Norsk helsenett
.conf Go 2023 - På liv og død Om sikkerhetsarbeid i Norsk helsenett .conf Go 2023 - På liv og død Om sikkerhetsarbeid i Norsk helsenett
.conf Go 2023 - På liv og død Om sikkerhetsarbeid i Norsk helsenett
 
.conf Go 2023 - Many roads lead to Rome - this was our journey (Julius Bär)
.conf Go 2023 - Many roads lead to Rome - this was our journey (Julius Bär).conf Go 2023 - Many roads lead to Rome - this was our journey (Julius Bär)
.conf Go 2023 - Many roads lead to Rome - this was our journey (Julius Bär)
 
.conf Go 2023 - Das passende Rezept für die digitale (Security) Revolution zu...
.conf Go 2023 - Das passende Rezept für die digitale (Security) Revolution zu....conf Go 2023 - Das passende Rezept für die digitale (Security) Revolution zu...
.conf Go 2023 - Das passende Rezept für die digitale (Security) Revolution zu...
 
.conf go 2023 - Cyber Resilienz – Herausforderungen und Ansatz für Energiever...
.conf go 2023 - Cyber Resilienz – Herausforderungen und Ansatz für Energiever....conf go 2023 - Cyber Resilienz – Herausforderungen und Ansatz für Energiever...
.conf go 2023 - Cyber Resilienz – Herausforderungen und Ansatz für Energiever...
 
.conf go 2023 - De NOC a CSIRT (Cellnex)
.conf go 2023 - De NOC a CSIRT (Cellnex).conf go 2023 - De NOC a CSIRT (Cellnex)
.conf go 2023 - De NOC a CSIRT (Cellnex)
 
conf go 2023 - El camino hacia la ciberseguridad (ABANCA)
conf go 2023 - El camino hacia la ciberseguridad (ABANCA)conf go 2023 - El camino hacia la ciberseguridad (ABANCA)
conf go 2023 - El camino hacia la ciberseguridad (ABANCA)
 
Splunk - BMW connects business and IT with data driven operations SRE and O11y
Splunk - BMW connects business and IT with data driven operations SRE and O11ySplunk - BMW connects business and IT with data driven operations SRE and O11y
Splunk - BMW connects business and IT with data driven operations SRE and O11y
 
Splunk x Freenet - .conf Go Köln
Splunk x Freenet - .conf Go KölnSplunk x Freenet - .conf Go Köln
Splunk x Freenet - .conf Go Köln
 
Splunk Security Session - .conf Go Köln
Splunk Security Session - .conf Go KölnSplunk Security Session - .conf Go Köln
Splunk Security Session - .conf Go Köln
 
Data foundations building success, at city scale – Imperial College London
 Data foundations building success, at city scale – Imperial College London Data foundations building success, at city scale – Imperial College London
Data foundations building success, at city scale – Imperial College London
 
Splunk: How Vodafone established Operational Analytics in a Hybrid Environmen...
Splunk: How Vodafone established Operational Analytics in a Hybrid Environmen...Splunk: How Vodafone established Operational Analytics in a Hybrid Environmen...
Splunk: How Vodafone established Operational Analytics in a Hybrid Environmen...
 
SOC, Amore Mio! | Security Webinar
SOC, Amore Mio! | Security WebinarSOC, Amore Mio! | Security Webinar
SOC, Amore Mio! | Security Webinar
 
.conf Go 2022 - Observability Session
.conf Go 2022 - Observability Session.conf Go 2022 - Observability Session
.conf Go 2022 - Observability Session
 
.conf Go Zurich 2022 - Keynote
.conf Go Zurich 2022 - Keynote.conf Go Zurich 2022 - Keynote
.conf Go Zurich 2022 - Keynote
 
.conf Go Zurich 2022 - Platform Session
.conf Go Zurich 2022 - Platform Session.conf Go Zurich 2022 - Platform Session
.conf Go Zurich 2022 - Platform Session
 
.conf Go Zurich 2022 - Security Session
.conf Go Zurich 2022 - Security Session.conf Go Zurich 2022 - Security Session
.conf Go Zurich 2022 - Security Session
 

Recently uploaded

DevOps and Testing slides at DASA Connect
DevOps and Testing slides at DASA ConnectDevOps and Testing slides at DASA Connect
DevOps and Testing slides at DASA Connect
Kari Kakkonen
 
FIDO Alliance Osaka Seminar: Passkeys and the Road Ahead.pdf
FIDO Alliance Osaka Seminar: Passkeys and the Road Ahead.pdfFIDO Alliance Osaka Seminar: Passkeys and the Road Ahead.pdf
FIDO Alliance Osaka Seminar: Passkeys and the Road Ahead.pdf
FIDO Alliance
 
From Daily Decisions to Bottom Line: Connecting Product Work to Revenue by VP...
From Daily Decisions to Bottom Line: Connecting Product Work to Revenue by VP...From Daily Decisions to Bottom Line: Connecting Product Work to Revenue by VP...
From Daily Decisions to Bottom Line: Connecting Product Work to Revenue by VP...
Product School
 
Designing Great Products: The Power of Design and Leadership by Chief Designe...
Designing Great Products: The Power of Design and Leadership by Chief Designe...Designing Great Products: The Power of Design and Leadership by Chief Designe...
Designing Great Products: The Power of Design and Leadership by Chief Designe...
Product School
 
GDG Cloud Southlake #33: Boule & Rebala: Effective AppSec in SDLC using Deplo...
GDG Cloud Southlake #33: Boule & Rebala: Effective AppSec in SDLC using Deplo...GDG Cloud Southlake #33: Boule & Rebala: Effective AppSec in SDLC using Deplo...
GDG Cloud Southlake #33: Boule & Rebala: Effective AppSec in SDLC using Deplo...
James Anderson
 
Assuring Contact Center Experiences for Your Customers With ThousandEyes
Assuring Contact Center Experiences for Your Customers With ThousandEyesAssuring Contact Center Experiences for Your Customers With ThousandEyes
Assuring Contact Center Experiences for Your Customers With ThousandEyes
ThousandEyes
 
Search and Society: Reimagining Information Access for Radical Futures
Search and Society: Reimagining Information Access for Radical FuturesSearch and Society: Reimagining Information Access for Radical Futures
Search and Society: Reimagining Information Access for Radical Futures
Bhaskar Mitra
 
ODC, Data Fabric and Architecture User Group
ODC, Data Fabric and Architecture User GroupODC, Data Fabric and Architecture User Group
ODC, Data Fabric and Architecture User Group
CatarinaPereira64715
 
Knowledge engineering: from people to machines and back
Knowledge engineering: from people to machines and backKnowledge engineering: from people to machines and back
Knowledge engineering: from people to machines and back
Elena Simperl
 
Bits & Pixels using AI for Good.........
Bits & Pixels using AI for Good.........Bits & Pixels using AI for Good.........
Bits & Pixels using AI for Good.........
Alison B. Lowndes
 
FIDO Alliance Osaka Seminar: Overview.pdf
FIDO Alliance Osaka Seminar: Overview.pdfFIDO Alliance Osaka Seminar: Overview.pdf
FIDO Alliance Osaka Seminar: Overview.pdf
FIDO Alliance
 
Unsubscribed: Combat Subscription Fatigue With a Membership Mentality by Head...
Unsubscribed: Combat Subscription Fatigue With a Membership Mentality by Head...Unsubscribed: Combat Subscription Fatigue With a Membership Mentality by Head...
Unsubscribed: Combat Subscription Fatigue With a Membership Mentality by Head...
Product School
 
Software Delivery At the Speed of AI: Inflectra Invests In AI-Powered Quality
Software Delivery At the Speed of AI: Inflectra Invests In AI-Powered QualitySoftware Delivery At the Speed of AI: Inflectra Invests In AI-Powered Quality
Software Delivery At the Speed of AI: Inflectra Invests In AI-Powered Quality
Inflectra
 
Connector Corner: Automate dynamic content and events by pushing a button
Connector Corner: Automate dynamic content and events by pushing a buttonConnector Corner: Automate dynamic content and events by pushing a button
Connector Corner: Automate dynamic content and events by pushing a button
DianaGray10
 
Smart TV Buyer Insights Survey 2024 by 91mobiles.pdf
Smart TV Buyer Insights Survey 2024 by 91mobiles.pdfSmart TV Buyer Insights Survey 2024 by 91mobiles.pdf
Smart TV Buyer Insights Survey 2024 by 91mobiles.pdf
91mobiles
 
Accelerate your Kubernetes clusters with Varnish Caching
Accelerate your Kubernetes clusters with Varnish CachingAccelerate your Kubernetes clusters with Varnish Caching
Accelerate your Kubernetes clusters with Varnish Caching
Thijs Feryn
 
Key Trends Shaping the Future of Infrastructure.pdf
Key Trends Shaping the Future of Infrastructure.pdfKey Trends Shaping the Future of Infrastructure.pdf
Key Trends Shaping the Future of Infrastructure.pdf
Cheryl Hung
 
UiPath Test Automation using UiPath Test Suite series, part 3
UiPath Test Automation using UiPath Test Suite series, part 3UiPath Test Automation using UiPath Test Suite series, part 3
UiPath Test Automation using UiPath Test Suite series, part 3
DianaGray10
 
IOS-PENTESTING-BEGINNERS-PRACTICAL-GUIDE-.pptx
IOS-PENTESTING-BEGINNERS-PRACTICAL-GUIDE-.pptxIOS-PENTESTING-BEGINNERS-PRACTICAL-GUIDE-.pptx
IOS-PENTESTING-BEGINNERS-PRACTICAL-GUIDE-.pptx
Abida Shariff
 
The Future of Platform Engineering
The Future of Platform EngineeringThe Future of Platform Engineering
The Future of Platform Engineering
Jemma Hussein Allen
 

Recently uploaded (20)

DevOps and Testing slides at DASA Connect
DevOps and Testing slides at DASA ConnectDevOps and Testing slides at DASA Connect
DevOps and Testing slides at DASA Connect
 
FIDO Alliance Osaka Seminar: Passkeys and the Road Ahead.pdf
FIDO Alliance Osaka Seminar: Passkeys and the Road Ahead.pdfFIDO Alliance Osaka Seminar: Passkeys and the Road Ahead.pdf
FIDO Alliance Osaka Seminar: Passkeys and the Road Ahead.pdf
 
From Daily Decisions to Bottom Line: Connecting Product Work to Revenue by VP...
From Daily Decisions to Bottom Line: Connecting Product Work to Revenue by VP...From Daily Decisions to Bottom Line: Connecting Product Work to Revenue by VP...
From Daily Decisions to Bottom Line: Connecting Product Work to Revenue by VP...
 
Designing Great Products: The Power of Design and Leadership by Chief Designe...
Designing Great Products: The Power of Design and Leadership by Chief Designe...Designing Great Products: The Power of Design and Leadership by Chief Designe...
Designing Great Products: The Power of Design and Leadership by Chief Designe...
 
GDG Cloud Southlake #33: Boule & Rebala: Effective AppSec in SDLC using Deplo...
GDG Cloud Southlake #33: Boule & Rebala: Effective AppSec in SDLC using Deplo...GDG Cloud Southlake #33: Boule & Rebala: Effective AppSec in SDLC using Deplo...
GDG Cloud Southlake #33: Boule & Rebala: Effective AppSec in SDLC using Deplo...
 
Assuring Contact Center Experiences for Your Customers With ThousandEyes
Assuring Contact Center Experiences for Your Customers With ThousandEyesAssuring Contact Center Experiences for Your Customers With ThousandEyes
Assuring Contact Center Experiences for Your Customers With ThousandEyes
 
Search and Society: Reimagining Information Access for Radical Futures
Search and Society: Reimagining Information Access for Radical FuturesSearch and Society: Reimagining Information Access for Radical Futures
Search and Society: Reimagining Information Access for Radical Futures
 
ODC, Data Fabric and Architecture User Group
ODC, Data Fabric and Architecture User GroupODC, Data Fabric and Architecture User Group
ODC, Data Fabric and Architecture User Group
 
Knowledge engineering: from people to machines and back
Knowledge engineering: from people to machines and backKnowledge engineering: from people to machines and back
Knowledge engineering: from people to machines and back
 
Bits & Pixels using AI for Good.........
Bits & Pixels using AI for Good.........Bits & Pixels using AI for Good.........
Bits & Pixels using AI for Good.........
 
FIDO Alliance Osaka Seminar: Overview.pdf
FIDO Alliance Osaka Seminar: Overview.pdfFIDO Alliance Osaka Seminar: Overview.pdf
FIDO Alliance Osaka Seminar: Overview.pdf
 
Unsubscribed: Combat Subscription Fatigue With a Membership Mentality by Head...
Unsubscribed: Combat Subscription Fatigue With a Membership Mentality by Head...Unsubscribed: Combat Subscription Fatigue With a Membership Mentality by Head...
Unsubscribed: Combat Subscription Fatigue With a Membership Mentality by Head...
 
Software Delivery At the Speed of AI: Inflectra Invests In AI-Powered Quality
Software Delivery At the Speed of AI: Inflectra Invests In AI-Powered QualitySoftware Delivery At the Speed of AI: Inflectra Invests In AI-Powered Quality
Software Delivery At the Speed of AI: Inflectra Invests In AI-Powered Quality
 
Connector Corner: Automate dynamic content and events by pushing a button
Connector Corner: Automate dynamic content and events by pushing a buttonConnector Corner: Automate dynamic content and events by pushing a button
Connector Corner: Automate dynamic content and events by pushing a button
 
Smart TV Buyer Insights Survey 2024 by 91mobiles.pdf
Smart TV Buyer Insights Survey 2024 by 91mobiles.pdfSmart TV Buyer Insights Survey 2024 by 91mobiles.pdf
Smart TV Buyer Insights Survey 2024 by 91mobiles.pdf
 
Accelerate your Kubernetes clusters with Varnish Caching
Accelerate your Kubernetes clusters with Varnish CachingAccelerate your Kubernetes clusters with Varnish Caching
Accelerate your Kubernetes clusters with Varnish Caching
 
Key Trends Shaping the Future of Infrastructure.pdf
Key Trends Shaping the Future of Infrastructure.pdfKey Trends Shaping the Future of Infrastructure.pdf
Key Trends Shaping the Future of Infrastructure.pdf
 
UiPath Test Automation using UiPath Test Suite series, part 3
UiPath Test Automation using UiPath Test Suite series, part 3UiPath Test Automation using UiPath Test Suite series, part 3
UiPath Test Automation using UiPath Test Suite series, part 3
 
IOS-PENTESTING-BEGINNERS-PRACTICAL-GUIDE-.pptx
IOS-PENTESTING-BEGINNERS-PRACTICAL-GUIDE-.pptxIOS-PENTESTING-BEGINNERS-PRACTICAL-GUIDE-.pptx
IOS-PENTESTING-BEGINNERS-PRACTICAL-GUIDE-.pptx
 
The Future of Platform Engineering
The Future of Platform EngineeringThe Future of Platform Engineering
The Future of Platform Engineering
 

SplunkLive! Zurich 2018: Monitoring the End User Experience with Splunk

  • 1. Monitoring the End User Experience with Splunk Gain insight on both the experience, and the “why” behind the experience Dirk Nitschke | Senior Sales Engineer 8th May 2018 | Zurich
  • 2. During the course of this presentation, we may make forward-looking statements regarding future events or the expected performance of the company. We caution you that such statements reflect our current expectations and estimates based on factors currently known to us and that actual events or results could differ materially. For important factors that may cause actual results to differ from those contained in our forward-looking statements, please review our filings with the SEC. The forward-looking statements made in this presentation are being made as of the time and date of its live presentation. If reviewed after its live presentation, this presentation may not contain current or accurate information. We do not assume any obligation to update any forward looking statements we may make. In addition, any information about our roadmap outlines our general product direction and is subject to change at any time without notice. It is for informational purposes only and shall not be incorporated into any contract or other commitment. Splunk undertakes no obligation either to develop the features or functionality described or to include any such feature or functionality in a future release. Splunk, Splunk>, Listen to Your Data, The Engine for Machine Data, Splunk Cloud, Splunk Light and SPL are trademarks and registered trademarks of Splunk Inc. in the United States and other countries. All other brand names, product names, or trademarks belong to their respective owners. ©2018 Splunk Inc. All rights reserved. Forward-Looking Statements
  • 4. Complexity – Difficult Issues for Everyone ▶ Is the problem with the app, the network or the backend system? ▶ Why are my specialists all saying “it works” but the application is down? ▶ How does performance compare mobile vs. web vs. desktop?APP MANAGERS/ OPERATIONS ▶ How can I deliver new releases faster? ▶ How can I see how my applications are working in production? ▶ How can other developer, test and monitoring tools improve my coding?DEVELOPERS ▶ How do I ensure new releases don’t break critical apps? ▶ How can I do “full stack” monitoring easily? ▶ What changes will optimize application and infrastructure performance?DEVOPS, SRE PERF MANAGER ▶ How are customers using my app? How is it impacting my business? ▶ Which features should I prioritize for future versions? ▶ Are my customers impacted by outages and performance issues?LINE OF BUSINESS
  • 5. Infrastructure and Application Silos Web Servers Legacy Systems End Users Network/ Load Balancing Messaging Databases Java, .NET, PHG, etc. App Servers Security Virtualization, Containers, Servers, Storage
  • 6. What Is Needed? Web Servers Legacy Systems End Users Network/ Load Balancing Messaging Databases Java,.NET, PHG, etc. App Servers Security Virtualization, Containers, Servers, Storage KPIs, SLOs, service visualization, notable events affecting SLAs Mobile intelligence, wire data, deep integration w/ AWS Correlation with business data to enable context Platform: Universal indexing + analytics of data across silos
  • 7. ▶ Ingest data once – single source of truth across teams ▶ Analyze machine data across entire stack ▶ Integrate data from other management tools ▶ Connect machine data to business services ▶ Identify root cause of problems quickly ▶ Apply best practices in analytics to predict changes in reliability and service usage Reliability Requires a Platform Approach OTHER TEAMS PRODUCT MANAGERS/ BUSINESS OWNERS DEVOPS, SRE PERF MANAGER APP MANAGERS/ OPERATIONS DEVELOPERS
  • 8. A Platform Approach for Application Performance Analytics Network InfrastructureLayer Packet, Payload, Traffic, Utilization, Perf Storage Utilization, Capacity, Performance Server Performance, Usage, Dependency ApplicationLayer User Experience Usage, Response Time, Failed Interactions Byte Code Instrumentation Usage, Experience, Performance, Quality Business Performance Corporate Data, Intake, Output, Throughput Splunk Approach: ▶ Single repository for ALL data ▶ Data in original raw format ▶ Machine learning ▶ Simplified architecture ▶ Fewer resources to manage ▶ Collaborative approach MACHINE DATA
  • 9. Apps for Application Monitoring *ni x Splunk Stream, Real User Monitoring 300+ IT Ops and App Delivery Apps and Add-Ons Splunk for Mobile Intelligence Splunk Apps for Amazon Web Services and Microsoft Exchange
  • 10. ▶ Gain real-time insight into application performance and customer experience ▶ Attain visibility into cloud services ▶ Deliver immediate insights from streaming network ▶ Network-based packet capture does not require DBA or other admin tools and doesn’t affect performance Gaining Transaction Insight From Your Network Splunk Stream
  • 11. HTTP Event Collector – Agentless Fast Insight ▶ Immediate visibility to mobile app crashes ▶ Insight into mobile app use – MAU/DAU, device usage, network insight ▶ Transaction performance insight curl -k https://<host>:8088/services/collector -H 'Authorization: Splunk <token>' -d '{"event":"Hello Event Collector"}' Applications IoT Devices Agentless, direct data onboarding via a standard API Scales to Millions of Events/Second
  • 12. ▶ Immediate visibility to mobile app crashes ▶ Insight into mobile app use – MAU/DAU, device usage, network insight ▶ Transaction performance insights ▶ Correlate mobile with other data types for complete insight Gaining Insight on Your Mobile Apps
  • 13. Splunk IT Service Intelligence Data-driven service monitoring and analytics Splunk IT Service Intelligence Time-Series Index Platform for Operational Intelligence Dynamic Service Models Schema-on-Read Data Model Common Information Model At-a-Glance Problem Analysis Early Warning on Deviations Event Analytics Simplified Incident Workflows
  • 14. Splunk: Application Performance Analytics End Users Networking/ Load-balancing Web Servers App Servers Legacy Systems Messaging Databases Security Virtualization, Containers, Servers, Storage Java, .NET, PHP, etc. Manage to KPIs, SLOs – isolate root case and service impact Analytics for hybrid and cloud environments + microservices stacks Full stack monitoring that integrates your APM tool’s data Platform approach that spans technology and team silos
  • 15. Splunk and APM Section subtitle goes here
  • 16. Traditional APM tools excel at… … but have critical limitations ▶ End user response time (and alerting when performance is slow) ▶ Byte code instrumentation (detecting what code causes bottlenecks) ▶ App server metrics ▶ Application mapping and transaction profiling ▶ Deploying quickly for base-level use cases ▶ “Full stack” monitoring (including networks, load balancers, etc.) ▶ Finding the root cause (that’s usually found in logs) ▶ Reactive (not predictive) ▶ Usually don’t store raw data indefinitely ▶ Advanced analytics (prediction, anomalies, ML, etc.) ▶ Data access for multiple stakeholders (LOBs, security, etc.) APM Tools – Valuable, But Not Enough
  • 17. ▶ Some, but not all of your apps are instrumented ▶ Other “off-the-shelf” apps can’t be instrumented with traditional APM ▶ Non-instrumented parts of your stack can’t be “seen” Covering APM “Blind Spots” Without Splunk Physical Server (Dell, HP, CISCO blades or servers) Guest OS (Windows/Linux/*Nix) Database (Oracle, SQL Server, MySQL) Hypervisor (ESX, HyperV, Citrix) Applications, business/mission services App Server (WebLogic, Jboss EAP, WebSphere) Web Server (Apache, TomCat) SAN/NAS Storage (EMC, AppNet) Network AWS Firewalls Database (Oracle, SQL Server, MySQL) SAN/NAS Storage (EMC, AppNet) Network Load Balancers Legacy Environments (AS400, Mainframe, ESBs, others) Akamai Packaged Apps (SAP, PeopleSoft, etc) Log Analysis (System, Application, Security, etc) APMInstrumented- ApplicationA APMInstrumented- ApplicationB ApplicationD (notAPMInstrumented) ApplicationC (notAPMInstrumented) ▶ End-to-end, holistic visibility to the complete service ▶ Insight across ALL data sources and applications ▶ PREDICTIVE analysis, before issues occur With Splunk
  • 18. ▶ Pull data from APM tools and provide events to APM tools ▶ Gain insight into EUM, application requests, app errors and correlate with logs all in one platform ▶ Reduce the “clicks” between spotting problems and finding root cause ▶ Forecast, predict and detect anomalies in APM data ▶ Integrate triage with non-application layers of the stack APM as a Data Source for Splunk
  • 19. APM Tools ▶ Splunk Add-on and App for New Relic ▶ Splunk Add-on and App for AppDynamics ▶ Dynatrace App (provided by Dynatrace) Other Notable APM Apps ▶ Web Performance (based on boomerang.js) ▶ Splunk Mobile Intelligence (Splunk MINT) ▶ Splunk Stream splunkbase.splunk.com Splunk Apps for APM
  • 20. Splunk Demo Presented by Buttercup Splunker
  • 21. © 2018 SPLUNK INC. ▶ Ensures continuous uptime thanks to real-time operational insights into service and quality metrics ▶ Gains digital intelligence by comparing customer engagement across Zillow sites ▶ Improves DevOps collaboration for faster release cycles Gaining Real-Time Visibility Into Site Operations “Being part of the larger Splunk ecosystem is extremely valuable to us. We couldn't replicate that if we tried to build something on our own… We have given teams enough autonomy to create their own solutions on top of the Splunk platform. It's all predicated on the fact that Splunk is an enterprise-wide self- service utility now within Zillow.” – Director of Site Operations, Zillow ONLINE SERVICES – IT OPERATIONS, APPLICATION DELIVERY
  • 22. © 2018 SPLUNK INC. ▶ Improving website uptime with real-time notifications ▶ Quickly and reliably delivering application features to users ▶ Uncovering business insights and improving the customer experience Democratizing Data to Ensure Great Customer Experience “I don’t believe there is any other product on the market that is able to quickly bring together diverse data sets, offer a powerful language to engineers for data analysis and then ultimately deliver beautiful, visual, actionable reports to the business users.” – Vice President of Engineering, Yelp Reservations TECHNOLOGY – IT OPERATIONS, BUSINESS ANALYTICS
  • 23. © 2018 SPLUNK INC. 1. Transcend the silos 2. Ask any question of your data 3. Liberate your APM data Key Takeaways
  • 24. Thank You! Don't forget to rate this session on Pony Poll https://ponypoll.com/Zurich2018
  • 25. ▶ Splunk Usergroup Zürich ▶ Regular Splunk User get-togethers ▶ Frequent Splunk Ninja Presentations (D/E) ▶ Meetings throughout all major german speaking cities (not only Zurich) ▶ Amtssprache deutsch ▶ Not a sales thing ▶ Kick-off soon ▶ Join now: ▶ https://usergroups.splunk.com/group/splunk- user-group-zurich.html Splunk Usergroup Zurich http://bit.do/SPLUGZ

Editor's Notes

  1. Hi, my name is Dirk Nitschke and I‘m working for Splunk as a Sales Engineer primarily covering Germany. This presentation is called „Monitorin the end user experience with Splunk“. It‘s not only about getting insights into user experience but also about identifying the root cause which means to find out why a user is experiencing, say, a long application response time. Based on these insights you will typically try to enhance the user experience and probably try to adress issues proactively before end users are impacted by service degregation. Why do you want to do this? Well, for many digital services we are using today, there are multiple providers. And I‘ll use the provider who‘s service is the easiest to use for me.
  2. OK, what do we need to do this? Obviously, we need data about the user‘s experience. And if we ask ourselves, why the user experience is as good or bad as it is currently, we also need data about the application itself. But what kind of information and insights do we expect to get from this data?
  3. As always, it depends on your point of view. On this slide we have listed 4 different personas that may be interested in application performance: As application manager who is respnsible for running an application it is important to ensure the appliaction works as expected. And if this is not the case, I want to quickly identify that there is a problem, who is impacted, identify the root cause and quickly frind and implement a solution such that normal operations is restored.   As an application developer I want finish a new version of my application quickly, identify errors quickly, make sure that test and build cycles run smoothly. In addition, I might be interested whether my current version behaves the same way in production as in my typically limited test environment. You don‘t test new software version in prioduction, do you?   As site reliability engineer I have to look at the entire technology stack. My decisions have to take into account theimpact a new version of an application may have on the entire production environment. Which code changes result in performance and user experience enhancements? Therefore, I need a view on the individual application but also dependent applications, endpoints used by end users, the infrastructure – including hardware but also all th elittle helpers like DNS. What happens, when DNS is slow or even down? As business owner I want to know how many users are using my service (not a single application but an entire service!). How are they using my service? Are there functions users don‘t use at all? What is the financial impact of high response times or even a downtime of the service to my business?
  4. Complexity of IT environments has always been a challenge. Current developments like containerization micro-services, the use of on-premise and cloud-based services don‘t simplify IT environments. You r IT environemnt will only look as simple as the one shown on this slide when you take a look from crusing altitude at 30.000 feet. Bottom line is that everyone who is using an application or service today, will interact with components from all these areas directly or indirectly.  Operating and monitoring of these areas is typically organized in silos. Each silo using their specific set of tools resulting in multiple challenges when it comes to root cause analysis of problems. Namely, echange of information between different teams, a missing common view on the entire environment –including conponents located in the cloud.
  5. So what do we need and what are we looking for? First of all a platform that allows to process and analyzes any kind of machin data – across all silos. Based on this machine data we evaluate the health status of entire services and report deviations from the target state and outliers. Direct access to machine data allows to find the root cause of problems. The solution allows to integrate data from on-premise, cloud-based system, and also mobile devices. Additionally, we can correlate business data and machine data coming from IT systems. E.g. add product prices stored in a database to web server data of you rweb shop to see revenue made in the last hour – or to see how many filled carts have not been checked out telling you how much revenue you did not make in the last hour.
  6. A platform approach has multiple advantages: * Data is only read and ingested once instead of storing the same data in multiple systems. This gives you a single source of truth for all teams. * Data can be analyzed across the netire technology stack. Exitsing tools can be integrated. * A centralized view usually allows to analyze the root cause of problems much quicker than based on a set of different tool that don‘t interact.
  7. If we apply all this to application performance analytics, this means: in the application layer we need data about the user experience. How do users use an application or service, which response time do they experience, which interactions are successful, which fail. Information that can be gathered through means like byte code instrumentation provide insights into use and runtime of individual methods and functions. In the infrastructure layer we talk about data from servers, storage system and network components. Data is stored centrally in Splunk. Splunk keeps data in it‘s original format and keeps it as long as you like to. Data can be used and analyzed for different use cases, by different teamys Different user get their individual view to the common set of data.   These views can show you simple statistics like the number of users on your web store in the last hour. But you can also do much more sophisticated things like prediting the number of users of your web site based on historical data. Or you classify your users based on their buying behaviour. Over all, this leads to a consolidation of tools used and a simplification of the architecture.
  8. Which tools do I need to perform application monitoring with Splunk? We want to monitor the entire technology stack, not only individual applications but also components your apps or service depends on. Usually databases, middleware, infrastructure components like operating systems , virtualization, network, storage – and probably some cloud services you are using. For many of these there are ready to use extensions, so-called apps and add-ons that help collecting data and also analyzing it by, e.g., providing useful searches, dashboards, and alerts. On the left hand side we have, for example, the Splunk Add-on for Amazon Web Services and the corresponding app, that collect and visualize data from AWS. On the right hand side we see some example extensions for Vmware, databases, windows and Unix operating systems, the usual web and application server. And yes, we can also use data from specialized APM tools in Splunk.   If you have access to the source code of an application, Splunk HTTP Event Collector may be helpful and for mobile apps we provide Splunk MINT – Splunk for mobile intelligence.   Sometime it is not possible to install software like the Splunk Universal Forwarder om a system or get data remotely. Not all applications can or should be instrumenatilized or you prefer to collect data passively. In this case Splunk Stream can be of interest.
  9. Who already knows Splunk Stream? Splunk stream allows to collect and use the content of network packets. Network traffic is surely the ultimate source if you want to analyze how components communicate with each pther. And sometimes it is the only source we have, e.g., if it is not possible to install Splunk Universal forwarder on a system. Network data comtains a lot of information. If we take a look at HTTP connections, we can get valuable information for operations, e.g. performance metrics like round trip time, response times.  As a developer of a web application, it is of interest which pages people look at, in which sequence.   And as business owner of a webshop I‘m interested in the good sold or not sold, filled carts, number of users etc.
  10. Splunk HTTP Event collector allows to collect data easily via HTTP or HTTPS without installing an additional agent. Developers can easily add it to their applications. The variant is not only simple to use but also effective, secure and scales very well.
  11. Let‘s assume we sell a mobile app. In this case, we are interested in the user‘s experience. We are interested in things like the app‘s performance, network latency, how do users naviagte through the app, how do crash reports look like. Are problems related to the app version, the kind of mobile device being used, the firmware or the carrier? Splunk MINT provides an SDK for Android and iOS which makes it easy to send valuable machine data from mobile apps to Splunk.
  12. OK, now we have all data in Splunk. What‘s next? As said before, applications don‘t live on their own. They are part of a business services and it makes sense to monitor these services end-to-end across the entire technology stack. Splunk IT Service Intelligence as an extention of Splunk provides exactly these options. We create a service model with all components of the sercvices, their dependancies and key performance indicators that allow to calculate a health score or the quality of a service. Based on threshold, we can be notified. Adaptive threshold, outlier detection and event grouping based on services that allow to prioritize notable events add additional value. Splunk as the basis still alows to access raw events for root cause analysis within the same tool.
  13. Let‘s summarize: Splunk is aplatform that allows to collect and analyze all kinds of machine data across different teams. Key performance indicators, service level targets including dependancies and their impact on services and be modeled. You still have access to all your raw event data for root cause analysis of problems showing up. Data can be gathered on premise or from cloud environments giving you insights into hybrid environments.   Central data store allows to take a view across the entire technology stack, including data collected by APM or other existing tools.
  14. APM tools are very good in things like byte code instrumentalization, application mapping, or meauring end user response times. On theother hand, they do not cover the entire technology stack. But this coverage is important, because something like 40% of all outages are caused by errors in your application, another 40% are caused by problems in your infratstructure and the remaining 20% are caused by, say, power outages, ddos attacks or outages of important services like DNS.
  15. Not every application can or should be instrumenatlized and these can be considered a blind spot on your map. Splunk helps to remove blind spots and provide an end-to-end view across the netire technology stack – acentral view to all your data sources.   We can use this data to evaluate the health score of a service or help with root cause analysis. Splunk keeps data in ist original granularity as long as you want o such that you can become proactive and do predictive analysis based on historical data. This helps to address problems before end users are impacted.
  16. For the overall view it makes sense to put data from APM tools into Splunk. Most of these tools have an interface to export data. Splun indexes the data and can be correlated with other sources for root cause analysis. Or you use your APM data to make predictions or find outliers.
  17. For APM tools like New Relic or App Dynamics Aplounk Add-ons exists for intergation. You can find them free of charge on splunkbase.splunk.com. Valuable information can also be gathered using Splunk Stream, Splunk MINT or web performance data basedon boomerang.
  18. OK, let‘s do a littel demo. How could monitoring a web store look like with Spunk? This web store is currently undergoing a migration from on-premise to cloud. And the business owner is quite nervous. Er schaut auf seinen Executive View -> sehe niederieg Anzahl an erfolgreichen Käufen und schlechte umsatzzahlen, Mittelmäßiger ApDex (wer weiss, was ApDex ist?)   Apdex: #good + 0.5#tolerated / #total   Da wir gerade eine Migration machen, wollen wir doch einmal prüfen, ob es etwas gibt, was auffällig ist zwischen on-premise und Cloud. Die Kollegen aus der IT schauen sich das an. Sieht eigentlich alles gut aus. Keine Unterschiede zwischen Cloud und VMware Umgebung. Daher schließen wir die Migration als Ursache aus.   Wie geht es dem Web Shop? Lange Antwortzeiten... in allen Tiern über dem Mittelwert des letzten Tages. Sehe Fehler bei DB Verbindungen des Tomcat Servers. Und bei der DB sehe ich Fehler, dass Logdateien nicht geschrieben werden konnten. Kann jetzt genauer auf die Datenbank schauen (klick on Database Tier!!!) Hier kann ich bestätigen, dass es Probleme mit dem freien Speicherplatz gibt. Eigentlich sollte die Logs ja regelmäßig gelöscht werden. Aber ich sehe, dass mysql Server Problem mit einem Locked Account hat.   Hmm, aber die letzten Fehler sind schon eine Weile her. Ist da noch mehr?   Schauen wir noch auf die Mobile App. Wie sieht es da aus? End User Performance Metrics (MINT) Error Rate by App Version -> only 6.0! Latency per App Version -> 6.0!!!   Am Ende: Mobile App Health, Latency by App Version -> Version 6.0 hat lange Antwortzeiten.
  19. Industry Online services Real estate Splunk Use Cases • Business analytics • IT operations • Application delivery Challenges Third-party and homegrown open-source solutions could not keep up with data volume Needed to ensure uptime and maintain SLAs for issue resolution Log les were not standardized and contained unnecessary information Required robust monitoring and reporting solution Lacked visibility into vast volumes of siloed log data Needed the ability to create ad hoc reporting and provide visibility into the health of key transactions, end-to-end, in real time Additional Business Impact: Provides self-service to teams across the enterprise to create their own solutions Faster incident isolation and mitigation Correlates user experience metrics with application performance for improved customer website experience Splunk Products • Splunk Enterprise • Splunk Cloud (Planned: Trulia,® Retsly®) • Splunk SDK Data Sources • Application logs • Server logs • Website logs including property listings • Data from API endpoints (JSON) • Mobile application data • Website performance data Case Study http://www.splunk.com/en_us/customers/success-stories/zillow.html Video http://www.splunk.com/en_us/resources/video.psbW41MzE6QgFDBeMDL0VtdskHezTBDw.html Blog Post: http://blogs.splunk.com/2016/05/10/zillow-finds-its-way-home-with-splunk/?awesm=splk.it_w0S Sales Email template: https://splunk.my.salesforce.com/06933000001O5t0 SplunkLive! Seattle presentation: http://www.slideshare.net/Splunk/zillow-35018327 Splunk blog by Grigori Melnick: http://blogs.splunk.com/2015/05/13/zillow-developing-on-splunk/
  20. Industry Technology Splunk Use Cases IT operations Application delivery Business analytics Challenges Difficulty accessing and managing data across the enterprise Open source platform lacked stability and scalability needed to accommodate large and growing data volume Accessing data to make actionable decisions took up to weeks Developers lacked infrastructure visibility needed to ensure smooth application delivery Splunk Products Splunk Enterprise Splunk App for Unix and Linux Splunk Machine Learning Toolkit Splunk App for AWS Data Sources Application Database Third-party Case Study https://www.splunk.com/en_us/customers/success-stories/yelp.html 
  21. The key takeaways are: To monitor the user experience it is not sufficient to monitor individual applications. Transcend the silos in your monitoring environement and gather data centrally in Splunk. This gives you access to the full information hidden in your machine data. This is also true for data currently gathered in other tools. Add them to Splunk, too.
  22. Thank you! Please give feedback and rate this session on Pony Poll. The URL can be found on the right hand side – and is also encoded in the QR code.
  23. Splunk usergroup zurich