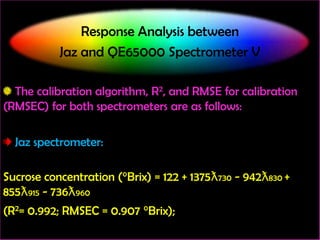
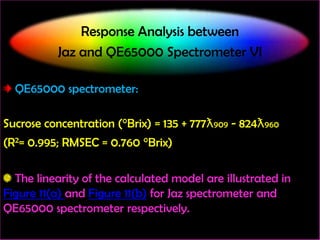
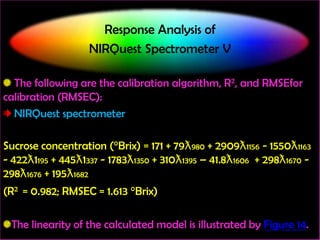
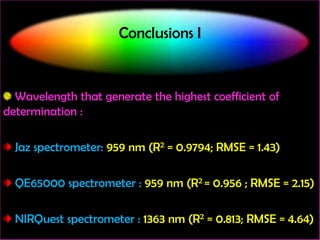
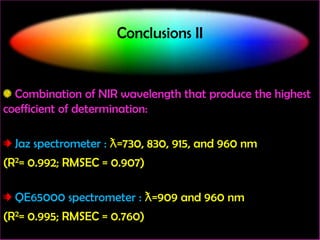
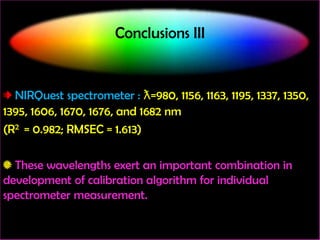
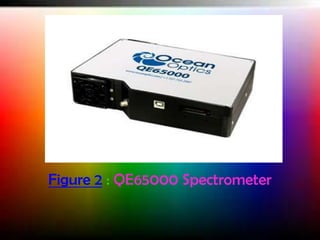
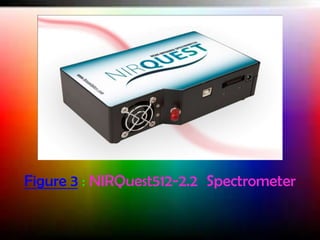
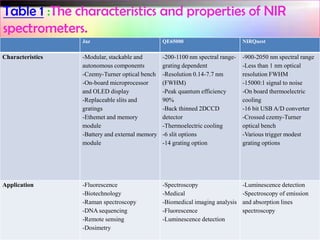
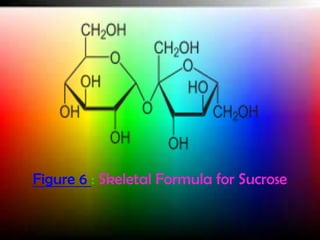
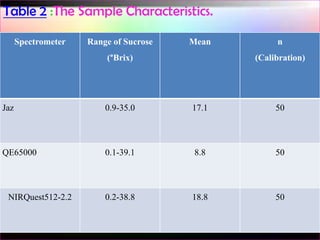
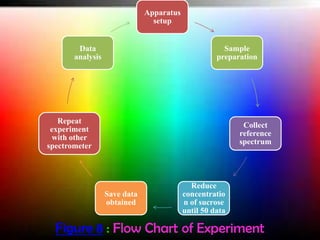
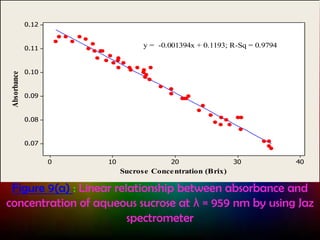
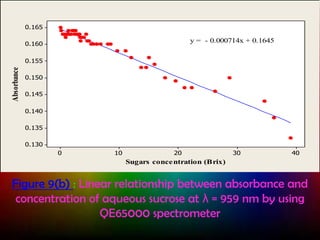
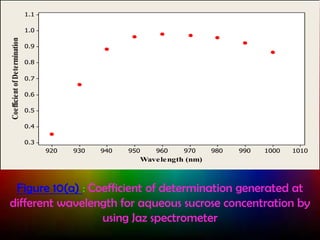
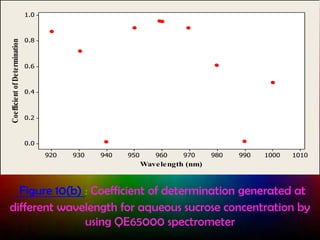
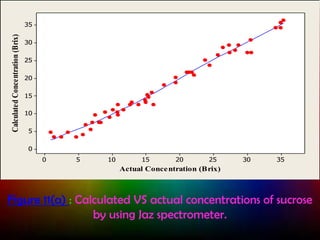
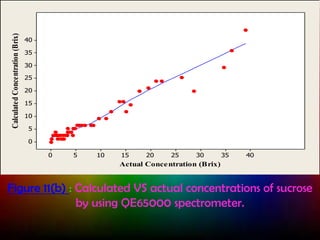
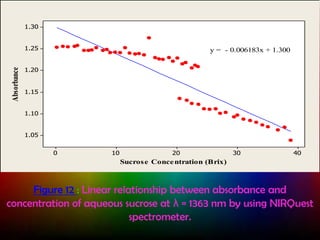
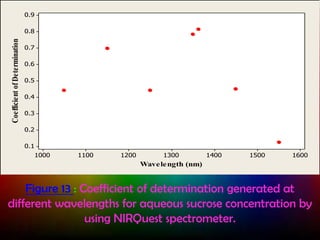
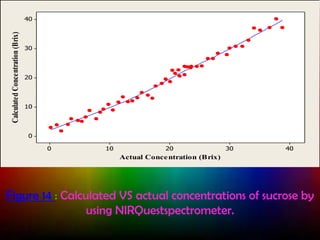
This study compared three near-infrared (NIR) spectrometers - Jaz, QE65000, and NIRQuest - for measuring sucrose concentration. All spectrometers showed a linear decrease in absorption with increasing sucrose concentration. Multiple linear regression improved correlations. Wavelengths of 959nm, 959nm, and 1363nm produced the highest coefficients of determination for Jaz, QE65000, and NIRQuest, respectively. Combinations of wavelengths generated the best calibration algorithms, with NIRQuest showing the highest coefficient of determination overall. The study concludes the spectrometers can effectively measure sucrose concentration using NIR spectroscopy.
Comparative Calibration Method Between two Different Wavelengths With Aureole...Waqas Tariq
A multi-stage method for calibration of sunphotometer is proposed by combining comparison calibration method between two different wavelengths with aureole observation method for long wavelength calibration. Its effectiveness in reducing the influences for calibration due to molecular and aerosolfs extinction in the unstable turbidity conditions is clarified. By comparing the calculated results with the proposed method and the existing individually calibration method, it is found that the proposed method is superior to the existing method in terms of calibration accuracy. Namely, Through a comparison between ILM and the proposed method using band 0.87um as reference, the largest calibration errors are 0.0014, 0.0428 by PM are lower than that by ILM (0.011,0.0489) for sky radiances with no error and -3~+3%, -5~+5% errors. By analyzing the observation data of 15 days with POM-1 Skyradiometer, the largest standard deviation of calibration constants by PM is 0.02016, and is lower than that by ILM (0.03858).
ENVIRONMENTALLY CORRECTED RSSI BASED REAL TIME LOCATION DETECTION SYSTEMijcsit
RSSI based localization techniques are effected by environmental factors which cause the RF signalsemitted from transmitter nodes fluctuate in time domain. These variations generate fluctuations on distance calculations and result false object position detection during localization.Smoothing procedures must be applied on distance values either collectively or individually to minimize these fluctuations. In this
study,proposed detection system has two main phases. Firstly, calibration of RSSI values with respect to distances and calculation of environmental coefficient for each ransmitter.Secondly, position estimation of objects by applyingiterative trilateration on smoothed distance values. A smoothing algorithm is employed to minimize the dynamic fluctuations of RF signals received from each reference transmitter node. Distances between the reference nodes and the objects are calculated by deploying environmental
coefficients. Experimental measurements are carried out to measure the sensitivity of the system. Results show that the proposed system can be deployed as a viable position detection system in indoors and outdoors.
Quality Measurements Using NIR/MIR Spectroscopy: A Rotten Apple Could Turn Yo...TechRentals
Light interacts with a product's organic molecules causing variations in light absorption. The transmitted or reflected light can be measured with a spectrometer and the resultant spectral signature used to qualify or quantify properties of the product. The discussion will include - how light interacts with molecules, characteristics of the different electromagnetic spectral bands, in-line hardware required to collect light, and fundamentals of chemometrics.
Presenter -- Gary Brown
Gary Brown is one of the principle engineers with Australian Innovative Engineering and has spent the last 12+ years developing in-line instrumentation using NIR spectroscopy to measure properties of fresh fruit. He is now concentrating his efforts in applying the technology for in-line product authentication for the food and pharmaceutical industries.
SP-ICP-MS Analysis of Size and Number Concentration in Mixtures of Monometall...PerkinElmer, Inc.
It is challenging to separate and measure the physical and chemical properties of monometallic and bimetallic engineered nanoparticles (NPs), especially when mixtures of NPs consist of particles of similar size, composition, and especially when present at low concentrations.
Explanation of very simple methods for atmospheric corrections and an example adapted from a paper of the Dept. of Thermodynamics, University of Valencia, Spain.
Monitoring of the Sulfur and Nano Silver in Water by Method of Laser Spectros...IJERA Editor
We developed new automatic method that combines the method of forced lumines-cence and stimulated Brillouin scattering (SBS). We used the method for the pathogens monitoring in water supply system earlier. We have researched spectral peaks of gases and show that method allows determining H2S content with 0.01% accuracy and determining the content constituents of nano silver in water.
Applications of IR (Infrared) Spectroscopy in Pharmaceutical Industrywonderingsoul114
Various applications of IR (Infrared) Spectroscopy in Pharmaceutical industries related to drug discovery and structural elucidation is outlined in this presentation. Various qualitative and quantitative analysis of drug products are also outlined.
FT-NIR as a real-time QC tool for polymer manufacturingGalaxy Scientific
Near infrared spectroscopy has been used widely in the polymer industry. Compared to traditional methods such as wet chemistry and chromatographic methods, NIR spectroscopy provides considerable advantages in process and quality control applications through fundamental benefits such as low to no cost of consumables such as solvents, columns, reagents; real time analysis - generally less than 10 seconds measurement time; multiple components per analysis; elimination of sample preparation time; and elimination of many sources of systematic error.
This presentation will present three FT-NIR polymer applications: 1) at line polyether polyols’ hydroxyl value analysis; 2) real time isocyanate number monitoring during a polyurethane reaction; and 3) off-line quality control of percentage styrene in styrene copolymers.
MODELING THE CHLOROPHYLL-A FROM SEA SURFACE REFLECTANCE IN WEST AFRICA BY DEE...gerogepatton
Deep learning provide successful applications in many fields. Recently, machines learning are involved for oceans remote sensing applications. In this study, we use and compare about eight (8) deep learning estimators for retrieval of a mainly pigment of phytoplankton. Depending on the water case and the multiple instruments simultaneously observing the earth on a variety of platforms, several algorithm are used to estimate the chlolophyll-a from marine reflectance.By using a long-term multi-sensor time-series of satellite ocean-colour data, as MODIS, SeaWifs, VIIRS, MERIS, etc…, we make a unique deep network model able to establish a relationship between sea surface reflectance and chlorophyll-a from any measurement satellite sensor over West Africa. These data fusion take into account the bias between case water and instruments.We construct several chlorophyll-a concentration prediction deep learning based models, compare them and therefore use the best for our study. Results obtained for accuracy training and test are quite good. The mean absolute error are very low and vary between 0,07 to 0,13 mg/m
MODELING THE CHLOROPHYLL-A FROM SEA SURFACE REFLECTANCE IN WEST AFRICA BY DEE...ijaia
Deep learning provide successful applications in many fields. Recently, machines learning are involved for oceans remote sensing applications. In this study, we use and compare about eight (8) deep learning estimators for retrieval of a mainly pigment of phytoplankton. Depending on the water case and the multiple instruments simultaneously observing the earth on a variety of platforms, several algorithm are used to estimate the chlolophyll-a from marine reflectance.By using a long-term multi-sensor time-series of satellite ocean-colour data, as MODIS, SeaWifs, VIIRS, MERIS, etc…, we make a unique deep network model able to establish a relationship between sea surface reflectance and chlorophyll-a from any measurement satellite sensor over West Africa. These data fusion take into account the bias between case water and instruments.We construct several chlorophyll-a concentration prediction deep learning based models, compare them and therefore use the best for our study. Results obtained for accuracy training and test are quite good. The mean absolute error are very low and vary between 0,07 to 0,13 mg/m3 .
Modeling the Chlorophyll-a from Sea Surface Reflectance in West Africa by Dee...gerogepatton
Deep learning provide successful applications in many fields. Recently, machines learning are involved for oceans remote sensing applications. In this study, we use and compare about eight (8) deep learning estimators
for retrieval of a mainly pigment of phytoplankton. Depending on the water case and the multiple instruments simultaneously observing the earth on a variety of platforms, several algorithm are used to estimate the chlolophyll-a from marine eflectance.By using a long-term multi-sensor time-series of satellite ocean-colour data, as MODIS, SeaWifs, VIIRS, MERIS, etc…, we make a unique deep network model able to establish a relationship between sea surface reflectance and chlorophyll-a from any measurement satellite sensor over West
Africa. These data fusion take into account the bias between case water and instruments. We construct several chlorophyll-a concentration prediction deep learning based models, compare them and therefore use the best for our study. Results obtained for accuracy training and test are quite good. The mean absolute error are very low and vary between 0,07 to 0,13 mg/m3.
Design and Development of a Shortwave near Infrared Spectroscopy using NIR LE...IJECEIAES
Near infrared (NIR) spectroscopic technology has been getting more attention in various fields. The development of a low cost NIR spectroscopy is crucial to reduce the financial barriers so that more NIR spectroscopic applications will be investigated and developed by means of the NIR spectroscopic technology. This study proposes an alternative to measure shortwave NIR spectrum using one collimating lens, two slits, one NIR transmission grating, one linear array sensor, and one microcontroller. Five high precision narrow bands NIR light emitting diodes (LEDs) were used to calibrate the proposed spectroscopy. The effects of the proposed two slits design, the distance between the grating and linear array sensor, and three different regression models were investigated. The accuracy of the proposed design was cross-validated using leave-one-out cross-validation. Results show that the proposed two slits design was able to eliminate unwanted signals substantially, and the cross-validation was able to estimate the best model with root mean squared error of cross-validation of 3.8932nm. Findings indicate that the cross-validation approach is a good approach to estimate the final model without over-fitting, and the proposed shortwave NIR spectroscopy was able to estimate the peak value of the acquired spectrum from NIR LEDs with RMSE of 1.1616nm.
Characterization of Liquid Waste in Isotope production and Research Facilitiesiosrjce
IOSR Journal of Applied Physics (IOSR-JAP) is a double blind peer reviewed International Journal that provides rapid publication (within a month) of articles in all areas of physics and its applications. The journal welcomes publications of high quality papers on theoretical developments and practical applications in applied physics. Original research papers, state-of-the-art reviews, and high quality technical notes are invited for publications.
Optimization of light source wavelength for ammonia detection in waterTELKOMNIKA JOURNAL
Optimization of light source wavelength for ammonia detection in surface water is presented in this work. For the ammonia detection, the surface water sample is mixed with sodium chloride and nessler reagent, whereas the sensor head consists of unclad plastic optical fiber. The unclad region has a length of 1 cm and the cladding is removed by immersing it in acetone solution. Experimental results indicate that the output light intensity of the sensor has linear relationship with the ammonia concentration. At the wavelength of 510 nm, the output light increases linearly as the ammonia concentration varies from 0.07 mg/L to 8.97 mg/L. At the same wavelength, the proposed sensor achieves the sensitivity of 0.0139 (mg/L)-1, accuracy of 99.59% and resolution of 0.72 µg/L. The analysis of light source wavelength reveals that a wavelength range from 450 nm to 580 nm produces the optimized performances. Within this wavelength range, the proposed sensor achieves sensitivity of higher than 0.01 (mg/L)-1, accuracy of higher than 99% and resolution of less than 1 µg/L.
Embracing GenAI - A Strategic ImperativePeter Windle
Artificial Intelligence (AI) technologies such as Generative AI, Image Generators and Large Language Models have had a dramatic impact on teaching, learning and assessment over the past 18 months. The most immediate threat AI posed was to Academic Integrity with Higher Education Institutes (HEIs) focusing their efforts on combating the use of GenAI in assessment. Guidelines were developed for staff and students, policies put in place too. Innovative educators have forged paths in the use of Generative AI for teaching, learning and assessments leading to pockets of transformation springing up across HEIs, often with little or no top-down guidance, support or direction.
This Gasta posits a strategic approach to integrating AI into HEIs to prepare staff, students and the curriculum for an evolving world and workplace. We will highlight the advantages of working with these technologies beyond the realm of teaching, learning and assessment by considering prompt engineering skills, industry impact, curriculum changes, and the need for staff upskilling. In contrast, not engaging strategically with Generative AI poses risks, including falling behind peers, missed opportunities and failing to ensure our graduates remain employable. The rapid evolution of AI technologies necessitates a proactive and strategic approach if we are to remain relevant.
The Roman Empire A Historical Colossus.pdfkaushalkr1407
The Roman Empire, a vast and enduring power, stands as one of history's most remarkable civilizations, leaving an indelible imprint on the world. It emerged from the Roman Republic, transitioning into an imperial powerhouse under the leadership of Augustus Caesar in 27 BCE. This transformation marked the beginning of an era defined by unprecedented territorial expansion, architectural marvels, and profound cultural influence.
The empire's roots lie in the city of Rome, founded, according to legend, by Romulus in 753 BCE. Over centuries, Rome evolved from a small settlement to a formidable republic, characterized by a complex political system with elected officials and checks on power. However, internal strife, class conflicts, and military ambitions paved the way for the end of the Republic. Julius Caesar’s dictatorship and subsequent assassination in 44 BCE created a power vacuum, leading to a civil war. Octavian, later Augustus, emerged victorious, heralding the Roman Empire’s birth.
Under Augustus, the empire experienced the Pax Romana, a 200-year period of relative peace and stability. Augustus reformed the military, established efficient administrative systems, and initiated grand construction projects. The empire's borders expanded, encompassing territories from Britain to Egypt and from Spain to the Euphrates. Roman legions, renowned for their discipline and engineering prowess, secured and maintained these vast territories, building roads, fortifications, and cities that facilitated control and integration.
The Roman Empire’s society was hierarchical, with a rigid class system. At the top were the patricians, wealthy elites who held significant political power. Below them were the plebeians, free citizens with limited political influence, and the vast numbers of slaves who formed the backbone of the economy. The family unit was central, governed by the paterfamilias, the male head who held absolute authority.
Culturally, the Romans were eclectic, absorbing and adapting elements from the civilizations they encountered, particularly the Greeks. Roman art, literature, and philosophy reflected this synthesis, creating a rich cultural tapestry. Latin, the Roman language, became the lingua franca of the Western world, influencing numerous modern languages.
Roman architecture and engineering achievements were monumental. They perfected the arch, vault, and dome, constructing enduring structures like the Colosseum, Pantheon, and aqueducts. These engineering marvels not only showcased Roman ingenuity but also served practical purposes, from public entertainment to water supply.
The French Revolution, which began in 1789, was a period of radical social and political upheaval in France. It marked the decline of absolute monarchies, the rise of secular and democratic republics, and the eventual rise of Napoleon Bonaparte. This revolutionary period is crucial in understanding the transition from feudalism to modernity in Europe.
For more information, visit-www.vavaclasses.com
How to Make a Field invisible in Odoo 17Celine George
It is possible to hide or invisible some fields in odoo. Commonly using “invisible” attribute in the field definition to invisible the fields. This slide will show how to make a field invisible in odoo 17.
Operation “Blue Star” is the only event in the history of Independent India where the state went into war with its own people. Even after about 40 years it is not clear if it was culmination of states anger over people of the region, a political game of power or start of dictatorial chapter in the democratic setup.
The people of Punjab felt alienated from main stream due to denial of their just demands during a long democratic struggle since independence. As it happen all over the word, it led to militant struggle with great loss of lives of military, police and civilian personnel. Killing of Indira Gandhi and massacre of innocent Sikhs in Delhi and other India cities was also associated with this movement.
Francesca Gottschalk - How can education support child empowerment.pptxEduSkills OECD
Francesca Gottschalk from the OECD’s Centre for Educational Research and Innovation presents at the Ask an Expert Webinar: How can education support child empowerment?
Biological screening of herbal drugs: Introduction and Need for
Phyto-Pharmacological Screening, New Strategies for evaluating
Natural Products, In vitro evaluation techniques for Antioxidants, Antimicrobial and Anticancer drugs. In vivo evaluation techniques
for Anti-inflammatory, Antiulcer, Anticancer, Wound healing, Antidiabetic, Hepatoprotective, Cardio protective, Diuretics and
Antifertility, Toxicity studies as per OECD guidelines
Instructions for Submissions thorugh G- Classroom.pptxJheel Barad
This presentation provides a briefing on how to upload submissions and documents in Google Classroom. It was prepared as part of an orientation for new Sainik School in-service teacher trainees. As a training officer, my goal is to ensure that you are comfortable and proficient with this essential tool for managing assignments and fostering student engagement.
Introduction to AI for Nonprofits with Tapp NetworkTechSoup
Dive into the world of AI! Experts Jon Hill and Tareq Monaur will guide you through AI's role in enhancing nonprofit websites and basic marketing strategies, making it easy to understand and apply.
3. NIR Spectroscopy I
A spectroscopic method that uses the near-infrared region
of the electromagnetic spectrum (from about 800 nm to
2500 nm).
NIR spectra have only a few significant peaks, but they
are exceptionally information-rich due to the number of
overlapping absorption bands.
4. NIR Spectroscopy II
NIR can typically penetrate much further into a sample
than mid infrared radiation due to the low coefficient of
absorbance.
NIR radiation has less energy/photon but does excite
molecular vibrations.
NIR measurements are non-destructive and samples are
not altered and can be reused.
5. The Importance of Measuring
Sugar Concentration in Fruit I
Commonly used in the wide range of crops.
The important aspect to test the maturity of fruit and
obtain the right time to harvest it.
The percentage of sugar (oBrix), indicates the sweetness of
the fruit.
6. The Importance of Measuring
Sugar Concentration in Fruit II
Contribute to the calculation of sugar-acid ratio which is
one of the step needed to test the maturity of fruit.
One critical element of the ripening involves the conversion
of starches to sugars.
The example of starch test is shown in Figure 1.
7. Objectives
1. To compare response analysis between lower and same
range of NIR wavelength (Jaz and QE65000)
spectrometer.
2. To identify response analysis of higher range of
wavelength (NIRQuest) spectrometer.
3. To compare response analysis between lower and higher
range of NIR wavelength spectrometer.
8. Problem
Statement
The NIR spectrometers are widely used in the spectroscopy
field.
The calibration transfer between NIR spectrometers
should be practiced in spectroscopy field to improve the
efficiency in energy, time and work.
The comparative study between NIR spectrometers will
give huge contribution to the calibration transfer.
10. Apparatus and
Material Background I
The apparatus used in the experiment are:
QE65000 Spectrometer (650 – 1100 nm), Figure 2.
NIRQuest512-2.2 Spectrometer (900 – 2200 nm), Figure 3.
Handheld Refractometer, Figure 4.
The apparatus used in the reference taken:
JAZ-COMBO Spectrometer (650 – 1100 nm), Figure 5.
*** The characteristics and properties of NIR spectrometers are
shown in the Table 1.
11. Apparatus and
Material Background II
The material used in the experiment is:
Sucrose:
The molecule is a disaccharide sugar composed of the
monosaccharides glucose and fructose with the molecular
formula C12H22O11.
*** The skeletal formula for sucrose is shown in the Figure 6.
12. Experiment
Setup
The overall experimental setup was conducted using
spectroscopic instrumentations from Ocean Optics.
The setup is illustrated in Figure 7.
The response was due to mixture between water with
sucrose for different type of spectrometer.
The characteristics of sucrose sample used in the
experiment are tabulated in Table 2.
13. Methodology
The flow chart of the experiment is shown in the Figure 8.
The experiment was conducted only for the calibration
data.
15. Response Analysis between
Jaz and QE65000 Spectrometer I
Significant results were managed to be located at
wavelength between approximately 940 and 985 nm.
Figure 9(a) and Figure 9(b) shows the resultant linear
regression generated between absorbance and sucrose
concentration by using Jaz and QE65000 spectrometer
respectively.
16. Response Analysis between
Jaz and QE65000 Spectrometer II
λ = 959 nm managed to generate the highest coefficient
of determination for sucrose by using:
Jaz spectrometer : R2 = 0.9794; RMSE = 1.43
QE65000 spectrometer : R2 = 0.956 ; RMSE = 2.15
The pattern behaviour of linear relationship between
absorbance and the sucrose concentration against
wavelengths for Jaz and QE65000 spectrometer are shown
in Figure 10(a) and Figure 10(b) respectively.
17. Response Analysis between
Jaz and QE65000 Spectrometer III
It can be seen that the correlation between absorbance
and sucrose concentration starts to loose its linearity once it
has moved further than 960 nm.
Further analysis through the application of Multiple Linear
Regression (MLR) has successfully improved the correlation
for sucrose measurement.
18. Response Analysis between
Jaz and QE65000 Spectrometer IV
The highest efficiency algorithm has been identified by
using different wavelengths:
Jaz spectrometer: 730, 830, 915, and 960 nm
QE65000 spectrometer: 909 and 960 nm
19. Response Analysis between
Jaz and QE65000 Spectrometer V
The calibration algorithm, R2, and RMSE for calibration
(RMSEC) for both spectrometers are as follows:
Jaz spectrometer:
Sucrose concentration (°Brix) = 122 + 1375ƛ730 - 942ƛ830 +
855ƛ915 - 736ƛ960
(R2= 0.992; RMSEC = 0.907 °Brix);
20. Response Analysis between
Jaz and QE65000 Spectrometer VI
QE65000 spectrometer:
Sucrose concentration (°Brix) = 135 + 777ƛ909 - 824ƛ960
(R2= 0.995; RMSEC = 0.760 °Brix)
The linearity of the calculated model are illustrated in
Figure 11(a) and Figure 11(b) for Jaz spectrometer and
QE65000 spectrometer respectively.
21. Response Analysis of
NIRQuest Spectrometer I
Significant result is managed to be located at wavelength
between approximately 980 and 1700 nm.
Figure 12 shows the resultant linear regression generated
between absorbance and sucrose concentration by using
NIRQuest spectrometer.
22. Response Analysis of
NIRQuest Spectrometer II
λ = 1363 nm managed to generate the highest coefficient
of determination and lowest RMSE for sucrose by using:
NIRQuest spectrometer : R2 = 0.813; RMSE = 4.64
The pattern behaviour of linear relationship between
absorbance and the sucrose concentration against
wavelengths for NIRQuest spectrometer is shown in Figure 13.
23. Response Analysis of
NIRQuest Spectrometer III
The correlation between absorbance and sucrose
concentration starts to loose its linearity once it has moved
further than 1400 nm.
Further analysis through the application of Multiple Linear
Regression (MLR) has successfully improved the correlation
for sucrose measurement.
24. Response Analysis of
NIRQuest Spectrometer IV
The highest efficiency algorithm has been identified by
using different wavelengths:
NIRQuest spectrometer : 980, 1156, 1163, 1195, 1337, 1350,
1395, 1606, 1670, 1676, and 1682 nm.
25. Response Analysis of
NIRQuest Spectrometer V
The following are the calibration algorithm, R2, and RMSEfor
calibration (RMSEC):
NIRQuest spectrometer
Sucrose concentration (°Brix) = 171 + 79ƛ980 + 2909ƛ1156 - 1550ƛ1163
- 422ƛ1195 + 445ƛ1337 - 1783ƛ1350 + 310ƛ1395 – 41.8ƛ1606 + 298ƛ1670 298ƛ1676 + 195ƛ1682
(R2 = 0.982; RMSEC = 1.613 °Brix)
The linearity of the calculated model is illustrated by Figure 14.
26. Response Analysis between
NIR Spectrometers I
By comparing the three spectrometers, all of them show
the same properties :
The absorption of a specific range of NIR wavelength
decreases linearly with the increases of sucrose concentration.
Further analysis through MLR has successfully improved
the correlation for sucrose measurement.
27. Response Analysis between
NIR Spectrometers II
The ascending order of highest coefficient determination
produced are by using NIRQuest, Jaz, and QE65000
spectrometers.
30. Conclusions II
Combination of NIR wavelength that produce the highest
coefficient of determination:
Jaz spectrometer : ƛ=730, 830, 915, and 960 nm
(R2= 0.992; RMSEC = 0.907)
QE65000 spectrometer : ƛ=909 and 960 nm
(R2= 0.995; RMSEC = 0.760)
31. Conclusions III
NIRQuest spectrometer : ƛ=980, 1156, 1163, 1195, 1337, 1350,
1395, 1606, 1670, 1676, and 1682 nm
(R2 = 0.982; RMSEC = 1.613)
These wavelengths exert an important combination in
development of calibration algorithm for individual
spectrometer measurement.
32. Recommendations
For future experiment :
record the validation data as well in order to confirm the
prediction.
conduct the experiment by using the sugar content in fruit
to obtain the real experience on how to improve the intrinsic
quality of fruit.