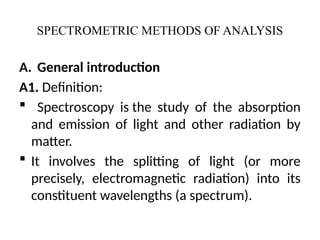
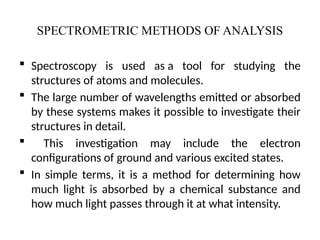
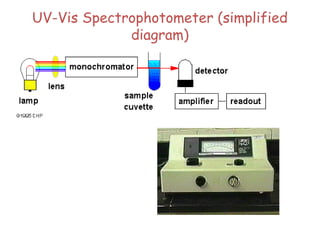
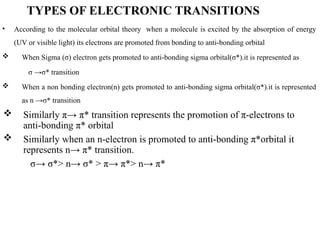
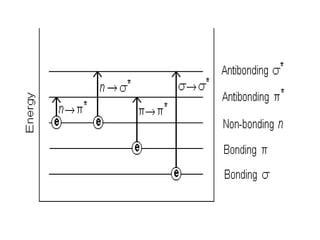
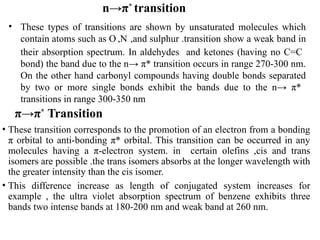
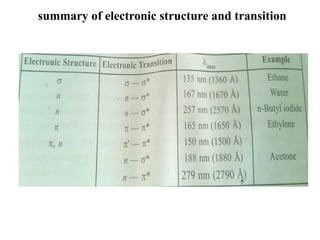
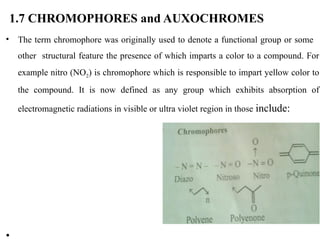
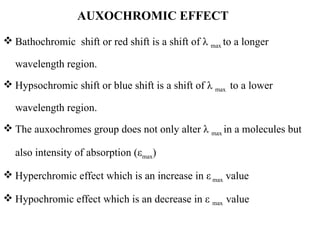
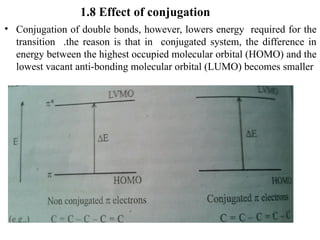
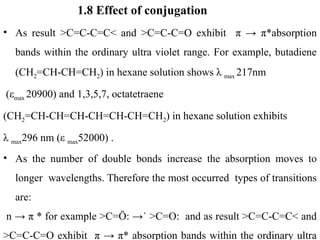
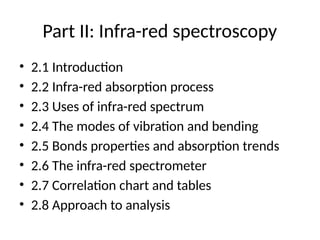
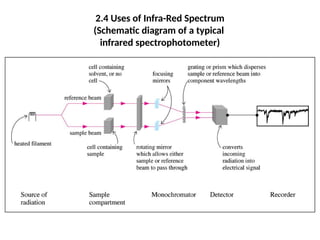
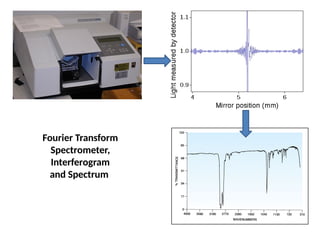
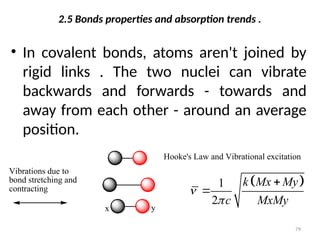
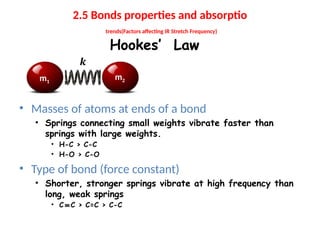
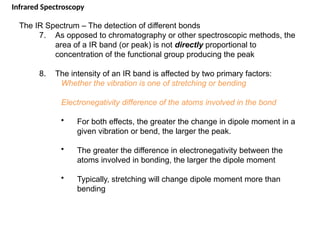
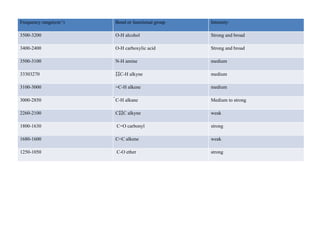
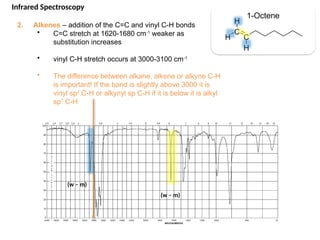
SPECTROMETRIC METHODS OF ANALYSIS (CHM 2365)
Y II BIOTECH and BIOCHEM)
BY SIBOMANA JEAN
BOSCO/LECTURER
SPECTROMETRIC METHODS OF ANALYSIS
(Learning objectives)
After completing this chapter, you should be able to:
 Understand how an organic molecule interacts with
electromagnetic radiation.
 Understand how different frequencies affect organic
molecules.
 Understand how spectroscopic measurements are taken.
 Explain frequency resolution vs time resolution.
 Have a brief introduction to each of the techniques to be
discussed in upcoming chapters.
 Understand what type of information each technique gives to
help with structure determination.
SPECTROMETRIC METHODS OF ANALYSIS
(Indicative Content)
• I: ULTRA-VIOLET SPECTROSCOPY
– The nature of electronic excitation
– The origin of U.V band structure
– Principle of absorption spectroscopy
– Presentation of the spectrum
– Types of electronic transitions
– Solvents
– Chromophore
– Effect of conjugation
– Alkanes
– Practical guide
SPECTROMETRIC METHODS OF ANALYSIS
(Indicative Content)
II: INFRA-RED SPECTROSCOPY
• 2.1 Introduction
• 2.2 Infra-red absorption process
• 2.3 Uses of infra-red spectrum
• 2.4 The modes of vibration and bending
• 2.5 Bonds properties and absorption trends
• 2.6 The infra-red spectrometer
• 2.7 Correlation chart and tables
• 2.8 Approach to analysis
SPECTROMETRIC METHODS OF ANALYSIS
(Indicative Content)
III: MASS SPECTROMETRY
• 3.1 The mass spectrometer
• 2.2 The mass spectrum
• 3.3 Molecular weight determination
• 3.4 Molecular formulas from isotope radio data
• 3.5 Some fragmentations
SPECTROMETRIC METHODS OF ANALYSIS
(Indicative Content)
IV: NUCLEAR MAGNETIC RESONANCE SPECTROSCOPY (NMR)
• 4.1 Introduction
• 4.2 Nuclear spin
• 4.3 Nuclear magnetic moments
• 4.4 Absorption of energy
• 4.5 The mechanism of absorption
• 4.6 The chemical shift and shielding
• 4.7 The nuclear magnetic resonance spectrometer
• 4.8 Chemical equivalence-Integral
• 4.9 Chemical environment and chemical shift
• 4.10 Local diamagnetic shielding
• 4.11 Spin-spin splitting (n+1) rule
SPECTROMETRIC METHODS OF ANALYSIS
A. General introduction
A1. Definition:
 Spectroscopy is the study of the absorption
and emission of light and other radiation by
matter.
 It involves the splitting of light (or more
precisely, electromagnetic radiation) into its
constituent wavelengths (a spectrum).
SPECTROMETRIC METHODS OF ANALYSIS
 Spectroscopy is used as a tool for studying the
structures of atoms and molecules.
 The large number of wavelengths emitted or absorbed
by these systems makes it possible to investigate their
structures in detail.
 This investigation may include the electron
configurations of ground and various excited states.
 In simple terms, it is a method for determining how
much light is absorbed by a chemical substance and
how much light passes through it at what intensity.
SPECTROMETRIC METHODS OF ANALYSIS
 Electronic energy, vibrational energy, rotational
energy, and translational energy are the different
forms of energies connected with molecules.
 Spectroscopic methods require less time and less
amount of sample than classical methods.
SPECTROSCOPIC METHODS OF ANALYSIS
A2 :Introduction: Index of hydrogen deficiency
 The index of hydrogen (IHD) is sometimes called the modes of unsaturation or
degrees of unsaturation.
 It is a measure of the number of ∏-bonds and/or rings a molecule contains.
 The IHD is determined from an examination of the molecular formula of unknown
substance.
 It is useful in structure determination.
 Briefly it provides information about how much hydrogen atoms are missing for
organic compound to be saturated.
 The Index of Hydrogen Deficiency (IHD), is a count of how many molecules of
H2 need to be added to a structure in order to obtain the corresponding saturated,
acyclic species.
 Hence the IHD takes a count of how many multiple bonds(pi) and rings are present
in the structure.
SPECTROSCOPIC METHODS OF ANALYSIS
(Index of hydrogen deficiency)
• For any organic compound with known molecular
formula, the index of hydrogen deficiency is determined
as follows:
(2c+2-h +n –x)/2
c: number of carbon atoms,
h:number of hydrogen atoms
n: number of nitrogen atoms or its members (P,…..
x: number of halogen atoms.
• The number of O atoms or its members (S ,…) are not considered in calculation of
IHD.
• Examples : Determine the index of hydrogen deficiency for the following compounds:
C8H7NO; C4H4BrNO2
•
SPECTROSCOPIC METHODS OF ANALYSIS
(Index of hydrogen deficiency)
Importance of IHD calculation:
 Index of hydrogen deficiency (IHD) can tell from the
molecular formula of organic compound whether
and how many multiple bonds and rings are involved.
 This will help cut down the possibilities one has to
consider in trying to come up with all the isomers of
a given chemical formula.
SPECTROSCOPIC METHODS OF ANALYSIS
(Index of hydrogen deficiency)
Exercises:
 Calculate the degrees of unsaturation, classify the
compound as saturated or unsaturated, and list
all the ring/pi bond combination possible for the
following molecular formulas:
(a.C9H20 (b.) C7H8 (c.) C5H7Cl (d.) C9H9NO4 (e.)C10H6N4
SPECTROSCOPIC METHODS OF ANALYSIS
(Index of hydrogen deficiency)
Calculate degrees of unsaturation (DoU) for the
following, and propose a structure for each:
a) C5H8
b) C4H4
c) C5H5N
d) C5H5NO2
e) C5H5Br
The following molecule is caffeine (C8H10N4O2),
determine the degrees of unsaturation (DoU).
Part I: UV-Visible Spectroscopy
• Ultraviolet-visible spectroscopy involves the
absorption of ultraviolet/visible light by a
molecule causing the promotion of an
electron from a ground electronic state to an
excited electronic state.
• Ultraviolet/Visible light:
wavelengths (l) between 200 and 800 nm
Part I: UV-Visible Spectroscopy
1.1. THE NATURE OF ELECTRONIC EXCITATIONS(cnt’d)
 When a continuous radiation passes through a transparent material, a
portion of the radiation may be absorbed.
 If it occurs, the residual radiation when it is passed through a prism will
yield a spectrum with gaps on it.
 This is called an absorption spectrum.
 As a result of energy absorption, atoms or molecules pass from a state
of low energy (the initial or ground state) to a state of higher energy (the
excited state).
 This excitation state is shown in figure below(on next slide).
 The electromagnetic radiation which is absorbed has energy which is
exactly equal to the energy difference between the excited and ground
states.
Part I:Ultraviolet spectroscopy
(Absorption & Emission)
Rapid process(10-15
s)
Part I:Ultraviolet spectroscopy
1.2 THE ORGIN OF UV BAND STRUCTURE
 For an atom which absorbs in the ultraviolet, the absorption spectrum often
consists of very sharp lines of absorption, as would be expected for a
quantized process occurring between two discrete energy levels.
 For molecules, however the UV absorption usually occurs over a wide range
of wavelength. This occurs because no molecules (as opposed to atoms) or
ally have many excited modes of vibrations and rotation at room
temperature.
 In fact the vibration of the molecules cannot be completely ‘’frozen out ‘’
even at absolute zero. As a consequence a collection of molecules will
generally have its members in many states of vibrational and rotational
excitations.
 The energy levels for these states are quite closely spaced, corresponding to
considerably smaller energy differences than the electronic levels.
Part I:Ultraviolet spectroscopy
(Electronic Transition)
1.2 (Ctnd) THE ORGIN OF UV BAND STRUCTURE
In all compounds other than alkanes, the electrons may
undergo several possible tansitions of different energies:
 n→ ∏* in carbonyl cpds (c=o);
 n → σ*
in oxygen,nitrogen,sulfur,and halogen cpds.
 ∏ → ∏* in alkenes, carbonyl cpds, alkynes, azo cpds
ect;
 σ→ ∏*in carbonyl cpds , alkenes , alkynes , ect..
 σ → σ*
in alkanes.
Part I:Ultraviolet spectroscopy
(The origin of the UV spectrum)
- What is observed from these types of
combined transitions is that the uv spectrum
of a molecule usually consists of a band of
absorption centered near the wavelength of
the major transition (see next diagram)
Fig. 14-13, p. 501
1.3 Principles of absorption spectroscopy
 The greater the number of molecules capable
of absorbing light of a given wavelength, the
greater will be the extent of light absorption.
 Furthermore, the more effective a molecule is
in absorbing of a given wavelength, the greater
will be the extent of light absorption.
 From these guiding ideas, the following
empirical formula, which is known as the Beer-
Lambert law may be formulated:
1.3 Principles of absorption spectroscopy
(The Beer-Lambert Law)
• The Beer-Lambert Law states that the absorbance of a solution is
directly proportional to the concentration of the absorbing species
in the solution and the path length. Thus, for a fixed path length,
UV/Vis spectroscopy can be used to determine the concentration
of the absorber in a solution
• The method is most often used in a quantitative way, using the
Beer-Lambert law; A= a.l.c
• Where A is absorbance (no units, since A = log10 P0 / P )
a is the molar absorbtivity with units of L mol-1
cm-1
L is, the path length of the cuvette in which the sample is
contained. We will express this measurement in
centimeters (cm). L is often replaced with the symbol “b”.
C is the concentration of the compound in solution,
expressed in mol L-1
.
The diagram below shows a beam of monochromatic
radiation of radiant power P0, directed at a sample solution.
Absorption takes place and the beam of radiation leaving
the sample has radiant power P .
P
The amount of radiation absorbed may be measured in a number of
ways:
Transmittance, T = P / P0
% Transmittance, %T = 100 T
Absorbance,
A = log10 P0 / P
A = log10 1 / T
A = log10 100 / %T .The last equation,
A = 2 - log10 %T, is worth remembering because it allows you to easily
calculate absorbance from percentage transmittance data.
.
1.3 Principle of absorption spectroscopy
(INSTRUMENTATION)
• The instrument used in ultraviolet-visible spectroscopy is called a UV/Vis
spectrophotometer.
• It measures the intensity of light passing through a sample (P), and compares it to
the intensity of light before it passes through the sample (P0).
• The ratio P/P0 is called the transmittance.
• The UV-visible spectrophotometer can also be configured to measure reflectance.
In this case, the spectrophotometer measures the intensity of light reflected from a
sample (l ), and compares it to the intensity of light reflected from a reference
material (lo ) (such as a white tile).
• The ratio is called the reflectance, and is usually expressed as a percentage (%R).
1.3 Principle of absorption spectroscopy
(INSTRUMENTATION)
 BASIC PARTS OF SPECTROPHOTOMETER
• Light source which are deuterium arc lamp (200 - 400 nm) and
tungsten filament lamp (400-800 nm)
• Diffraction grating in monochromator which separate different
wavelengths of light
• A holder of sample (cuvette) transparent glass container
• Detector which should be a photomultiplier tube or photodiode
• A signal indicator (signal processor and read out)
A spectrophotometer can be either single beam or double beam
Single beam spectrometer
• Single beam photo, the light incandescent source(s) passes through
the collimating lens (L) and then through adjustable diagram (D) by
adjusting the intensity of incident radiation can be altered to any
required level (Achieved by introducing rheostat in the circuit of
sources). The is then incident on filter which permits only a narrow
band of wavelength to pass through cuvette (c) which contain
solution.
UV-Vis Spectrophotometer (simplified
diagram)
Part I: U.V Spectroscopy
 4.1 Presentation of the U.V spectrum
• It is customary to present electronic spectra in graphical form,
with either ϵ or logϵ plotted in the coordinate and wavelength
on the abscissa. In some cases the absorbance or optical
density is indicated in the ordinate . An example of spectrum
is shown on next slide.
Copyright © Houghton Mifflin Company.All rights reserved. 12a–35
O
p
• In a double-beam instrument, the light is split into two beams before it
reaches the sample.
• One beam is used as the reference; the other beam passes through the
sample.
• The reference beam intensity is taken as 100% Transmission (or 0
Absorbance), and the measurement displayed is the ratio of the two beam
intensities.
• Some double-beam instruments have two detectors (photodiodes), the
sample and reference beam are measured at the same time.
• In other instruments, the two beams pass through a beam chopper, which
blocks one beam at a time.
• The detector alternates between measuring the sample beam and the
reference beam in cycle. In this case, the measured beam intensities may be
corrected by subtracting the intensity measured in the dark interval before
the ratio is taken.
• Spectrophotometer measures the wavelength of maximum absorption of
light and the intensity of absorption.
Advantages of double beam instrument
• They are more stable than single beam instruments
• It makes possible direct one step comparison of a sample in one path
with standard blank solution in the other
1.5 Types of electronic transitions
• Molecules containing π-electrons or non-bonding electrons (n-electrons) can
absorb the energy in the form of ultraviolet or visible light to excite these
electrons to higher anti-bonding molecular orbitals .The more easily excited
the electrons (i.e. lower energy gap between the HOMO and the LUMO), the
longer the wavelength of light it can absorb.
• The amount of radiation actually absorbed depends on the structure of the
compound as well as wavelength of radiation .measurement of light absorbed
at each wavelength give structure of compound
TYPES OF ELECTRONIC TRANSITIONS
• According to the molecular orbital theory when a molecule is excited by the absorption of energy
(UV or visible light) its electrons are promoted from bonding to anti-bonding orbital
 When Sigma (σ) electron gets promoted to anti-bonding sigma orbital(σ*).it is represented as
σ →σ* transition
 When a non bonding electron(n) gets promoted to anti-bonding sigma orbital(σ*).it is represented
as n →σ* transition
 Similarly π→ π* transition represents the promotion of π-electrons to
anti-bonding π* orbital
 Similarly when an n-electron is promoted to anti-bonding π*orbital it
represents n→ π* transition.
σ→ σ*> n→ σ* > π→ π*> n→ π*
40
UV-Vis. Spectra (200 - 700 nm)
× σ  σ *
< 150 nm
× n  σ *
150 - 250 nm
√ n  π*
200 - 700 nm
√ π  π*
200 - 700 nm
σ→σ* Transitions
•These transition can occur in such compounds in which all the electrons
are involved in single bonds and there are no lone pair of electrons. An
electron in a bonding s orbital is excited to the corresponding anti-
bonding orbital. The energy required is large. Examples saturated
hydrocarbons like, methane (which has only C-H bonds, and can only
undergo s s*
transitions) shows an absorbance maximum at 125 nm.
Absorption maxima due to s s*
transitions are not seen in typical UV-
Vis. Spectra (200 - 800 nm) and the absorption band occur in the far
ultra violet region (126-135 nm). Since the commercial
spectrophotometer do not operate in at wavelength less than
180- 200 nm, σ→σ*transitions is not normally observed
N →σ*
transitions
• Saturated compounds containing atoms with lone pairs (non-bonding
electrons) are capable of n s*
transitions. These transitions usually need less
energy than s s *
transitions.
• They can be initiated by light whose wavelength is in the range 150 - 250 nm.
• The number of organic functional groups with n s*
peaks in the UV region is
small. However some compounds which absorb at slightly longer wavelength
are known. For example (CH3)3N, has λ max =227 nm for n→σ* and
λmax=99 nm for σ→ σ* transition. the commonly used solvent are aliphatic
alcohols and alkyl halides because their absorption range starts only at 260 nm
when absorption measurement are made in ultra violet region.
n→π*
transition
• These types of transitions are shown by unsaturated molecules which
contain atoms such as O ,N ,and sulphur .transition show a weak band in
their absorption spectrum. In aldehydes and ketones (having no C=C
bond) the band due to the n→ π* transition occurs in range 270-300 nm.
On the other hand carbonyl compounds having double bonds separated
by two or more single bonds exhibit the bands due to the n→ π*
transitions in range 300-350 nm
π→π*
Transition
• These transition corresponds to the promotion of an electron from a bonding
π orbital to anti-bonding π* orbital. This transition can be occurred in any
molecules having a π-electron system. in certain olefins ,cis and trans
isomers are possible .the trans isomers absorbs at the longer wavelength with
the greater intensity than the cis isomer.
• This difference increase as length of conjugated system increases for
example , the ultra violet absorption spectrum of benzene exhibits three
bands two intense bands at 180-200 nm and weak band at 260 nm.
summary of electronic structure and transition
Choice of solvents
The choice of solvent to be used in uv spectroscopy is quite important.
 The first criterion for a good solvent is that t should not absorb uv radiation
in the same region as the substance whose spectrum is being determined.
Usually solvents which do not contain conjugated systems are most suitable
for this purpose.
 A second criterion which must be considered is the effect of a solvent on
the fine structure of an absorption band. In a polar solvent, the hydrogen
bonding forms a solute-solvent complex and the fine structure may
disappear.
 A third property of a solvent is the ability of a solvent to influence the
wavelength of uv light which will be absorbed. Ex: water, methanol,
ethanol, chloroform and hexane have different effect on absorption of
radiation.
1.7 CHROMOPHORES and AUXOCHROMES
• The term chromophore was originally used to denote a functional group or some
other structural feature the presence of which imparts a color to a compound. For
example nitro (NO2) is chromophore which is responsible to impart yellow color to
the compound. It is now defined as any group which exhibits absorption of
electromagnetic radiations in visible or ultra violet region in those include:
•
1.7 (cntd) Chromophores
(Typical absorptions of simple isolated chromophores)
Class Transtion λmax(nm) logϵ
ROH : n → σ*
180 2.5
R-O-R: n → σ*
180 3.5
RNH2: n → σ*
190 3.5
RSH: n → σ*
210 3.0
R2C=CR2: ∏ → ∏* 175 3.0
R-C≡C-R: ∏ → ∏* 170 3.0
R-C ≡N:n → ∏* 160 ˃1.0
R-N=N-R: n → ∏* 340 ˃1.0
1.7 (cntd) Chromophores
(Typical absorptions of simple isolated chromophores)
Class Transtion λmax(nm) logϵ
RNO2 : n → ∏*
271 ˃ 1.0
R-CHO: ∏ → ∏*
190 2.0
n → ∏*
290 1.0
R2CO: ∏→ ∏* 180 3.0
n → ∏* 280
1.5
RCOOH: n → ∏* 205 1.5
RCOOR: n → ∏* 205 1.5
RCONH2:n → ∏* 210 1.5
It may or may not impart color to the compound.
As auxochrome is group which itself does not act as a chromophore but
when attached to a chromophore shifts the absorption maximum
towards longer wavelength with an increase in the intensity of
absorption. For example –OH,-NH2 ,-OR ,-NHR and NR2 .since the
auxochrome –NH2 group is attached to benzene ring the absorption
changes from λ max 255 (ε max203) to λ max280 (ε max1430) the effect of
auxochrome is caused by the presence of non-bonding electrons that
can be shared to chromophore
AUXOCHROMIC EFFECT
 Bathochromic shift or red shift is a shift of λ max to a longer
wavelength region.
 Hypsochromic shift or blue shift is a shift of λ max to a lower
wavelength region.
 The auxochromes group does not only alter λ max in a molecules but
also intensity of absorption (εmax)
 Hyperchromic effect which is an increase in ε max value
 Hypochromic effect which is an decrease in ε max value
1.8 Effect of conjugation
• Conjugation of double bonds, however, lowers energy required for the
transition .the reason is that in conjugated system, the difference in
energy between the highest occupied molecular orbital (HOMO) and the
lowest vacant anti-bonding molecular orbital (LUMO) becomes smaller
1.8 Effect of conjugation
• As result >C=C-C=C< and >C=C-C=O exhibit π → π*absorption
bands within the ordinary ultra violet range. For example, butadiene
(CH2=CH-CH=CH2) in hexane solution shows λ max 217nm
(εmax 20900) and 1,3,5,7, octatetraene
(CH2=CH-CH=CH-CH=CH-CH=CH2) in hexane solution exhibits
λ max296 nm (ε max52000) .
• As the number of double bonds increase the absorption moves to
longer wavelengths. Therefore the most occurred types of transitions
are:
n → π * for example >C=Ö: →˙ >C=O: and as result >C=C-C=C< and
>C=C-C=O exhibit π → π* absorption bands within the ordinary ultra
1) UV spectrum is formed when substances absorb radiation in range of 200-800nm.
2) Absorption of light in UV region leads to electronic transition in molecules.
3) Near UV region (200-380 nm) is useful in analytical chemistry, especially in
predicting the number of conjugated double bonds, aromatic conjugation,
conjugation of α, β-unsaturated carbonyl compounds
4) Wavelength corresponds to maximum absorption of light is called λ max and the
corresponding intensity of absorption is known as absorptivity ε
5) Only slightly different energies. Thus radiation of large number of wavelength
which are quite close together are absorbed leading to band spectrum.
6) According to MO theory, absorption of light in UV region causes four transition
σ → σ*, n → σ*, n→ π*and π→ π*
Summary
7) n→ π* transition is seen in compound containing lone pair of electrons
(e.g, carbonyl compounds)
8) π→ π*transition is shown by compounds containing unsaturated centres
(alkenes and alkynes)
9) Chromophores are groups that can absorb electromagnetic radiation in
visible or UV region
10) Auxochrome is a group that when attached to a chromophore shifts the λ
max towards larger wavelength region
11) Groups which increase the λ max value are said to cause red shift or
bathochromic shift
12) Groups which shift λ max to lower wavelength region are said to cause
blue shift or hypsochromic shift
13) An auxochrome group increases the λ max value by extending the
conjugation of chromophore group using its non-bonded electrons this
extended conjugated results in the formation of new chromophore, which
has higher
λ max value
APPLICATIONS
• The most important uses of UV-Visible spectroscopy in analytical
chemistry is the determination of atomic and molecular structure
including functional group and stereochemical arrangement by
measurement of radiant energy absorbed or emitted by substance in
any of the wavelength of electromagnetic spectrum in response to
excitation by external energy source It may be noted that transitions to
anti-bonding π* orbitals are associated only with unsaturated centres
in the molecules.
EXERCISES
1) Express A=1.0 in terms of percent transmittance (%T), the unit
usually used in IR spectroscopy (and sometimes in UV –visible as
well.
2) The literature value of ε for 1,3-pentadiene in hexane is
26000 mol l-1
cm-1 at
its maximum absorbance at 224 nm.
You prepare
a sample and take a UV spectrum, finding that A 244=0.850 what is
the concentration of your sample
3) Describe the various types of electronic transitions observed in
organic compounds when exposed to UV and visible light
4) The UV spectrum of acetone shows two important peaks at λmax
279nm (εmax 15) and λmax 198 nm (εmax 900) identify the
electronic transition for each peak
5) Explain how you will distinguish between acetone and but-3-en-2-one
with UV spectroscopy
Copyright © Houghton Mifflin Company.All
rights reserved.
12a–57
6.What compound would absorb the longest wavelength ultraviolet light?
A
B
C D
7. Which absorbs at the lowest wavelength?
U.V SPECTROSCOPY
Question 7
Question 8: UV-visible spectrum of 4-nitroanaline
Solvent: Ethanol
Concentration: 15.4 mg L-1
Pathlength: 1 cm
NH2
NO2
Molecular mass = 138
Question 8 (cntd) UV-visible spectrum of 4-
nitroanaline
1. Determine the absorption maxima (lmax) and absorption intensities
(A) from the spectrum:
lmax = 227 nm, A227 = 1.55 lmax = 375 nm, A375 = 1.75
2. Calculate the concentration of the compound:
(1.54 x 10⁻²
g L-1
)/(138 g/mol) = 1.12 x 10⁻⁴
mol L-1
3. Determine the molar absorptivity coefficients (e) from the Beer-
Lambert Law: e = A/cℓ
e227 = 1.55/(1.0 cm x 1.12 x 10-4
mol L-1
) = 13,900 mol-1
L cm-1
e375 = 1.75/(1.0 cm x 1.12 x 10-4
mol L-1
) = 15,700 mol-1
L cm-1
Part II: Infra-red spectroscopy
• 2.1 Introduction
• 2.2 Infra-red absorption process
• 2.3 Uses of infra-red spectrum
• 2.4 The modes of vibration and bending
• 2.5 Bonds properties and absorption trends
• 2.6 The infra-red spectrometer
• 2.7 Correlation chart and tables
• 2.8 Approach to analysis
2.1 INTRODUCTION
• IR spectroscopy is one of the most common
spectroscopic techniques used by organic and
inorganic chemists.
• Simply, it is the absorption measurement of
different IR frequencies by a sample positioned
in the path of an IR beam.
• The main goal of IR spectroscopic analysis is to
determine the chemical functional groups in
the sample: Different functional groups absorb
characteristic frequencies of IR radiation.
65
Part II: Infra –Red Spectroscopy
2.1 Introduction(cntd)
• IR absorption information is generally presented in the
form of a spectrum with wavelength or wavenumber as
the x-axis and absorption intensity or percent
transmittance as the y-axis
• The IR region is commonly divided into three smaller
areas: near IR, mid IR, and far IR.
66
near IR mid IR/cm–1
and far
Wavenumber/cm–1
13,000–4,000 4,000–200 200–10
Wavelength/μm
0.78–2.5 2.5–50 50–1,000
67
Example of Infrared
spectrum
68
2.2 IR Absorption Process
• We know that visible light is made up of a
continuous range of different electromagnetic
frequencies - each frequency can be seen as a
different color.
• Infra-Red radiation also consists of a
continuous range of frequencies.
69
2.2 IR Absorption Process
• If you shine a range of infra-red frequencies
one at a time through a sample, you find that
some frequencies get absorbed by the
compound. A detector on the other side of the
compound would show that some frequencies
pass through the compound with almost no
loss, but other frequencies are strongly
absorbed.
70
2.2 IR Absorption Process
• How much of a particular frequency gets through
the compound is measured as percentage
transmittance.
• A percentage transmittance of 100 would mean
that all of that frequency passed straight through
the compound without any being absorbed. In
practice, that never happens - there is always
some small loss, giving a transmittance of
perhaps 95% as the best you can achieve.
71
2.2 IR Absorption Process
• A transmittance of only 5% would mean that
nearly all of that particular frequency is
absorbed by the compound. A very high
absorption of this sort tells you important
things about the bonds in the compound.
72
2.2 Infra-Red Absorption Process
• Each frequency of light (including Infra-Red)
has a certain energy. If a particular frequency
is being absorbed as it passes through the
compound being investigated, it must mean
that its energy is being transferred to the
compound.
• Energies in Infra-Red radiation correspond to
the energies involved in bond vibrations.
73
Infrared Spectrometer
0
IR Spectroscopy
2.3 The modes of bonds vibration in IRThere are two types of bond vibration:
• Stretch – Vibration or oscillation along the line of the bond
• Bend – Vibration or oscillation not along the line of the bond
H
H
C
H
H
C
scissor
asymmetric
H
H
C
C
H
H
C
C
H
H
C
C
H
H
C
C
symmetric
rock twist wag
in plane out of plane
2.4 Uses of Infra-Red Spectrum
• Each frequency of light (including Infra-Red)
has a certain energy. If a particular frequency
is being absorbed as it passes through the
compound being investigated, it must mean
that its energy is being transferred to the
compound.
• Energies in Infra-Red radiation correspond to
the energies involved in bond vibrations.
76
2.4 Uses of Infra-Red Spectrum
(Schematic diagram of a typical
infrared spectrophotometer)
Fourier Transform
Spectrometer,
Interferogram
and Spectrum
2.5 Bonds properties and absorption trends .
• In covalent bonds, atoms aren't joined by
rigid links . The two nuclei can vibrate
backwards and forwards - towards and
away from each other - around an average
position.
 
1
2
k Mx My
c MxMy




Hooke's Law and Vibrational excitation
Vibrations due to
bond stretching and
contracting
y
x
79
2.5 Bonds properties and absorptio
trends(Factors affecting IR Stretch Frequency)
• Masses of atoms at ends of a bond
• Springs connecting small weights vibrate faster than
springs with large weights.
• H-C > C-C
• H-O > C-O
• Type of bond (force constant)
• Shorter, stronger springs vibrate at high frequency than
long, weak springs
• C≡C > C=C > C-C
Hookes’ Law
m2
m1
Fig. 10.15, p. 383
2.5 Bonds properties and absorption trends
Low Energy
High Energy
E = h
hc

=
1. Each stretching and bending vibration occurs with a characteristic frequency as
the atoms and charges involved are different for different bonds
The y-axis on an IR
spectrum is in units of %
transmittance
In regions where the EM
field of an osc. bond
interacts with IR light of
the same n –
transmittance is low (light
is absorbed)
In regions where
no osc. bond is
interacting with IR
light, transmittance
nears 100%
2.6 Absorption bands and frequencies of chemical bonds and
transmittance
IR Spectroscopy
The IR Spectrum
The x-axis of the IR spectrum is in units of wavenumbers, n, which is the number of waves
per centimeter in units of cm-1
(Remember E = hn or E = hc/l)
IR Spectroscopy
The IR Spectrum
3. This unit is used rather than wavelength (microns) because wave numbers
are directly proportional to the energy of transition being observed –
chemists like this, physicists hate it
High frequencies and high wave numbers equate higher energy
is quicker to understand than
Short wavelengths equate higher energy
4. This unit is used rather than frequency as the numbers are more “real” than
the exponential units of frequency
5. IR spectra are observed for the mid-infrared: 600-4000 cm-1
6. The peaks are Gaussian distributions of the average energy of a transition
IR Spectroscopy
The IR Spectrum
7. In general:
Lighter atoms will allow the oscillation to be faster – higher energy
This is especially true of bonds to hydrogen – C-H, N-H and O-H
Stronger bonds will have higher energy oscillations
Triple bonds > double bonds > single bonds in energy
Energy/n of oscillation
The IR Spectrum – The detection of different bonds
7. As opposed to chromatography or other spectroscopic methods, the
area of a IR band (or peak) is not directly proportional to
concentration of the functional group producing the peak
8. The intensity of an IR band is affected by two primary factors:
Whether the vibration is one of stretching or bending
Electronegativity difference of the atoms involved in the bond
• For both effects, the greater the change in dipole moment in a
given vibration or bend, the larger the peak.
• The greater the difference in electronegativity between the
atoms involved in bonding, the larger the dipole moment
• Typically, stretching will change dipole moment more than
bending
Infrared Spectroscopy
The IR Spectrum – The detection of different bonds
9. It is important to make note of peak intensities to show the effect of
these factors:
• Strong (s) – peak is tall, transmittance is low (0-35 %)
• Medium (m) – peak is mid-height (75-35%)
• Weak (w) – peak is short, transmittance is high (90-75%)
• * Broad (br) – if the Gaussian distribution is abnormally broad
(*this is more for describing a bond that spans many energies)
Exact transmittance values are rarely recorded
Infrared Spectroscopy
Characteristic IR absorptions of selelected functional groups
Frequency range(cm-1
) Bond or functional group Intensity
3500-3200 O-H alcohol Strong and broad
3400-2400 O-H carboxylic acid Strong and broad
3500-3100 N-H amine medium
33303270 C-H alkyne medium
3100-3000 =C-H alkene medium
3000-2850 C-H alkane Medium to strong
2260-2100 CC alkyne weak
1800-1630 C=O carbonyl strong
1680-1600 C=C alkene weak
1250-1050 C-O ether strong
II. Infrared Group Analysis
A. General
1. The primary use of the IR is to detect functional groups
2. Because the IR looks at the interaction of the EM spectrum with
actual bonds, it provides a unique qualitative probe into the
functionality of a molecule, as functional groups are merely different
configurations of different types of bonds
3. Since most “types” of bonds in covalent molecules have roughly the
same energy, i.e., C=C and C=O bonds, C-H and N-H bonds they
show up in similar regions of the IR spectrum
4. Remember all organic functional groups are made of multiple bonds
and therefore show up as multiple IR bands (peaks)
Infrared Spectroscopy
II. Infrared Group Analysis
A. General
5. The four primary regions of the IR spectrum
4000 cm-1
2700 cm-1
2000 cm-1
1600 cm-1
600 cm-1
O-H
N-H
C-H
C≡C
C≡N
C=O
C=N
C=C
Fingerprint
Region
C-C
C-N
C-O
Infrared Spectroscopy
Bonds to H Triple bonds Double bonds Single Bonds
1. Alkanes – combination of C-C and C-H bonds
• C-C stretches and bends 1360-1470 cm-1
• CH2-CH2 bond 1450-1470 cm-1
• CH2-CH3 bond 1360-1390 cm-1
• sp3
C-H between 2800-3000 cm-1
Infrared Spectroscopy
Octane
C
H
H
H
(w – s) (m)
2. Alkenes – addition of the C=C and vinyl C-H bonds
• C=C stretch at 1620-1680 cm-1
weaker as
substitution increases
• vinyl C-H stretch occurs at 3000-3100 cm-1
• The difference between alkane, alkene or alkyne C-H
is important! If the band is slightly above 3000 it is
vinyl sp2
C-H or alkynyl sp C-H if it is below it is alkyl
sp3
C-H
1-Octene
Infrared Spectroscopy
C
C
H
H
H
(w – m)
(w – m)
3. Alkynes – addition of the C=C and vinyl C-H bonds
• C≡C stretch 2100-2260 cm-1
; strength depends on
asymmetry of bond, strongest for terminal alkynes,
weakest for symmetrical internal alkynes
• C-H for terminal alkynes occurs at 3200-3300 cm-1
• Internal alkynes ( R-C≡C-R ) would not have this band!
1-Octyne
Infrared Spectroscopy
C C
H
(m – s)
(w-m)
4. Aromatics
• Due to the delocalization of e-
in the ring, C-C bond
order is 1.5, the stretching frequency for these
bonds is slightly lower in energy than normal C=C
• These show up as a pair of sharp bands, 1500 &
1600 cm-1
, (lower frequency band is stronger)
• C-H bonds off the ring show up similar to vinyl C-H
at 3000-3100 cm-1
Ethyl benzene
Infrared Spectroscopy
H
(w – m) (w – m)
4. Aromatics
• If the region between 1667-2000 cm-1
(w) is free of interference (C=O stretching
frequency is in this region) a weak grouping of peaks is observed for aromatic
systems
• Analysis of this region, called the overtone of bending region, can lead to a
determination of the substitution pattern on the aromatic ring
Monosubstituted
1,2 disubstituted (ortho or o-)
1,2 disubstituted (meta or m-)
1,4 disubstituted (para or p-)
G
G
G
G
G
G
G
Infrared Spectroscopy
5. Unsaturated Systems – substitution patterns
• The substitution of aromatics and alkenes can also be discerned through the out-
of-plane bending vibration region
• However, other peaks often are apparent in this region. These peaks should only
be used for reinforcement of what is known or for hypothesizing as to the functional
pattern.
R
C
H
C
R
C
H
CH2
R
C
H
C
R
C
R
CH2
R
C
R
C
R
H
R
H
R
H
985-997
905-915
cm-1
960-980
665-730
885-895
790-840
R
R
R
R
R
R
R
cm-1
730-770
690-710
735-770
860-900
750-810
680-725
800-860
Infrared Spectroscopy
6. Ethers – addition of the C-O-C asymmetric band and
vinyl C-H bonds
• Show a strong band for the antisymmetric C-O-C
stretch at 1050-1150 cm-1
• Otherwise, dominated by the hydrocarbon
component of the rest of the molecule
Diisopropyl ether
Infrared Spectroscopy
O
(s)
7. Alcohols
• Strong, broad O-H stretch from 3200-3400 cm-1
• Like ethers, C-O stretch from 1050-1260 cm-1
• Band position changes depending on the alcohols
substitution: 1° 1075-1000; 2° 1075-1150; 3° 1100-1200;
phenol 1180-1260
• The shape is due to the presence of hydrogen bonding
1-butanol
Infrared Spectroscopy
O
H
(m– s)
br
(s)
8. Amines - Primary
• Shows the –N-H stretch for NH2 as a doublet
between 3200-3500 cm-1
(symmetric and anti-
symmetric modes)
• -NH2 has deformation band from 1590-1650 cm-1
• Additionally there is a “wag” band at 780-820 cm-1
that is not diagnostic
2-aminopentane
Infrared Spectroscopy
N
H H
(w) (w)
9. Amines – Secondary
• N-H band for R2N-H occurs at 3200-3500 cm-1
as a single sharp peak weaker than –O-H
• Tertiary amines (R3N) have no N-H bond and
will not have a band in this region
pyrrolidine
Infrared Spectroscopy
N H
(w – m)
Infrared Spectroscopy
Pause and Review
• Inspect the bonds to H region (2700 – 4000 cm-1
)
• Peaks from 2850-3000 are simply sp3
C-H in most organic molecules
• Above 3000 cm-1
Learn shapes, not wavenumbers!:
Broad U-shape peak
-O—H bond
V-shape peak
-N—H bond for 2o
amine (R2N—H)
Sharp spike
-C≡C—H bond
W-shape peak
-N—H bond for 1o
amine (RNH2)
3000 cm-1
Small peak shouldered
just above 3000 cm-1
C=C—H or Ph—H
10. Aldehydes
• C=O (carbonyl) stretch from 1720-1740 cm-1
• Band is sensitive to conjugation, as are all
carbonyls (upcoming slide)
• A highly unique sp2
C-H stretch appears as a
doublet, 2720 & 2820 cm-1
called a “Fermi doublet”
Cyclohexyl carboxaldehyde
Infrared Spectroscopy
C
H
O
(w-m)
(s)
11. Ketones
• Simplest of the carbonyl compounds as far as IR
spectrum – carbonyl only
• C=O stretch occurs at 1705-1725 cm-1
3-methyl-2-pentanone
Infrared Spectroscopy
O
(s)
12. Esters
• C=O stretch at 1735-1750 cm-1
• Strong band for C-O at a higher frequency than
ethers or alcohols at 1150-1250 cm-1
Infrared Spectroscopy
Ethyl pivalate
O
O
(s)
(s)
13. Carboxylic Acids:
• Gives the messiest of IR spectra
• C=O band occurs between 1700-1725 cm-1
• The highly dissociated O-H bond has a broad band from 2400-
3500 cm-1
covering up to half the IR spectrum in some cases
4-phenylbutyric acid
Infrared Spectroscopy
C
O
O
H
(w – m)
br
(s) (s)
14. Acid anhydrides
• Coupling of the anhydride though the ether oxygen
splits the carbonyl band into two with a separation
of 70 cm-1
• Bands are at 1740-1770 cm-1 and 1810-1840 cm-1
• Mixed mode C-O stretch at 1000-1100 cm-1
Propionic anhydride
Infrared Spectroscopy
O
O O
(s) (s)
15. Acid halides
• Clefted band at 1770-1820 cm-1
for C=O
• Bonds to halogens, due to their size (see Hooke’s
Law derivation) occur at low frequencies, only Cl is
light enough to have a band on IR, C-Cl is at 600-
800 cm-1
Propionyl chloride
Cl
O
Infrared Spectroscopy
(s)
(s)
16. Amides
• Display features of amines and carbonyl compounds
• C=O stretch at 1640-1680 cm-1
• If the amide is primary (-NH2) the N-H stretch occurs
from 3200-3500 cm-1
as a doublet
• If the amide is secondary (-NHR) the N-H stretch
occurs at 3200-3500 cm-1
as a sharp singlet
pivalamide
NH2
O
Infrared Spectroscopy
(m – s) (s)
17. Nitro group (-NO2)
• Proper Lewis structure gives a bond order of 1.5
from nitrogen to each oxygen
• Two bands are seen (symmetric and asymmetric) at
1300-1380 cm-1
and 1500-1570 cm-1
• This group is a strong resonance withdrawing group
and is itself vulnerable to resonance effects
2-nitropropane
N
O
O
Infrared Spectroscopy
(s) (s)
18. Nitriles (the cyano- or –C≡N group)
• Principle group is the carbon nitrogen triple
bond at 2100-2280 cm-1
• This peak is usually much more intense than
that of the alkyne due to the electronegativity
difference between carbon and nitrogen
propionitrile
N
C
Infrared Spectroscopy
(s)
Effects on IR bands
1. Conjugation – by resonance, conjugation lowers the energy of a double or triple
bond. The effect of this is readily observed in the IR spectrum:
• Conjugation will lower the observed IR band for a carbonyl from 20-40 cm-1
provided conjugation gives a strong resonance contributor
O
O
1684 cm-1
1715 cm-1
C=O C=O
C
H3C
O
X X = NH2 CH3 Cl NO2
1677 1687 1692 1700 cm-1
H2N C CH3
O
Strong resonance contributor
vs.
N
O
O
C
CH3
O
Poor resonance contributor
(cannot resonate with C=O)
Infrared Spectroscopy
Effects on IR bands
2. Steric effects – usually not important in IR spectroscopy, unless they reduce the
strength of a bond (usually p) by interfering with proper orbital overlap:
• Here the methyl group in the structure at the right causes the carbonyl
group to be slightly out of plane, interfering with resonance
3. Strain effects – changes in bond angle forced by the constraints of a ring will
cause a slight change in hybridization, and therefore, bond strength
• As bond angle decreases, carbon becomes more electronegative, as well
as less sp2
hybridized (bond angle < 120°)
O
C=O: 1686 cm-1
O
C=O: 1693 cm-1
CH3
O O O O O
1815 cm-1
1775 cm-1
1750 cm-1
1715 cm-1
1705 cm-1
Infrared Spectroscopy
Effects on IR bands
4. Hydrogen bonding
• Hydrogen bonding causes a broadening in the band due to the creation of
a continuum of bond energies associated with it
• In the solution phase these effects are readily apparent; in the gas phase
where these effects disappear or in lieu of steric effects, the band appears
as sharp as all other IR bands:
Gas phase spectrum of
1-butanol
Steric hindrance to H-bonding
in a di-tert-butylphenol
• H-bonding can interact with other functional groups to lower frequencies
OH
C=O; 1701 cm-1
O
O
H
Infrared Spectroscopy
Interpreting infrared spectra
• Calculate the index of hydrogen deficiency of each compound:
C5H9N3 (histamine);C20H24N2O2(quinine); C10H14N2(nicotine); C21H28O5,
(cortisone) C21H22N2O2 (strychnine)
• Compound C, with the molecular formula C4H6 reacts with Hydrogen
and nickel to give compound D with the molecular formula C4H10.
Compound C, however, shows no absorption above 3000cm-1
in its
spectrum, Suggest structures for compounds C and D
• Show how IR spectroscopy can be used to distinguish between the
compounds in each of the following pairs: 1-pentyne and 2-
pentyne ; 1-pentene and 1-pentyne;pentanoic acid and 1-pentanol;
pentane and 1-pentene;1-pentanol and pentanal; pentanoic acid
and 2-pentanone.

SPECTROSCOPIC METHODS ANALYSIS ppt.pptx

  • 1.
    SPECTROMETRIC METHODS OFANALYSIS (CHM 2365) Y II BIOTECH and BIOCHEM) BY SIBOMANA JEAN BOSCO/LECTURER
  • 2.
    SPECTROMETRIC METHODS OFANALYSIS (Learning objectives) After completing this chapter, you should be able to:  Understand how an organic molecule interacts with electromagnetic radiation.  Understand how different frequencies affect organic molecules.  Understand how spectroscopic measurements are taken.  Explain frequency resolution vs time resolution.  Have a brief introduction to each of the techniques to be discussed in upcoming chapters.  Understand what type of information each technique gives to help with structure determination.
  • 3.
    SPECTROMETRIC METHODS OFANALYSIS (Indicative Content) • I: ULTRA-VIOLET SPECTROSCOPY – The nature of electronic excitation – The origin of U.V band structure – Principle of absorption spectroscopy – Presentation of the spectrum – Types of electronic transitions – Solvents – Chromophore – Effect of conjugation – Alkanes – Practical guide
  • 4.
    SPECTROMETRIC METHODS OFANALYSIS (Indicative Content) II: INFRA-RED SPECTROSCOPY • 2.1 Introduction • 2.2 Infra-red absorption process • 2.3 Uses of infra-red spectrum • 2.4 The modes of vibration and bending • 2.5 Bonds properties and absorption trends • 2.6 The infra-red spectrometer • 2.7 Correlation chart and tables • 2.8 Approach to analysis
  • 5.
    SPECTROMETRIC METHODS OFANALYSIS (Indicative Content) III: MASS SPECTROMETRY • 3.1 The mass spectrometer • 2.2 The mass spectrum • 3.3 Molecular weight determination • 3.4 Molecular formulas from isotope radio data • 3.5 Some fragmentations
  • 6.
    SPECTROMETRIC METHODS OFANALYSIS (Indicative Content) IV: NUCLEAR MAGNETIC RESONANCE SPECTROSCOPY (NMR) • 4.1 Introduction • 4.2 Nuclear spin • 4.3 Nuclear magnetic moments • 4.4 Absorption of energy • 4.5 The mechanism of absorption • 4.6 The chemical shift and shielding • 4.7 The nuclear magnetic resonance spectrometer • 4.8 Chemical equivalence-Integral • 4.9 Chemical environment and chemical shift • 4.10 Local diamagnetic shielding • 4.11 Spin-spin splitting (n+1) rule
  • 7.
    SPECTROMETRIC METHODS OFANALYSIS A. General introduction A1. Definition:  Spectroscopy is the study of the absorption and emission of light and other radiation by matter.  It involves the splitting of light (or more precisely, electromagnetic radiation) into its constituent wavelengths (a spectrum).
  • 8.
    SPECTROMETRIC METHODS OFANALYSIS  Spectroscopy is used as a tool for studying the structures of atoms and molecules.  The large number of wavelengths emitted or absorbed by these systems makes it possible to investigate their structures in detail.  This investigation may include the electron configurations of ground and various excited states.  In simple terms, it is a method for determining how much light is absorbed by a chemical substance and how much light passes through it at what intensity.
  • 9.
    SPECTROMETRIC METHODS OFANALYSIS  Electronic energy, vibrational energy, rotational energy, and translational energy are the different forms of energies connected with molecules.  Spectroscopic methods require less time and less amount of sample than classical methods.
  • 10.
    SPECTROSCOPIC METHODS OFANALYSIS A2 :Introduction: Index of hydrogen deficiency  The index of hydrogen (IHD) is sometimes called the modes of unsaturation or degrees of unsaturation.  It is a measure of the number of ∏-bonds and/or rings a molecule contains.  The IHD is determined from an examination of the molecular formula of unknown substance.  It is useful in structure determination.  Briefly it provides information about how much hydrogen atoms are missing for organic compound to be saturated.  The Index of Hydrogen Deficiency (IHD), is a count of how many molecules of H2 need to be added to a structure in order to obtain the corresponding saturated, acyclic species.  Hence the IHD takes a count of how many multiple bonds(pi) and rings are present in the structure.
  • 11.
    SPECTROSCOPIC METHODS OFANALYSIS (Index of hydrogen deficiency) • For any organic compound with known molecular formula, the index of hydrogen deficiency is determined as follows: (2c+2-h +n –x)/2 c: number of carbon atoms, h:number of hydrogen atoms n: number of nitrogen atoms or its members (P,….. x: number of halogen atoms. • The number of O atoms or its members (S ,…) are not considered in calculation of IHD. • Examples : Determine the index of hydrogen deficiency for the following compounds: C8H7NO; C4H4BrNO2 •
  • 12.
    SPECTROSCOPIC METHODS OFANALYSIS (Index of hydrogen deficiency) Importance of IHD calculation:  Index of hydrogen deficiency (IHD) can tell from the molecular formula of organic compound whether and how many multiple bonds and rings are involved.  This will help cut down the possibilities one has to consider in trying to come up with all the isomers of a given chemical formula.
  • 13.
    SPECTROSCOPIC METHODS OFANALYSIS (Index of hydrogen deficiency) Exercises:  Calculate the degrees of unsaturation, classify the compound as saturated or unsaturated, and list all the ring/pi bond combination possible for the following molecular formulas: (a.C9H20 (b.) C7H8 (c.) C5H7Cl (d.) C9H9NO4 (e.)C10H6N4
  • 14.
    SPECTROSCOPIC METHODS OFANALYSIS (Index of hydrogen deficiency) Calculate degrees of unsaturation (DoU) for the following, and propose a structure for each: a) C5H8 b) C4H4 c) C5H5N d) C5H5NO2 e) C5H5Br The following molecule is caffeine (C8H10N4O2), determine the degrees of unsaturation (DoU).
  • 15.
    Part I: UV-VisibleSpectroscopy • Ultraviolet-visible spectroscopy involves the absorption of ultraviolet/visible light by a molecule causing the promotion of an electron from a ground electronic state to an excited electronic state. • Ultraviolet/Visible light: wavelengths (l) between 200 and 800 nm
  • 16.
    Part I: UV-VisibleSpectroscopy 1.1. THE NATURE OF ELECTRONIC EXCITATIONS(cnt’d)  When a continuous radiation passes through a transparent material, a portion of the radiation may be absorbed.  If it occurs, the residual radiation when it is passed through a prism will yield a spectrum with gaps on it.  This is called an absorption spectrum.  As a result of energy absorption, atoms or molecules pass from a state of low energy (the initial or ground state) to a state of higher energy (the excited state).  This excitation state is shown in figure below(on next slide).  The electromagnetic radiation which is absorbed has energy which is exactly equal to the energy difference between the excited and ground states.
  • 17.
    Part I:Ultraviolet spectroscopy (Absorption& Emission) Rapid process(10-15 s)
  • 18.
    Part I:Ultraviolet spectroscopy 1.2THE ORGIN OF UV BAND STRUCTURE  For an atom which absorbs in the ultraviolet, the absorption spectrum often consists of very sharp lines of absorption, as would be expected for a quantized process occurring between two discrete energy levels.  For molecules, however the UV absorption usually occurs over a wide range of wavelength. This occurs because no molecules (as opposed to atoms) or ally have many excited modes of vibrations and rotation at room temperature.  In fact the vibration of the molecules cannot be completely ‘’frozen out ‘’ even at absolute zero. As a consequence a collection of molecules will generally have its members in many states of vibrational and rotational excitations.  The energy levels for these states are quite closely spaced, corresponding to considerably smaller energy differences than the electronic levels.
  • 19.
    Part I:Ultraviolet spectroscopy (ElectronicTransition) 1.2 (Ctnd) THE ORGIN OF UV BAND STRUCTURE In all compounds other than alkanes, the electrons may undergo several possible tansitions of different energies:  n→ ∏* in carbonyl cpds (c=o);  n → σ* in oxygen,nitrogen,sulfur,and halogen cpds.  ∏ → ∏* in alkenes, carbonyl cpds, alkynes, azo cpds ect;  σ→ ∏*in carbonyl cpds , alkenes , alkynes , ect..  σ → σ* in alkanes.
  • 20.
    Part I:Ultraviolet spectroscopy (Theorigin of the UV spectrum) - What is observed from these types of combined transitions is that the uv spectrum of a molecule usually consists of a band of absorption centered near the wavelength of the major transition (see next diagram)
  • 21.
  • 22.
    1.3 Principles ofabsorption spectroscopy  The greater the number of molecules capable of absorbing light of a given wavelength, the greater will be the extent of light absorption.  Furthermore, the more effective a molecule is in absorbing of a given wavelength, the greater will be the extent of light absorption.  From these guiding ideas, the following empirical formula, which is known as the Beer- Lambert law may be formulated:
  • 23.
    1.3 Principles ofabsorption spectroscopy (The Beer-Lambert Law) • The Beer-Lambert Law states that the absorbance of a solution is directly proportional to the concentration of the absorbing species in the solution and the path length. Thus, for a fixed path length, UV/Vis spectroscopy can be used to determine the concentration of the absorber in a solution • The method is most often used in a quantitative way, using the Beer-Lambert law; A= a.l.c
  • 24.
    • Where Ais absorbance (no units, since A = log10 P0 / P ) a is the molar absorbtivity with units of L mol-1 cm-1 L is, the path length of the cuvette in which the sample is contained. We will express this measurement in centimeters (cm). L is often replaced with the symbol “b”. C is the concentration of the compound in solution, expressed in mol L-1 .
  • 25.
    • Where Ais absorbance (no units, since A = log10 P0 / P ) a is the molar absorbtivity with units of L mol-1 cm-1 L is, the path length of the cuvette in which the sample is contained. We will express this measurement in centimeters (cm). L is often replaced with the symbol “b”. C is the concentration of the compound in solution, expressed in mol L-1 .
  • 26.
    The diagram belowshows a beam of monochromatic radiation of radiant power P0, directed at a sample solution. Absorption takes place and the beam of radiation leaving the sample has radiant power P . P
  • 27.
    The amount ofradiation absorbed may be measured in a number of ways: Transmittance, T = P / P0 % Transmittance, %T = 100 T Absorbance, A = log10 P0 / P A = log10 1 / T A = log10 100 / %T .The last equation, A = 2 - log10 %T, is worth remembering because it allows you to easily calculate absorbance from percentage transmittance data. .
  • 28.
    1.3 Principle ofabsorption spectroscopy (INSTRUMENTATION) • The instrument used in ultraviolet-visible spectroscopy is called a UV/Vis spectrophotometer. • It measures the intensity of light passing through a sample (P), and compares it to the intensity of light before it passes through the sample (P0). • The ratio P/P0 is called the transmittance. • The UV-visible spectrophotometer can also be configured to measure reflectance. In this case, the spectrophotometer measures the intensity of light reflected from a sample (l ), and compares it to the intensity of light reflected from a reference material (lo ) (such as a white tile). • The ratio is called the reflectance, and is usually expressed as a percentage (%R).
  • 29.
    1.3 Principle ofabsorption spectroscopy (INSTRUMENTATION)  BASIC PARTS OF SPECTROPHOTOMETER • Light source which are deuterium arc lamp (200 - 400 nm) and tungsten filament lamp (400-800 nm) • Diffraction grating in monochromator which separate different wavelengths of light • A holder of sample (cuvette) transparent glass container • Detector which should be a photomultiplier tube or photodiode • A signal indicator (signal processor and read out) A spectrophotometer can be either single beam or double beam
  • 30.
    Single beam spectrometer •Single beam photo, the light incandescent source(s) passes through the collimating lens (L) and then through adjustable diagram (D) by adjusting the intensity of incident radiation can be altered to any required level (Achieved by introducing rheostat in the circuit of sources). The is then incident on filter which permits only a narrow band of wavelength to pass through cuvette (c) which contain solution.
  • 33.
  • 34.
    Part I: U.VSpectroscopy  4.1 Presentation of the U.V spectrum • It is customary to present electronic spectra in graphical form, with either ϵ or logϵ plotted in the coordinate and wavelength on the abscissa. In some cases the absorbance or optical density is indicated in the ordinate . An example of spectrum is shown on next slide.
  • 35.
    Copyright © HoughtonMifflin Company.All rights reserved. 12a–35 O p
  • 36.
    • In adouble-beam instrument, the light is split into two beams before it reaches the sample. • One beam is used as the reference; the other beam passes through the sample. • The reference beam intensity is taken as 100% Transmission (or 0 Absorbance), and the measurement displayed is the ratio of the two beam intensities. • Some double-beam instruments have two detectors (photodiodes), the sample and reference beam are measured at the same time. • In other instruments, the two beams pass through a beam chopper, which blocks one beam at a time. • The detector alternates between measuring the sample beam and the reference beam in cycle. In this case, the measured beam intensities may be corrected by subtracting the intensity measured in the dark interval before the ratio is taken. • Spectrophotometer measures the wavelength of maximum absorption of light and the intensity of absorption.
  • 37.
    Advantages of doublebeam instrument • They are more stable than single beam instruments • It makes possible direct one step comparison of a sample in one path with standard blank solution in the other 1.5 Types of electronic transitions • Molecules containing π-electrons or non-bonding electrons (n-electrons) can absorb the energy in the form of ultraviolet or visible light to excite these electrons to higher anti-bonding molecular orbitals .The more easily excited the electrons (i.e. lower energy gap between the HOMO and the LUMO), the longer the wavelength of light it can absorb. • The amount of radiation actually absorbed depends on the structure of the compound as well as wavelength of radiation .measurement of light absorbed at each wavelength give structure of compound
  • 38.
    TYPES OF ELECTRONICTRANSITIONS • According to the molecular orbital theory when a molecule is excited by the absorption of energy (UV or visible light) its electrons are promoted from bonding to anti-bonding orbital  When Sigma (σ) electron gets promoted to anti-bonding sigma orbital(σ*).it is represented as σ →σ* transition  When a non bonding electron(n) gets promoted to anti-bonding sigma orbital(σ*).it is represented as n →σ* transition  Similarly π→ π* transition represents the promotion of π-electrons to anti-bonding π* orbital  Similarly when an n-electron is promoted to anti-bonding π*orbital it represents n→ π* transition. σ→ σ*> n→ σ* > π→ π*> n→ π*
  • 40.
    40 UV-Vis. Spectra (200- 700 nm) × σ  σ * < 150 nm × n  σ * 150 - 250 nm √ n  π* 200 - 700 nm √ π  π* 200 - 700 nm
  • 41.
    σ→σ* Transitions •These transitioncan occur in such compounds in which all the electrons are involved in single bonds and there are no lone pair of electrons. An electron in a bonding s orbital is excited to the corresponding anti- bonding orbital. The energy required is large. Examples saturated hydrocarbons like, methane (which has only C-H bonds, and can only undergo s s* transitions) shows an absorbance maximum at 125 nm. Absorption maxima due to s s* transitions are not seen in typical UV- Vis. Spectra (200 - 800 nm) and the absorption band occur in the far ultra violet region (126-135 nm). Since the commercial spectrophotometer do not operate in at wavelength less than 180- 200 nm, σ→σ*transitions is not normally observed
  • 42.
    N →σ* transitions • Saturatedcompounds containing atoms with lone pairs (non-bonding electrons) are capable of n s* transitions. These transitions usually need less energy than s s * transitions. • They can be initiated by light whose wavelength is in the range 150 - 250 nm. • The number of organic functional groups with n s* peaks in the UV region is small. However some compounds which absorb at slightly longer wavelength are known. For example (CH3)3N, has λ max =227 nm for n→σ* and λmax=99 nm for σ→ σ* transition. the commonly used solvent are aliphatic alcohols and alkyl halides because their absorption range starts only at 260 nm when absorption measurement are made in ultra violet region.
  • 43.
    n→π* transition • These typesof transitions are shown by unsaturated molecules which contain atoms such as O ,N ,and sulphur .transition show a weak band in their absorption spectrum. In aldehydes and ketones (having no C=C bond) the band due to the n→ π* transition occurs in range 270-300 nm. On the other hand carbonyl compounds having double bonds separated by two or more single bonds exhibit the bands due to the n→ π* transitions in range 300-350 nm π→π* Transition • These transition corresponds to the promotion of an electron from a bonding π orbital to anti-bonding π* orbital. This transition can be occurred in any molecules having a π-electron system. in certain olefins ,cis and trans isomers are possible .the trans isomers absorbs at the longer wavelength with the greater intensity than the cis isomer. • This difference increase as length of conjugated system increases for example , the ultra violet absorption spectrum of benzene exhibits three bands two intense bands at 180-200 nm and weak band at 260 nm.
  • 44.
    summary of electronicstructure and transition
  • 45.
    Choice of solvents Thechoice of solvent to be used in uv spectroscopy is quite important.  The first criterion for a good solvent is that t should not absorb uv radiation in the same region as the substance whose spectrum is being determined. Usually solvents which do not contain conjugated systems are most suitable for this purpose.  A second criterion which must be considered is the effect of a solvent on the fine structure of an absorption band. In a polar solvent, the hydrogen bonding forms a solute-solvent complex and the fine structure may disappear.  A third property of a solvent is the ability of a solvent to influence the wavelength of uv light which will be absorbed. Ex: water, methanol, ethanol, chloroform and hexane have different effect on absorption of radiation.
  • 46.
    1.7 CHROMOPHORES andAUXOCHROMES • The term chromophore was originally used to denote a functional group or some other structural feature the presence of which imparts a color to a compound. For example nitro (NO2) is chromophore which is responsible to impart yellow color to the compound. It is now defined as any group which exhibits absorption of electromagnetic radiations in visible or ultra violet region in those include: •
  • 47.
    1.7 (cntd) Chromophores (Typicalabsorptions of simple isolated chromophores) Class Transtion λmax(nm) logϵ ROH : n → σ* 180 2.5 R-O-R: n → σ* 180 3.5 RNH2: n → σ* 190 3.5 RSH: n → σ* 210 3.0 R2C=CR2: ∏ → ∏* 175 3.0 R-C≡C-R: ∏ → ∏* 170 3.0 R-C ≡N:n → ∏* 160 ˃1.0 R-N=N-R: n → ∏* 340 ˃1.0
  • 48.
    1.7 (cntd) Chromophores (Typicalabsorptions of simple isolated chromophores) Class Transtion λmax(nm) logϵ RNO2 : n → ∏* 271 ˃ 1.0 R-CHO: ∏ → ∏* 190 2.0 n → ∏* 290 1.0 R2CO: ∏→ ∏* 180 3.0 n → ∏* 280 1.5 RCOOH: n → ∏* 205 1.5 RCOOR: n → ∏* 205 1.5 RCONH2:n → ∏* 210 1.5
  • 49.
    It may ormay not impart color to the compound. As auxochrome is group which itself does not act as a chromophore but when attached to a chromophore shifts the absorption maximum towards longer wavelength with an increase in the intensity of absorption. For example –OH,-NH2 ,-OR ,-NHR and NR2 .since the auxochrome –NH2 group is attached to benzene ring the absorption changes from λ max 255 (ε max203) to λ max280 (ε max1430) the effect of auxochrome is caused by the presence of non-bonding electrons that can be shared to chromophore
  • 50.
    AUXOCHROMIC EFFECT  Bathochromicshift or red shift is a shift of λ max to a longer wavelength region.  Hypsochromic shift or blue shift is a shift of λ max to a lower wavelength region.  The auxochromes group does not only alter λ max in a molecules but also intensity of absorption (εmax)  Hyperchromic effect which is an increase in ε max value  Hypochromic effect which is an decrease in ε max value
  • 51.
    1.8 Effect ofconjugation • Conjugation of double bonds, however, lowers energy required for the transition .the reason is that in conjugated system, the difference in energy between the highest occupied molecular orbital (HOMO) and the lowest vacant anti-bonding molecular orbital (LUMO) becomes smaller
  • 52.
    1.8 Effect ofconjugation • As result >C=C-C=C< and >C=C-C=O exhibit π → π*absorption bands within the ordinary ultra violet range. For example, butadiene (CH2=CH-CH=CH2) in hexane solution shows λ max 217nm (εmax 20900) and 1,3,5,7, octatetraene (CH2=CH-CH=CH-CH=CH-CH=CH2) in hexane solution exhibits λ max296 nm (ε max52000) . • As the number of double bonds increase the absorption moves to longer wavelengths. Therefore the most occurred types of transitions are: n → π * for example >C=Ö: →˙ >C=O: and as result >C=C-C=C< and >C=C-C=O exhibit π → π* absorption bands within the ordinary ultra
  • 53.
    1) UV spectrumis formed when substances absorb radiation in range of 200-800nm. 2) Absorption of light in UV region leads to electronic transition in molecules. 3) Near UV region (200-380 nm) is useful in analytical chemistry, especially in predicting the number of conjugated double bonds, aromatic conjugation, conjugation of α, β-unsaturated carbonyl compounds 4) Wavelength corresponds to maximum absorption of light is called λ max and the corresponding intensity of absorption is known as absorptivity ε 5) Only slightly different energies. Thus radiation of large number of wavelength which are quite close together are absorbed leading to band spectrum. 6) According to MO theory, absorption of light in UV region causes four transition σ → σ*, n → σ*, n→ π*and π→ π* Summary
  • 54.
    7) n→ π*transition is seen in compound containing lone pair of electrons (e.g, carbonyl compounds) 8) π→ π*transition is shown by compounds containing unsaturated centres (alkenes and alkynes) 9) Chromophores are groups that can absorb electromagnetic radiation in visible or UV region 10) Auxochrome is a group that when attached to a chromophore shifts the λ max towards larger wavelength region 11) Groups which increase the λ max value are said to cause red shift or bathochromic shift 12) Groups which shift λ max to lower wavelength region are said to cause blue shift or hypsochromic shift 13) An auxochrome group increases the λ max value by extending the conjugation of chromophore group using its non-bonded electrons this extended conjugated results in the formation of new chromophore, which has higher λ max value
  • 55.
    APPLICATIONS • The mostimportant uses of UV-Visible spectroscopy in analytical chemistry is the determination of atomic and molecular structure including functional group and stereochemical arrangement by measurement of radiant energy absorbed or emitted by substance in any of the wavelength of electromagnetic spectrum in response to excitation by external energy source It may be noted that transitions to anti-bonding π* orbitals are associated only with unsaturated centres in the molecules.
  • 56.
    EXERCISES 1) Express A=1.0in terms of percent transmittance (%T), the unit usually used in IR spectroscopy (and sometimes in UV –visible as well. 2) The literature value of ε for 1,3-pentadiene in hexane is 26000 mol l-1 cm-1 at its maximum absorbance at 224 nm. You prepare a sample and take a UV spectrum, finding that A 244=0.850 what is the concentration of your sample 3) Describe the various types of electronic transitions observed in organic compounds when exposed to UV and visible light 4) The UV spectrum of acetone shows two important peaks at λmax 279nm (εmax 15) and λmax 198 nm (εmax 900) identify the electronic transition for each peak 5) Explain how you will distinguish between acetone and but-3-en-2-one with UV spectroscopy
  • 57.
    Copyright © HoughtonMifflin Company.All rights reserved. 12a–57 6.What compound would absorb the longest wavelength ultraviolet light? A B C D
  • 59.
    7. Which absorbsat the lowest wavelength?
  • 60.
  • 61.
  • 62.
    Question 8: UV-visiblespectrum of 4-nitroanaline Solvent: Ethanol Concentration: 15.4 mg L-1 Pathlength: 1 cm NH2 NO2 Molecular mass = 138
  • 63.
    Question 8 (cntd)UV-visible spectrum of 4- nitroanaline 1. Determine the absorption maxima (lmax) and absorption intensities (A) from the spectrum: lmax = 227 nm, A227 = 1.55 lmax = 375 nm, A375 = 1.75 2. Calculate the concentration of the compound: (1.54 x 10⁻² g L-1 )/(138 g/mol) = 1.12 x 10⁻⁴ mol L-1 3. Determine the molar absorptivity coefficients (e) from the Beer- Lambert Law: e = A/cℓ e227 = 1.55/(1.0 cm x 1.12 x 10-4 mol L-1 ) = 13,900 mol-1 L cm-1 e375 = 1.75/(1.0 cm x 1.12 x 10-4 mol L-1 ) = 15,700 mol-1 L cm-1
  • 64.
    Part II: Infra-redspectroscopy • 2.1 Introduction • 2.2 Infra-red absorption process • 2.3 Uses of infra-red spectrum • 2.4 The modes of vibration and bending • 2.5 Bonds properties and absorption trends • 2.6 The infra-red spectrometer • 2.7 Correlation chart and tables • 2.8 Approach to analysis
  • 65.
    2.1 INTRODUCTION • IRspectroscopy is one of the most common spectroscopic techniques used by organic and inorganic chemists. • Simply, it is the absorption measurement of different IR frequencies by a sample positioned in the path of an IR beam. • The main goal of IR spectroscopic analysis is to determine the chemical functional groups in the sample: Different functional groups absorb characteristic frequencies of IR radiation. 65
  • 66.
    Part II: Infra–Red Spectroscopy 2.1 Introduction(cntd) • IR absorption information is generally presented in the form of a spectrum with wavelength or wavenumber as the x-axis and absorption intensity or percent transmittance as the y-axis • The IR region is commonly divided into three smaller areas: near IR, mid IR, and far IR. 66
  • 67.
    near IR midIR/cm–1 and far Wavenumber/cm–1 13,000–4,000 4,000–200 200–10 Wavelength/μm 0.78–2.5 2.5–50 50–1,000 67
  • 68.
  • 69.
    2.2 IR AbsorptionProcess • We know that visible light is made up of a continuous range of different electromagnetic frequencies - each frequency can be seen as a different color. • Infra-Red radiation also consists of a continuous range of frequencies. 69
  • 70.
    2.2 IR AbsorptionProcess • If you shine a range of infra-red frequencies one at a time through a sample, you find that some frequencies get absorbed by the compound. A detector on the other side of the compound would show that some frequencies pass through the compound with almost no loss, but other frequencies are strongly absorbed. 70
  • 71.
    2.2 IR AbsorptionProcess • How much of a particular frequency gets through the compound is measured as percentage transmittance. • A percentage transmittance of 100 would mean that all of that frequency passed straight through the compound without any being absorbed. In practice, that never happens - there is always some small loss, giving a transmittance of perhaps 95% as the best you can achieve. 71
  • 72.
    2.2 IR AbsorptionProcess • A transmittance of only 5% would mean that nearly all of that particular frequency is absorbed by the compound. A very high absorption of this sort tells you important things about the bonds in the compound. 72
  • 73.
    2.2 Infra-Red AbsorptionProcess • Each frequency of light (including Infra-Red) has a certain energy. If a particular frequency is being absorbed as it passes through the compound being investigated, it must mean that its energy is being transferred to the compound. • Energies in Infra-Red radiation correspond to the energies involved in bond vibrations. 73
  • 74.
  • 75.
    IR Spectroscopy 2.3 Themodes of bonds vibration in IRThere are two types of bond vibration: • Stretch – Vibration or oscillation along the line of the bond • Bend – Vibration or oscillation not along the line of the bond H H C H H C scissor asymmetric H H C C H H C C H H C C H H C C symmetric rock twist wag in plane out of plane
  • 76.
    2.4 Uses ofInfra-Red Spectrum • Each frequency of light (including Infra-Red) has a certain energy. If a particular frequency is being absorbed as it passes through the compound being investigated, it must mean that its energy is being transferred to the compound. • Energies in Infra-Red radiation correspond to the energies involved in bond vibrations. 76
  • 77.
    2.4 Uses ofInfra-Red Spectrum (Schematic diagram of a typical infrared spectrophotometer)
  • 78.
  • 79.
    2.5 Bonds propertiesand absorption trends . • In covalent bonds, atoms aren't joined by rigid links . The two nuclei can vibrate backwards and forwards - towards and away from each other - around an average position.   1 2 k Mx My c MxMy     Hooke's Law and Vibrational excitation Vibrations due to bond stretching and contracting y x 79
  • 80.
    2.5 Bonds propertiesand absorptio trends(Factors affecting IR Stretch Frequency) • Masses of atoms at ends of a bond • Springs connecting small weights vibrate faster than springs with large weights. • H-C > C-C • H-O > C-O • Type of bond (force constant) • Shorter, stronger springs vibrate at high frequency than long, weak springs • C≡C > C=C > C-C Hookes’ Law m2 m1
  • 82.
    Fig. 10.15, p.383 2.5 Bonds properties and absorption trends Low Energy High Energy E = h hc  =
  • 83.
    1. Each stretchingand bending vibration occurs with a characteristic frequency as the atoms and charges involved are different for different bonds The y-axis on an IR spectrum is in units of % transmittance In regions where the EM field of an osc. bond interacts with IR light of the same n – transmittance is low (light is absorbed) In regions where no osc. bond is interacting with IR light, transmittance nears 100% 2.6 Absorption bands and frequencies of chemical bonds and transmittance
  • 84.
    IR Spectroscopy The IRSpectrum The x-axis of the IR spectrum is in units of wavenumbers, n, which is the number of waves per centimeter in units of cm-1 (Remember E = hn or E = hc/l)
  • 85.
    IR Spectroscopy The IRSpectrum 3. This unit is used rather than wavelength (microns) because wave numbers are directly proportional to the energy of transition being observed – chemists like this, physicists hate it High frequencies and high wave numbers equate higher energy is quicker to understand than Short wavelengths equate higher energy 4. This unit is used rather than frequency as the numbers are more “real” than the exponential units of frequency 5. IR spectra are observed for the mid-infrared: 600-4000 cm-1 6. The peaks are Gaussian distributions of the average energy of a transition
  • 86.
    IR Spectroscopy The IRSpectrum 7. In general: Lighter atoms will allow the oscillation to be faster – higher energy This is especially true of bonds to hydrogen – C-H, N-H and O-H Stronger bonds will have higher energy oscillations Triple bonds > double bonds > single bonds in energy Energy/n of oscillation
  • 87.
    The IR Spectrum– The detection of different bonds 7. As opposed to chromatography or other spectroscopic methods, the area of a IR band (or peak) is not directly proportional to concentration of the functional group producing the peak 8. The intensity of an IR band is affected by two primary factors: Whether the vibration is one of stretching or bending Electronegativity difference of the atoms involved in the bond • For both effects, the greater the change in dipole moment in a given vibration or bend, the larger the peak. • The greater the difference in electronegativity between the atoms involved in bonding, the larger the dipole moment • Typically, stretching will change dipole moment more than bending Infrared Spectroscopy
  • 88.
    The IR Spectrum– The detection of different bonds 9. It is important to make note of peak intensities to show the effect of these factors: • Strong (s) – peak is tall, transmittance is low (0-35 %) • Medium (m) – peak is mid-height (75-35%) • Weak (w) – peak is short, transmittance is high (90-75%) • * Broad (br) – if the Gaussian distribution is abnormally broad (*this is more for describing a bond that spans many energies) Exact transmittance values are rarely recorded Infrared Spectroscopy
  • 89.
    Characteristic IR absorptionsof selelected functional groups Frequency range(cm-1 ) Bond or functional group Intensity 3500-3200 O-H alcohol Strong and broad 3400-2400 O-H carboxylic acid Strong and broad 3500-3100 N-H amine medium 33303270 C-H alkyne medium 3100-3000 =C-H alkene medium 3000-2850 C-H alkane Medium to strong 2260-2100 CC alkyne weak 1800-1630 C=O carbonyl strong 1680-1600 C=C alkene weak 1250-1050 C-O ether strong
  • 90.
    II. Infrared GroupAnalysis A. General 1. The primary use of the IR is to detect functional groups 2. Because the IR looks at the interaction of the EM spectrum with actual bonds, it provides a unique qualitative probe into the functionality of a molecule, as functional groups are merely different configurations of different types of bonds 3. Since most “types” of bonds in covalent molecules have roughly the same energy, i.e., C=C and C=O bonds, C-H and N-H bonds they show up in similar regions of the IR spectrum 4. Remember all organic functional groups are made of multiple bonds and therefore show up as multiple IR bands (peaks) Infrared Spectroscopy
  • 91.
    II. Infrared GroupAnalysis A. General 5. The four primary regions of the IR spectrum 4000 cm-1 2700 cm-1 2000 cm-1 1600 cm-1 600 cm-1 O-H N-H C-H C≡C C≡N C=O C=N C=C Fingerprint Region C-C C-N C-O Infrared Spectroscopy Bonds to H Triple bonds Double bonds Single Bonds
  • 92.
    1. Alkanes –combination of C-C and C-H bonds • C-C stretches and bends 1360-1470 cm-1 • CH2-CH2 bond 1450-1470 cm-1 • CH2-CH3 bond 1360-1390 cm-1 • sp3 C-H between 2800-3000 cm-1 Infrared Spectroscopy Octane C H H H (w – s) (m)
  • 93.
    2. Alkenes –addition of the C=C and vinyl C-H bonds • C=C stretch at 1620-1680 cm-1 weaker as substitution increases • vinyl C-H stretch occurs at 3000-3100 cm-1 • The difference between alkane, alkene or alkyne C-H is important! If the band is slightly above 3000 it is vinyl sp2 C-H or alkynyl sp C-H if it is below it is alkyl sp3 C-H 1-Octene Infrared Spectroscopy C C H H H (w – m) (w – m)
  • 94.
    3. Alkynes –addition of the C=C and vinyl C-H bonds • C≡C stretch 2100-2260 cm-1 ; strength depends on asymmetry of bond, strongest for terminal alkynes, weakest for symmetrical internal alkynes • C-H for terminal alkynes occurs at 3200-3300 cm-1 • Internal alkynes ( R-C≡C-R ) would not have this band! 1-Octyne Infrared Spectroscopy C C H (m – s) (w-m)
  • 95.
    4. Aromatics • Dueto the delocalization of e- in the ring, C-C bond order is 1.5, the stretching frequency for these bonds is slightly lower in energy than normal C=C • These show up as a pair of sharp bands, 1500 & 1600 cm-1 , (lower frequency band is stronger) • C-H bonds off the ring show up similar to vinyl C-H at 3000-3100 cm-1 Ethyl benzene Infrared Spectroscopy H (w – m) (w – m)
  • 96.
    4. Aromatics • Ifthe region between 1667-2000 cm-1 (w) is free of interference (C=O stretching frequency is in this region) a weak grouping of peaks is observed for aromatic systems • Analysis of this region, called the overtone of bending region, can lead to a determination of the substitution pattern on the aromatic ring Monosubstituted 1,2 disubstituted (ortho or o-) 1,2 disubstituted (meta or m-) 1,4 disubstituted (para or p-) G G G G G G G Infrared Spectroscopy
  • 97.
    5. Unsaturated Systems– substitution patterns • The substitution of aromatics and alkenes can also be discerned through the out- of-plane bending vibration region • However, other peaks often are apparent in this region. These peaks should only be used for reinforcement of what is known or for hypothesizing as to the functional pattern. R C H C R C H CH2 R C H C R C R CH2 R C R C R H R H R H 985-997 905-915 cm-1 960-980 665-730 885-895 790-840 R R R R R R R cm-1 730-770 690-710 735-770 860-900 750-810 680-725 800-860 Infrared Spectroscopy
  • 98.
    6. Ethers –addition of the C-O-C asymmetric band and vinyl C-H bonds • Show a strong band for the antisymmetric C-O-C stretch at 1050-1150 cm-1 • Otherwise, dominated by the hydrocarbon component of the rest of the molecule Diisopropyl ether Infrared Spectroscopy O (s)
  • 99.
    7. Alcohols • Strong,broad O-H stretch from 3200-3400 cm-1 • Like ethers, C-O stretch from 1050-1260 cm-1 • Band position changes depending on the alcohols substitution: 1° 1075-1000; 2° 1075-1150; 3° 1100-1200; phenol 1180-1260 • The shape is due to the presence of hydrogen bonding 1-butanol Infrared Spectroscopy O H (m– s) br (s)
  • 100.
    8. Amines -Primary • Shows the –N-H stretch for NH2 as a doublet between 3200-3500 cm-1 (symmetric and anti- symmetric modes) • -NH2 has deformation band from 1590-1650 cm-1 • Additionally there is a “wag” band at 780-820 cm-1 that is not diagnostic 2-aminopentane Infrared Spectroscopy N H H (w) (w)
  • 101.
    9. Amines –Secondary • N-H band for R2N-H occurs at 3200-3500 cm-1 as a single sharp peak weaker than –O-H • Tertiary amines (R3N) have no N-H bond and will not have a band in this region pyrrolidine Infrared Spectroscopy N H (w – m)
  • 102.
    Infrared Spectroscopy Pause andReview • Inspect the bonds to H region (2700 – 4000 cm-1 ) • Peaks from 2850-3000 are simply sp3 C-H in most organic molecules • Above 3000 cm-1 Learn shapes, not wavenumbers!: Broad U-shape peak -O—H bond V-shape peak -N—H bond for 2o amine (R2N—H) Sharp spike -C≡C—H bond W-shape peak -N—H bond for 1o amine (RNH2) 3000 cm-1 Small peak shouldered just above 3000 cm-1 C=C—H or Ph—H
  • 103.
    10. Aldehydes • C=O(carbonyl) stretch from 1720-1740 cm-1 • Band is sensitive to conjugation, as are all carbonyls (upcoming slide) • A highly unique sp2 C-H stretch appears as a doublet, 2720 & 2820 cm-1 called a “Fermi doublet” Cyclohexyl carboxaldehyde Infrared Spectroscopy C H O (w-m) (s)
  • 104.
    11. Ketones • Simplestof the carbonyl compounds as far as IR spectrum – carbonyl only • C=O stretch occurs at 1705-1725 cm-1 3-methyl-2-pentanone Infrared Spectroscopy O (s)
  • 105.
    12. Esters • C=Ostretch at 1735-1750 cm-1 • Strong band for C-O at a higher frequency than ethers or alcohols at 1150-1250 cm-1 Infrared Spectroscopy Ethyl pivalate O O (s) (s)
  • 106.
    13. Carboxylic Acids: •Gives the messiest of IR spectra • C=O band occurs between 1700-1725 cm-1 • The highly dissociated O-H bond has a broad band from 2400- 3500 cm-1 covering up to half the IR spectrum in some cases 4-phenylbutyric acid Infrared Spectroscopy C O O H (w – m) br (s) (s)
  • 107.
    14. Acid anhydrides •Coupling of the anhydride though the ether oxygen splits the carbonyl band into two with a separation of 70 cm-1 • Bands are at 1740-1770 cm-1 and 1810-1840 cm-1 • Mixed mode C-O stretch at 1000-1100 cm-1 Propionic anhydride Infrared Spectroscopy O O O (s) (s)
  • 108.
    15. Acid halides •Clefted band at 1770-1820 cm-1 for C=O • Bonds to halogens, due to their size (see Hooke’s Law derivation) occur at low frequencies, only Cl is light enough to have a band on IR, C-Cl is at 600- 800 cm-1 Propionyl chloride Cl O Infrared Spectroscopy (s) (s)
  • 109.
    16. Amides • Displayfeatures of amines and carbonyl compounds • C=O stretch at 1640-1680 cm-1 • If the amide is primary (-NH2) the N-H stretch occurs from 3200-3500 cm-1 as a doublet • If the amide is secondary (-NHR) the N-H stretch occurs at 3200-3500 cm-1 as a sharp singlet pivalamide NH2 O Infrared Spectroscopy (m – s) (s)
  • 110.
    17. Nitro group(-NO2) • Proper Lewis structure gives a bond order of 1.5 from nitrogen to each oxygen • Two bands are seen (symmetric and asymmetric) at 1300-1380 cm-1 and 1500-1570 cm-1 • This group is a strong resonance withdrawing group and is itself vulnerable to resonance effects 2-nitropropane N O O Infrared Spectroscopy (s) (s)
  • 111.
    18. Nitriles (thecyano- or –C≡N group) • Principle group is the carbon nitrogen triple bond at 2100-2280 cm-1 • This peak is usually much more intense than that of the alkyne due to the electronegativity difference between carbon and nitrogen propionitrile N C Infrared Spectroscopy (s)
  • 112.
    Effects on IRbands 1. Conjugation – by resonance, conjugation lowers the energy of a double or triple bond. The effect of this is readily observed in the IR spectrum: • Conjugation will lower the observed IR band for a carbonyl from 20-40 cm-1 provided conjugation gives a strong resonance contributor O O 1684 cm-1 1715 cm-1 C=O C=O C H3C O X X = NH2 CH3 Cl NO2 1677 1687 1692 1700 cm-1 H2N C CH3 O Strong resonance contributor vs. N O O C CH3 O Poor resonance contributor (cannot resonate with C=O) Infrared Spectroscopy
  • 113.
    Effects on IRbands 2. Steric effects – usually not important in IR spectroscopy, unless they reduce the strength of a bond (usually p) by interfering with proper orbital overlap: • Here the methyl group in the structure at the right causes the carbonyl group to be slightly out of plane, interfering with resonance 3. Strain effects – changes in bond angle forced by the constraints of a ring will cause a slight change in hybridization, and therefore, bond strength • As bond angle decreases, carbon becomes more electronegative, as well as less sp2 hybridized (bond angle < 120°) O C=O: 1686 cm-1 O C=O: 1693 cm-1 CH3 O O O O O 1815 cm-1 1775 cm-1 1750 cm-1 1715 cm-1 1705 cm-1 Infrared Spectroscopy
  • 114.
    Effects on IRbands 4. Hydrogen bonding • Hydrogen bonding causes a broadening in the band due to the creation of a continuum of bond energies associated with it • In the solution phase these effects are readily apparent; in the gas phase where these effects disappear or in lieu of steric effects, the band appears as sharp as all other IR bands: Gas phase spectrum of 1-butanol Steric hindrance to H-bonding in a di-tert-butylphenol • H-bonding can interact with other functional groups to lower frequencies OH C=O; 1701 cm-1 O O H Infrared Spectroscopy
  • 115.
    Interpreting infrared spectra •Calculate the index of hydrogen deficiency of each compound: C5H9N3 (histamine);C20H24N2O2(quinine); C10H14N2(nicotine); C21H28O5, (cortisone) C21H22N2O2 (strychnine) • Compound C, with the molecular formula C4H6 reacts with Hydrogen and nickel to give compound D with the molecular formula C4H10. Compound C, however, shows no absorption above 3000cm-1 in its spectrum, Suggest structures for compounds C and D • Show how IR spectroscopy can be used to distinguish between the compounds in each of the following pairs: 1-pentyne and 2- pentyne ; 1-pentene and 1-pentyne;pentanoic acid and 1-pentanol; pentane and 1-pentene;1-pentanol and pentanal; pentanoic acid and 2-pentanone.

Editor's Notes

  • #21 Figure 14.13: The ultraviolet spectrum of 1,3-butadiene, λmax = 217 nm.
  • #33 Intro: Many molecules absorb ultraviolet or visible light. The absorbance of a solution increases as attenuation of the beam increases. Absorbance is directly proportional to the path length, b, and the concentration, c, of the absorbing species. Beer's Law states that A = ebc, where e is a constant of proportionality, called the absorbtivity. Different molecules absorb radiation of different wavelengths. An absorption spectrum will show a number of absorption bands corresponding to structural groups within the molecule. For example, the absorption that is observed in the UV region for the carbonyl group in acetone is of the same wavelength as the absorption from the carbonyl group in diethyl ketone.
  • #40 IR region: 7.8x10⁻⁷ m to 10-4 m. Organic chemists use the region from 2.5x10⁻⁶ to 2.6x10⁻⁵ m. Wavenumbers are usually given in um, and frequencies are expressed in wavenumbers, which are the reciprocal of wavelength. s ® s* Transitions An electron in a bonding s orbital is excited to the corresponding antibonding orbital. The energy required is large. For example, methane (which has only C-H bonds, and can only undergo s ® s* transitions) shows an absorbance maximum at 125 nm. Absorption maxima due to s ® s* transitions are not seen in typical UV-Vis. spectra (200 - 700 nm) n ® s* Transitions Saturated compounds containing atoms with lone pairs (non-bonding electrons) are capable of n ® s* transitions. These transitions usually need less energy than s ® s * transitions. They can be initiated by light whose wavelength is in the range 150 - 250 nm. The number of organic functional groups with n ® s* peaks in the UV region is small. n ® p* and p ® p* Transitions Most absorption spectroscopy of organic compounds is based on transitions of n or p electrons to the p* excited state. This is because the absorption peaks for these transitions fall in an experimentally convenient region of the spectrum (200 - 700 nm). These transitions need an unsaturated group in the molecule to provide the p electrons. Molar absorbtivities from n ® p* transitions are relatively low, and range from 10 to100 L mol-1 cm-1 . p ® p* transitions normally give molar absorbtivities between 1000 and 10,000 L mol-1 cm-1 .
  • #82 Figure 12.15: The four regions of the infrared spectrum: single bonds to hydrogen, triple bonds, double bonds, and fingerprint.