![Input
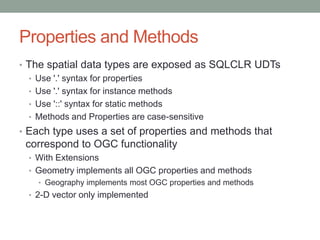
• Spatial data is stored in a proprietary binary format
• Instance of the type can be NULL
• Can be input as
• Well Known binary - ST[Type]FromWKB
• Well Known text - ST[Type]FromText
• Geography Markup Language (GML) - GeomFromGml
• Can also use SQLCLR functions
• Parse
• Point - extension function
• Input from SQLCLR Type - SqlGeometry, SqlGeography
• Spatial builder API –
Populate, IGeometrySink/IGeographySink](https://image.slidesharecdn.com/16spatialsqlserver-120112090314-phpapp02/85/Spatial-Data-in-SQL-Server-13-320.jpg)
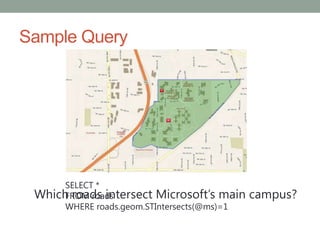


Spatial support in SQL Server 2008 R2 provides two spatial data types - geometry and geography. It includes a comprehensive set of spatial methods and high performance spatial indexes. The spatial library supports open geospatial standards and can be used to build location-aware applications.


![Getting Started with Apache Spark: Big Data Made Simple [Free Meetup]](https://cdn.slidesharecdn.com/ss_thumbnails/apachesparkgettingstarted-260203175547-8361bcc3-thumbnail.jpg?width=640&height=640&fit=bounds)


