Download as PDF, PPTX


1.0*[O]([H][C])
-1.0*[O]([H][H])
1.0*[O]([H][P])
0.0](https://image.slidesharecdn.com/b1b4ab4f-fbe9-46e6-baee-0266ecfacfde-160421122803/85/soutenance-61-320.jpg)

1.0*[O]([H][C])
-1.0*[O]([H][H])
1.0*[O]([H][P])
0.0
1.0*[C@@]([H][C@@]([H][C][O])[C@@]([H][C@][O])[O]([H]))
1.0*[C@@]([H][C@]([H][C@@][O])[C@@]([H][C@@][O])[O]([H]))
1.0*[C@@]([H][C@]([H][C@@][O])[O]([H])[O]([C@@]))
-1.0*[C@@]([H][C@]([H][C@][O])[C@@]([H][C@][O])[O]([H]))
-1.0*[C@@]([H][C@]([H][O][O])[C@@]([H][C@][O])[O]([H]))
1.0*[C@@]([H][C]([H][H][O])[C@@]([H][C@@][O])[O]([C@@]))
1.0*[C@]([H][C@@]([H][C@@][O])[C@@]([H][O][O])[O]([H]))
-1.0*[C@]([H][C@@]([H][C@@][O])[O]([H])[O]([C@]))
-1.0*[C@]([H][C@]([H][C][O])[C@@]([H][C@@][O])[O]([H]))
-1.0*[C@]([H][C]([H][H][O])[C@]([H][C@@][O])[O]([C@]))
1.0*[C]([H][H][C@@]([H][C@@][O])[O]([H]))
-1.0*[C]([H][H][C@]([H][C@][O])[O]([P]))
1.0*[H]([C@@]([C@@][C@@][O]))
-1.0*[H]([C@@]([C@][C@@][O]))
1.0*[H]([C@@]([C@][O][O]))
1.0*[H]([C@@]([C][C@@][O]))
1.0*[H]([C@]([C@@][C@@][O]))
-1.0*[H]([C@]([C@@][O][O]))
-1.0*[H]([C@]([C@][C@@][O]))
-1.0*[H]([C@]([C][C@][O]))
2.0*[H]([C]([H][C@@][O]))
-2.0*[H]([C]([H][C@][O]))
1.0*[H]([O]([C@@]))
-1.0*[H]([O]([C@]))
1.0*[H]([O]([C]))
-2.0*[H]([O]([H]))
1.0*[H]([O]([P]))
1.0*[O]([C@@]([H][C][C@@])[C@@]([H][C@][O]))
-1.0*[O]([C@]([H][C][C@])[C@]([H][C@@][O]))
-1.0*[O]([C]([H][H][C@])[P]([O][O]=[O]))](https://image.slidesharecdn.com/b1b4ab4f-fbe9-46e6-baee-0266ecfacfde-160421122803/85/soutenance-62-320.jpg)

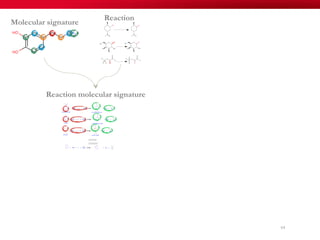
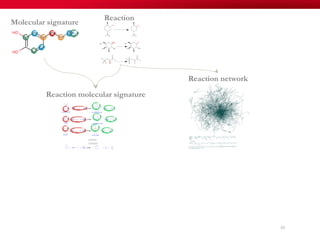
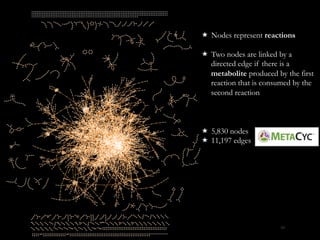
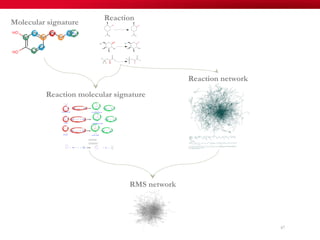
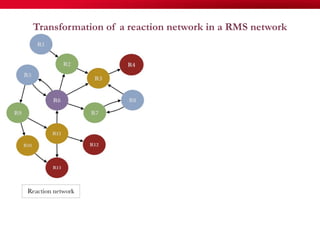
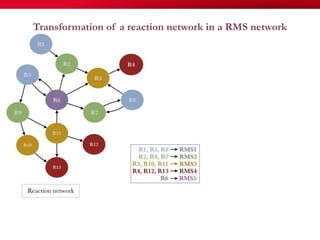
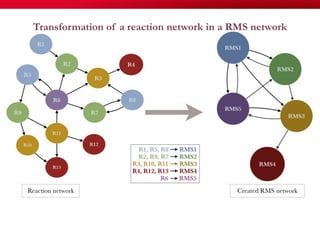
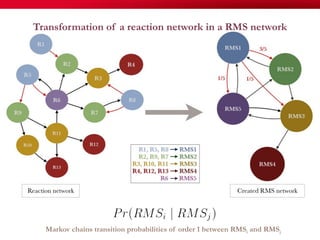
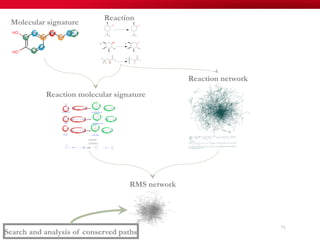
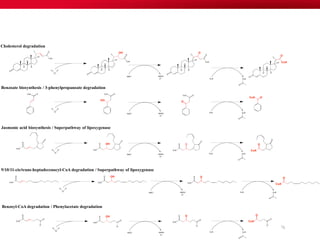
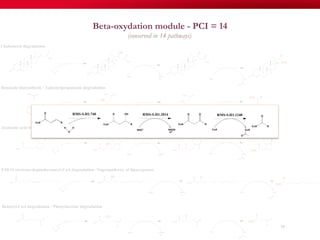
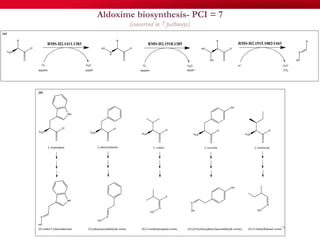
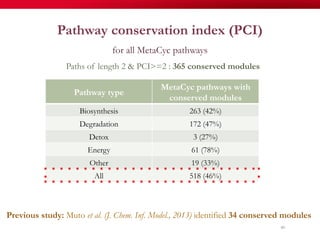
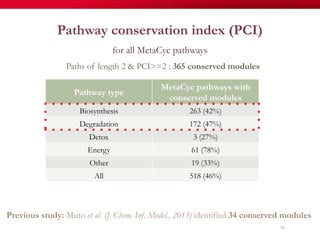
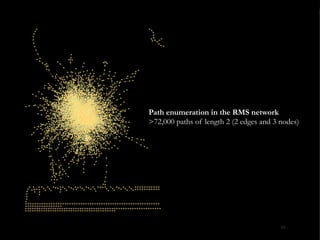
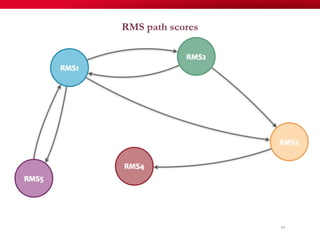
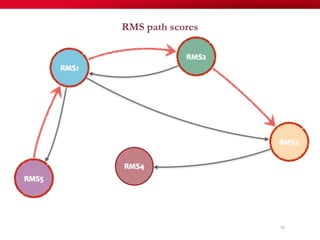
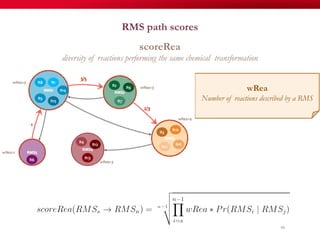
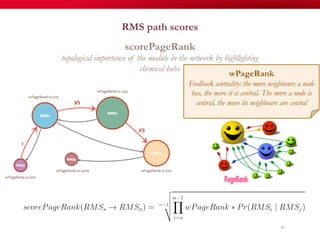
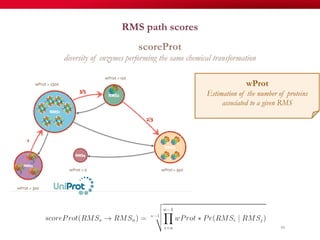
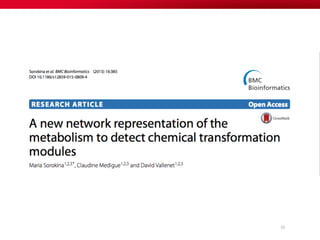
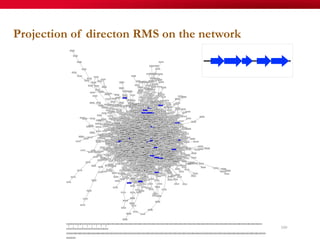
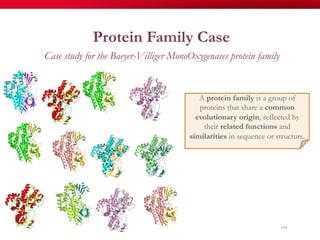
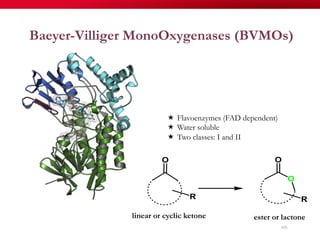
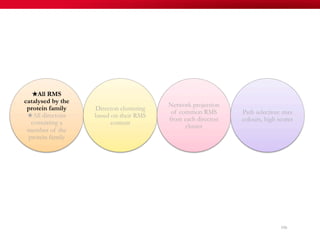
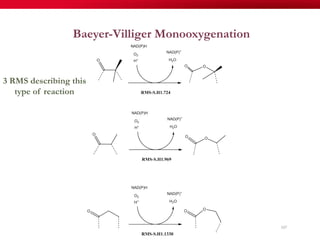
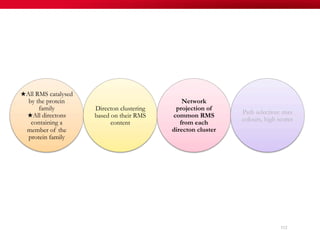
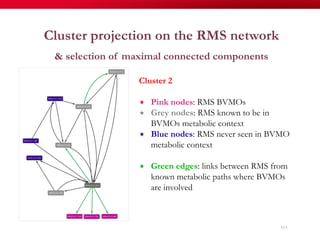
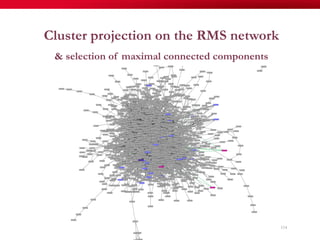
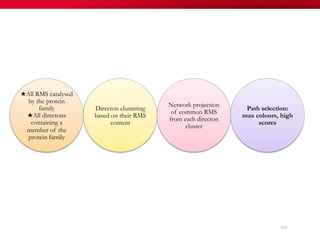
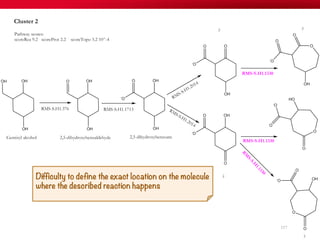


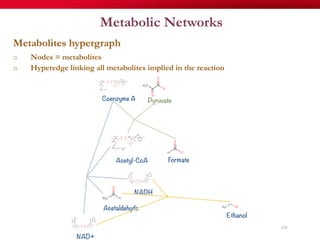
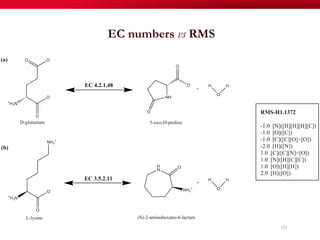

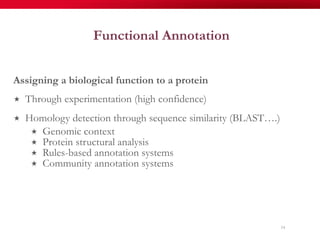
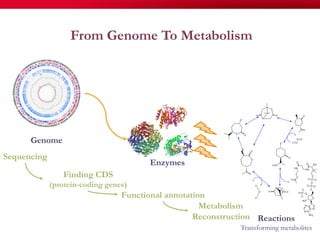
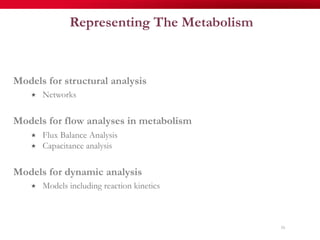
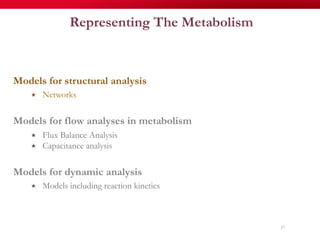
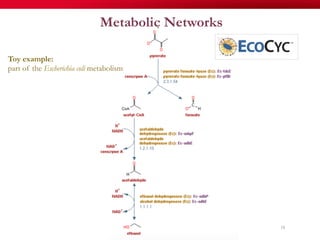
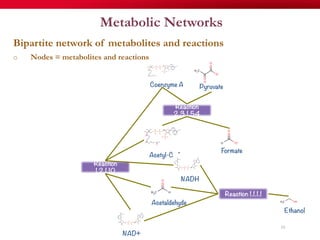
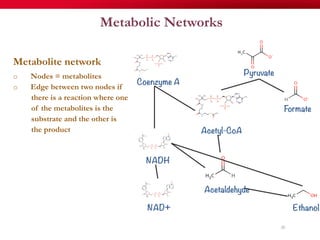
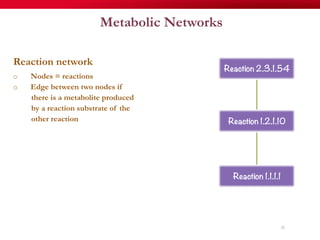
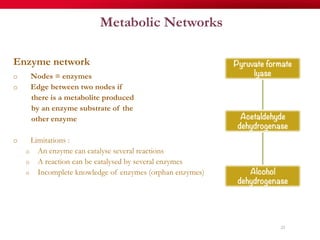
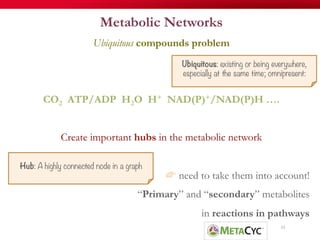
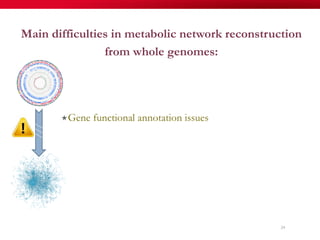
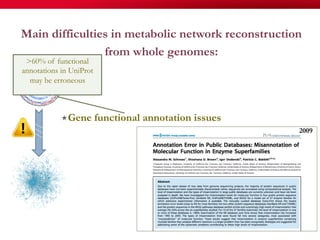
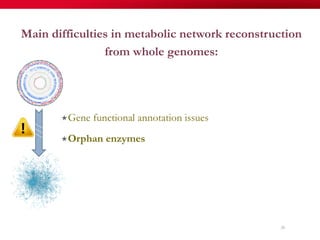
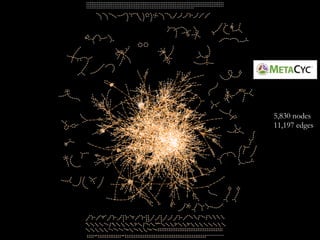
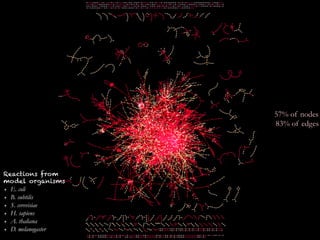
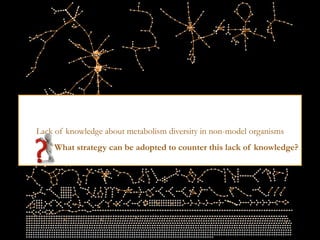
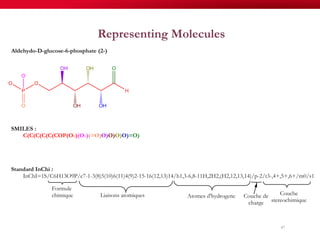
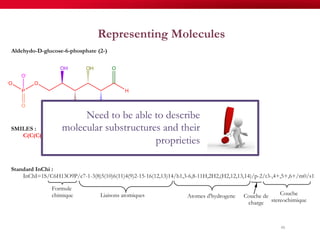
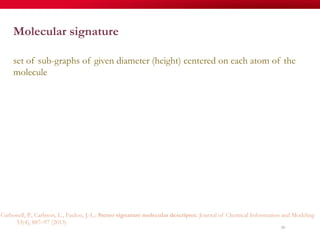
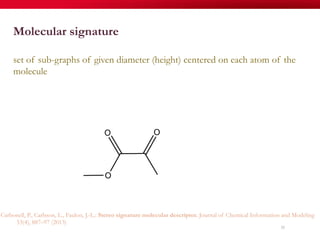
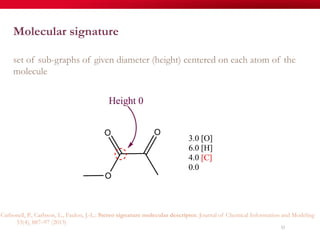
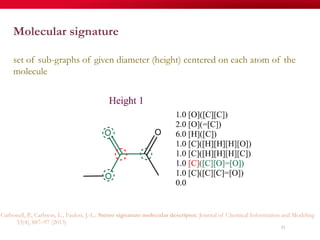
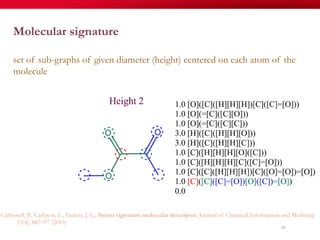
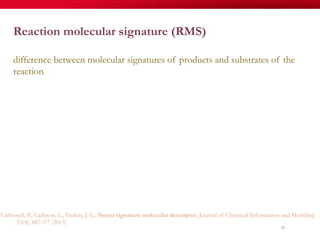
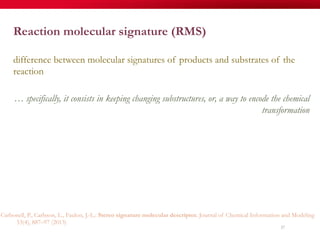
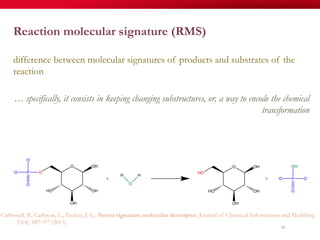
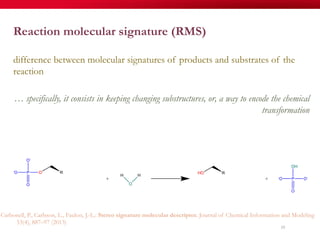
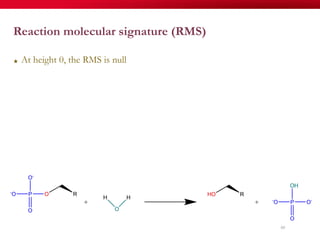
The document discusses reaction molecular signature networks and conserved modules in metabolism. It introduces molecular signatures to represent molecules and reactions, and describes how reaction molecular signatures encode chemical transformations by representing the difference between product and substrate molecular signatures. Conserved modules in metabolism can then be identified by analyzing networks of related reactions based on common chemical transformations in their molecular signatures. This approach allows investigation of conserved chemical transformations in metabolic pathways while accounting for enzyme promiscuity.


![인터넷바카라[[SX797。CΟM]]바카라사이트 사이트](https://cdn.slidesharecdn.com/ss_thumbnails/aaaaaaa-ox600-160409081637-thumbnail.jpg?width=640&height=640&fit=bounds)


