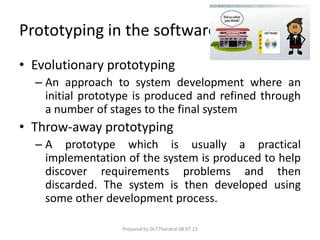
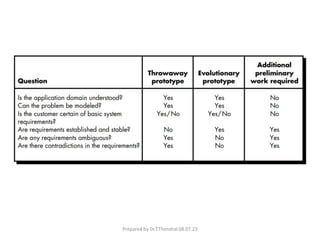
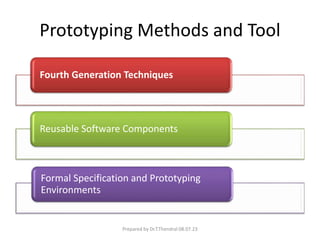
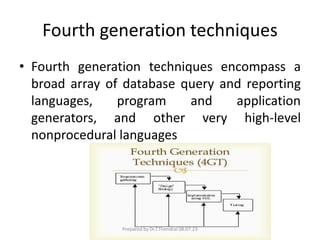
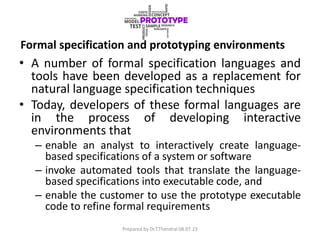
Software prototyping
Prepared by
Dr.T.Thendral
Assistant Professor
Department of Computer Science
Sri Ramaskrishna College of Arts & Science for Women
Coimbatore
Prepared by Dr.T.Thendral 08.07.23
• Requirements elicitation "brainstorming"
techniques is conducted, analysis principles
are applied, and a model of the software to be
built, called a prototype, is constructed for
customer and developer assessment
Prepared by Dr.T.Thendral 08.07.23
Selecting the Prototyping Approach
• The prototyping paradigm can be either close-
ended or open-ended.
• The close-ended approach is often called
throwaway prototyping.
• Using this approach, a prototype serves solely as
a rough demonstration of requirements.
• An open-ended approach, called evolutionary
prototyping, uses the prototype as the first part
of an analysis activity that will be continued into
design and construction
Prepared by Dr.T.Thendral 08.07.23
• A number of prototyping candidacy factors:
and
Application
Area
Application
Complexity
Customer
Characteristics
Project
Characteristics
Prepared by Dr.T.Thendral 08.07.23
Prototyping in the software process
• Evolutionary prototyping
– An approach to system development where an
initial prototype is produced and refined through
a number of stages to the final system
• Throw-away prototyping
– A prototype which is usually a practical
implementation of the system is produced to help
discover requirements problems and then
discarded. The system is then developed using
some other development process.
Prepared by Dr.T.Thendral 08.07.23
• The objective of evolutionary prototyping is to
deliver a working system to end-users. The
development starts with those requirements
that are best understood.
• The objective of throw-away prototyping is to
validate or derive the system requirements.
The prototyping process starts with those
requirements that are poorly understood.
Prepared by Dr.T.Thendral 08.07.23
Prototyping Methods and Tool
Fourth Generation Techniques
Reusable Software Components
Formal Specification and Prototyping
Environments
Prepared by Dr.T.Thendral 08.07.23
Fourth generation techniques
• Fourth generation techniques encompass a
broad array of database query and reporting
languages, program and application
generators, and other very high-level
nonprocedural languages
Prepared by Dr.T.Thendral 08.07.23
Reusable software components
• The prototype by using a set of existing
software components
Prepared by Dr.T.Thendral 08.07.23
Formal specification and prototyping environments
• A number of formal specification languages and
tools have been developed as a replacement for
natural language specification techniques
• Today, developers of these formal languages are
in the process of developing interactive
environments that
– enable an analyst to interactively create language-
based specifications of a system or software
– invoke automated tools that translate the language-
based specifications into executable code, and
– enable the customer to use the prototype executable
code to refine formal requirements
Prepared by Dr.T.Thendral 08.07.23
Elements of analysis model
• Analysis model must achieve 3 primary goals:
(1) to define what the customer needs,
• (2) to build a basis for the establishment of a
software design and
• (3) to describe a group of needs which can be
validated once the software is established
Prepared by Dr.T.Thendral 08.07.23
DATA MODELING - Objectives
• Identify and describe important entities and
relationships to model data
• Develop data models to represent, organize,
and store data
• Design and use relational databases to
organize, store and manipulate data
Prepared by Dr.T.Thendral 08.07.23
Data Modeling
• Goal – make sure all data objects required by
a database are completely and accurately
represented
• Data model design – the blueprint for creating
a physical implementation of a database
Prepared by Dr.T.Thendral 08.07.23
Data Modeling Terms
• Entity – a class of real world objects having
common attributes (e.g., sites, variables,
methods).
• Attribute – A characteristic or property of an
entity (site name, latitude, longitude)
• Relationship – an association between two or
more entities
• Cardinality – the number of entities on either
end of a relationship (one-to-one, one-to-many,
many-to-many, etc.)
Prepared by Dr.T.Thendral 08.07.23
Data Modeling Exercise
• Consider:
– What is the “entity”?
– What are the
“attributes” of the
entity?
Prepared by Dr.T.Thendral 08.07.23
Data Modeling Exercise
• What is the entity?
• What are the attributes?
Prepared by Dr.T.Thendral 08.07.23
Data Modeling Exercise
• What is the entity?
• What are the attributes?
Prepared by Dr.T.Thendral 08.07.23
Data Modeling Exercise
• What are the relationships?
Apple Apple Tree Orchard
Grows On
Grows In
Prepared by Dr.T.Thendral 08.07.23
Data Modeling Exercise
• What are the relationships?
Apple Apple Tree Orchard
Grows On
Grows In
What about the business rules?
Prepared by Dr.T.Thendral 08.07.23
Entity Relationship Diagram
• Documentation of the structure of the data
• Used to communicate the design
• Serve as the basis for data model
implementation
Prepared by Dr.T.Thendral 08.07.23
Entity Relationship Diagram
(Relation Database Context)
• Entities effectively become tables
• Attributes describe entities and become fields
(columns) in tables
• Relationships link tables on a common
attribute or “key” and become formal
constraints (part of the business rules)
Prepared by Dr.T.Thendral 08.07.23
ER Diagram Entity Notation
Attributes
Entity
Entity Name
Data Type
Prepared by Dr.T.Thendral 08.07.23
ER Diagram Relationship Notation
• Multiple notation systems are used
• Each software program is a little different
• Most common is “Crows Foot”
0 .. *
1 .. *
1 .. 1
0 .. 1
Crows Foot Alternative
Prepared by Dr.T.Thendral 08.07.23
Relationship Cardinality and
Participation
• Cardinality: maximum number of times an instance
in one entity can be associated with instances in the
related entity
• Participation: minimum number of times an
instance in one entity can be associated with
instances in the related entity
Prepared by Dr.T.Thendral 08.07.23
Cardinality
• Maximum number of times an instance of an entity
can be associated with instances of a related entity
• Can ONLY have values of 1 or many
• Located closest to the entity in Crows Foot notation
Prepared by Dr.T.Thendral 08.07.23
Participation
• Minimum number of times an instance in one entity can be
associated with instances in the related entity
• Indicates whether an instance of an entity MUST participate in
the relationship
• Can ONLY have the values of 0 or 1
Prepared by Dr.T.Thendral 08.07.23
Mapping Cardinality and Participation
A1
A2
A3
A4
A5
A6
R1
R2
R3
R4
R5
R6
T1
T2
T3
Apple Grows_on AppleTree
Prepared by Dr.T.Thendral 08.07.23
Reading Cardinality and Participation
Prepared by Dr.T.Thendral 08.07.23
Relationship Examples
Left to Right: A site has 0 or more time series of data.
Right to Left: A time series is measured at 1 and only 1 site.
Left to Right: A variable has 0 or more time series of data.
Right to Left: A time series can have 1 and only 1 variable.
Prepared by Dr.T.Thendral 08.07.23
Relationship Examples
Left to Right: A TimeSeries has 1 or more Observations.
Right to Left: An Observation belongs to 1 and only 1
TimeSeries.
Left to Right: An Observation has 0 or more Qualifiers.
Right to Left: A Qualifier describes 0 or more Observations.
Prepared by Dr.T.Thendral 08.07.23
Primary and Foreign Keys
• Each row in a table should have an attribute that is a
persistent, unique identifier – the “Primary Key”
• Primary key in “parent” table
• Foreign key in “child” table
Prepared by Dr.T.Thendral 08.07.23
Primary and Foreign Key Example
OrchardID OwnerName Area_acres
1 John Appleseed 5.5
2 Daryl Appleseed 15
AppleTreeID Species Size DatePlanted OrchardID
1 Honeycris
p
5 4/15/2010 1
2 Honeycris
p
6 4/15/2010 1
3 Honeycris
p
3 4/15/2010 1
AppleID Color Weight AppleTreeID
1 Green 200 2
2 Green 180 2
3 Green 195 2
Orchards
Apple
Trees
Apples
Prepared by Dr.T.Thendral 08.07.23
Primary and Foreign Keys
• Usually consist of integer values
• MUST be the same data type in parent and
child tables
Prepared by Dr.T.Thendral 08.07.23
FUNCTIONAL MODELING AND
INFORMATION FLOW
Prepared by Dr.T.Thendral 08.07.23
Data Flow Diagrams
• Existed long before computers
• Show the flow of data through a system
• System
– Organization
– Company
– A computer hardware system
– A software system
• Icons
– Data on the move – named arrows
– Transformations of data – named bubbles
– Sources and destinations of data – named rectangles (terminators)
– Data in static storage – two parallel lines
Prepared by Dr.T.Thendral 08.07.23
Data Flow Diagram Notations
Yourdon and Coad
Process Notations
Gane and Sarson
Process Notation
Yourdon and Coad
Datastore Notation
Gane and Sarson
Datastore Notations
Process
A process transforms incoming data
flow into outgoing data flow.
Data Store
Data stores are repositories of
data in the system. They are
sometimes also referred to as
files.
Dataflow
Dataflows are pipelines through
which packets of information
flow. Label the arrows with the
name of the data that moves
through it.
External Entity
External entities are objects outside the
system, with which the system
communicates. External entities are sources
and destinations of the system's inputs and
outputs.
Prepared by Dr.T.Thendral 08.07.23
Data Flow Diagram Layers
• Data flow diagrams are drawn in several nested layers
• A single process node on a high level diagram can be expanded to show a
more detailed data flow diagram.
• Draw the context diagram first, followed by various layers of data flow
diagrams.
Prepared by Dr.T.Thendral 08.07.23
Context Diagrams
• A context diagram is a top level (also known as Level 0) data flow diagram. It only contains one process node (process 0) that
generalizes the function of the entire system in relationship to external entities.
Prepared by Dr.T.Thendral 08.07.23
DFD levels
The first level DFD shows the main processes within the
system. Each of these processes can be broken into
further processes until you reach pseudocode.
Prepared by Dr.T.Thendral 08.07.23

Software prototyping.pptx

  • 1.
    Software prototyping Prepared by Dr.T.Thendral AssistantProfessor Department of Computer Science Sri Ramaskrishna College of Arts & Science for Women Coimbatore Prepared by Dr.T.Thendral 08.07.23
  • 2.
    • Requirements elicitation"brainstorming" techniques is conducted, analysis principles are applied, and a model of the software to be built, called a prototype, is constructed for customer and developer assessment Prepared by Dr.T.Thendral 08.07.23
  • 3.
    Selecting the PrototypingApproach • The prototyping paradigm can be either close- ended or open-ended. • The close-ended approach is often called throwaway prototyping. • Using this approach, a prototype serves solely as a rough demonstration of requirements. • An open-ended approach, called evolutionary prototyping, uses the prototype as the first part of an analysis activity that will be continued into design and construction Prepared by Dr.T.Thendral 08.07.23
  • 4.
    • A numberof prototyping candidacy factors: and Application Area Application Complexity Customer Characteristics Project Characteristics Prepared by Dr.T.Thendral 08.07.23
  • 5.
    Prototyping in thesoftware process • Evolutionary prototyping – An approach to system development where an initial prototype is produced and refined through a number of stages to the final system • Throw-away prototyping – A prototype which is usually a practical implementation of the system is produced to help discover requirements problems and then discarded. The system is then developed using some other development process. Prepared by Dr.T.Thendral 08.07.23
  • 6.
    • The objectiveof evolutionary prototyping is to deliver a working system to end-users. The development starts with those requirements that are best understood. • The objective of throw-away prototyping is to validate or derive the system requirements. The prototyping process starts with those requirements that are poorly understood. Prepared by Dr.T.Thendral 08.07.23
  • 7.
  • 8.
    Prototyping Methods andTool Fourth Generation Techniques Reusable Software Components Formal Specification and Prototyping Environments Prepared by Dr.T.Thendral 08.07.23
  • 9.
    Fourth generation techniques •Fourth generation techniques encompass a broad array of database query and reporting languages, program and application generators, and other very high-level nonprocedural languages Prepared by Dr.T.Thendral 08.07.23
  • 10.
    Reusable software components •The prototype by using a set of existing software components Prepared by Dr.T.Thendral 08.07.23
  • 11.
    Formal specification andprototyping environments • A number of formal specification languages and tools have been developed as a replacement for natural language specification techniques • Today, developers of these formal languages are in the process of developing interactive environments that – enable an analyst to interactively create language- based specifications of a system or software – invoke automated tools that translate the language- based specifications into executable code, and – enable the customer to use the prototype executable code to refine formal requirements Prepared by Dr.T.Thendral 08.07.23
  • 12.
    Elements of analysismodel • Analysis model must achieve 3 primary goals: (1) to define what the customer needs, • (2) to build a basis for the establishment of a software design and • (3) to describe a group of needs which can be validated once the software is established Prepared by Dr.T.Thendral 08.07.23
  • 13.
  • 14.
    DATA MODELING -Objectives • Identify and describe important entities and relationships to model data • Develop data models to represent, organize, and store data • Design and use relational databases to organize, store and manipulate data Prepared by Dr.T.Thendral 08.07.23
  • 15.
    Data Modeling • Goal– make sure all data objects required by a database are completely and accurately represented • Data model design – the blueprint for creating a physical implementation of a database Prepared by Dr.T.Thendral 08.07.23
  • 16.
    Data Modeling Terms •Entity – a class of real world objects having common attributes (e.g., sites, variables, methods). • Attribute – A characteristic or property of an entity (site name, latitude, longitude) • Relationship – an association between two or more entities • Cardinality – the number of entities on either end of a relationship (one-to-one, one-to-many, many-to-many, etc.) Prepared by Dr.T.Thendral 08.07.23
  • 17.
    Data Modeling Exercise •Consider: – What is the “entity”? – What are the “attributes” of the entity? Prepared by Dr.T.Thendral 08.07.23
  • 18.
    Data Modeling Exercise •What is the entity? • What are the attributes? Prepared by Dr.T.Thendral 08.07.23
  • 19.
    Data Modeling Exercise •What is the entity? • What are the attributes? Prepared by Dr.T.Thendral 08.07.23
  • 20.
    Data Modeling Exercise •What are the relationships? Apple Apple Tree Orchard Grows On Grows In Prepared by Dr.T.Thendral 08.07.23
  • 21.
    Data Modeling Exercise •What are the relationships? Apple Apple Tree Orchard Grows On Grows In What about the business rules? Prepared by Dr.T.Thendral 08.07.23
  • 22.
    Entity Relationship Diagram •Documentation of the structure of the data • Used to communicate the design • Serve as the basis for data model implementation Prepared by Dr.T.Thendral 08.07.23
  • 23.
    Entity Relationship Diagram (RelationDatabase Context) • Entities effectively become tables • Attributes describe entities and become fields (columns) in tables • Relationships link tables on a common attribute or “key” and become formal constraints (part of the business rules) Prepared by Dr.T.Thendral 08.07.23
  • 24.
    ER Diagram EntityNotation Attributes Entity Entity Name Data Type Prepared by Dr.T.Thendral 08.07.23
  • 25.
    ER Diagram RelationshipNotation • Multiple notation systems are used • Each software program is a little different • Most common is “Crows Foot” 0 .. * 1 .. * 1 .. 1 0 .. 1 Crows Foot Alternative Prepared by Dr.T.Thendral 08.07.23
  • 26.
    Relationship Cardinality and Participation •Cardinality: maximum number of times an instance in one entity can be associated with instances in the related entity • Participation: minimum number of times an instance in one entity can be associated with instances in the related entity Prepared by Dr.T.Thendral 08.07.23
  • 27.
    Cardinality • Maximum numberof times an instance of an entity can be associated with instances of a related entity • Can ONLY have values of 1 or many • Located closest to the entity in Crows Foot notation Prepared by Dr.T.Thendral 08.07.23
  • 28.
    Participation • Minimum numberof times an instance in one entity can be associated with instances in the related entity • Indicates whether an instance of an entity MUST participate in the relationship • Can ONLY have the values of 0 or 1 Prepared by Dr.T.Thendral 08.07.23
  • 29.
    Mapping Cardinality andParticipation A1 A2 A3 A4 A5 A6 R1 R2 R3 R4 R5 R6 T1 T2 T3 Apple Grows_on AppleTree Prepared by Dr.T.Thendral 08.07.23
  • 30.
    Reading Cardinality andParticipation Prepared by Dr.T.Thendral 08.07.23
  • 31.
    Relationship Examples Left toRight: A site has 0 or more time series of data. Right to Left: A time series is measured at 1 and only 1 site. Left to Right: A variable has 0 or more time series of data. Right to Left: A time series can have 1 and only 1 variable. Prepared by Dr.T.Thendral 08.07.23
  • 32.
    Relationship Examples Left toRight: A TimeSeries has 1 or more Observations. Right to Left: An Observation belongs to 1 and only 1 TimeSeries. Left to Right: An Observation has 0 or more Qualifiers. Right to Left: A Qualifier describes 0 or more Observations. Prepared by Dr.T.Thendral 08.07.23
  • 33.
    Primary and ForeignKeys • Each row in a table should have an attribute that is a persistent, unique identifier – the “Primary Key” • Primary key in “parent” table • Foreign key in “child” table Prepared by Dr.T.Thendral 08.07.23
  • 34.
    Primary and ForeignKey Example OrchardID OwnerName Area_acres 1 John Appleseed 5.5 2 Daryl Appleseed 15 AppleTreeID Species Size DatePlanted OrchardID 1 Honeycris p 5 4/15/2010 1 2 Honeycris p 6 4/15/2010 1 3 Honeycris p 3 4/15/2010 1 AppleID Color Weight AppleTreeID 1 Green 200 2 2 Green 180 2 3 Green 195 2 Orchards Apple Trees Apples Prepared by Dr.T.Thendral 08.07.23
  • 35.
    Primary and ForeignKeys • Usually consist of integer values • MUST be the same data type in parent and child tables Prepared by Dr.T.Thendral 08.07.23
  • 36.
    FUNCTIONAL MODELING AND INFORMATIONFLOW Prepared by Dr.T.Thendral 08.07.23
  • 37.
  • 38.
  • 39.
    Data Flow Diagrams •Existed long before computers • Show the flow of data through a system • System – Organization – Company – A computer hardware system – A software system • Icons – Data on the move – named arrows – Transformations of data – named bubbles – Sources and destinations of data – named rectangles (terminators) – Data in static storage – two parallel lines Prepared by Dr.T.Thendral 08.07.23
  • 40.
    Data Flow DiagramNotations Yourdon and Coad Process Notations Gane and Sarson Process Notation Yourdon and Coad Datastore Notation Gane and Sarson Datastore Notations Process A process transforms incoming data flow into outgoing data flow. Data Store Data stores are repositories of data in the system. They are sometimes also referred to as files. Dataflow Dataflows are pipelines through which packets of information flow. Label the arrows with the name of the data that moves through it. External Entity External entities are objects outside the system, with which the system communicates. External entities are sources and destinations of the system's inputs and outputs. Prepared by Dr.T.Thendral 08.07.23
  • 41.
    Data Flow DiagramLayers • Data flow diagrams are drawn in several nested layers • A single process node on a high level diagram can be expanded to show a more detailed data flow diagram. • Draw the context diagram first, followed by various layers of data flow diagrams. Prepared by Dr.T.Thendral 08.07.23
  • 42.
    Context Diagrams • Acontext diagram is a top level (also known as Level 0) data flow diagram. It only contains one process node (process 0) that generalizes the function of the entire system in relationship to external entities. Prepared by Dr.T.Thendral 08.07.23
  • 43.
    DFD levels The firstlevel DFD shows the main processes within the system. Each of these processes can be broken into further processes until you reach pseudocode. Prepared by Dr.T.Thendral 08.07.23